- +1-315-215-1633
- sales@thebrainyinsights.com

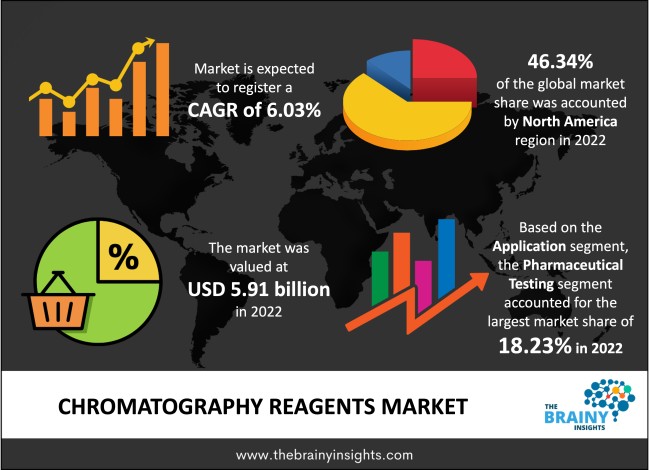
The global chromatography reagents market was valued at USD 5.91 Billion in 2022, increasing at a CAGR of 6.03% from 2023 to 2032 and anticipated to reach USD 10.61 Billion by 2032. Asia Pacific is expected to grow the fastest during the forecast period. Also, the high growth of the pharmaceutical industry, coupled with the surge in several drug development activities, is expected to drive market growth during the forecast period.
Chromatography is the collective term for laboratory techniques for separating mixtures. The separation is based on differential partitioning between the mobile & stationary phases. Chromatography can be divided into two main branches, depending on whether the mobile step is a liquid or a gas. Gas chromatography is used to analyze volatile, thermally stable materials. Liquid chromatography is especially useful for analyzing nonvolatile or thermally unstable organic substances. Commonly utilized chromatography techniques contain gel filtration, ion exchange chromatography, affinity chromatography, and hydrophobic interaction chromatography. Chromatographic reagents are used widely for the efficient purification of crystalline sugar & liquid sugar syrup in the food and beverage industry. The chromatography technique is used in the pharmaceutical industry for various purposes, including analyzing and recognizing samples for the presence of chemicals or trace elements, splitting chiral compounds, detecting mixture purity & presence of unknown compounds, preparing large quantities of incredibly pure materials, and drug development.
Get an overview of this study by requesting a free sample
The rising R&D spending in the pharmaceutical and biotech sectors: The increase in demand for the technology as the number of biotech and pharma businesses grows is driving the market growth. Moreover, the raised frequency of infectious disorders and technical developments in the life sciences & biotechnology industries are also expected to propel market growth. Additionally, the growing investments in genomics research and development and the availability of sophisticated technologies are anticipated to drive market growth over the forecast period. Also, the ever-increasing awareness of biopharmaceuticals and increasing economic growth are propelling the market growth.
The high cost of chromatography reagents: The high cost of chromatography reagents is hindering the market growth. Further, the enormous price of technology, which includes automated features and device design, also hampered the market growth during the forecast period. However, high costs associated with research and development proficiencies are also expected to restrain the market growth during the forecast period.
The increased adoption of chromatography techniques: The raised adoption of chromatography methods, majorly in the food & beverage and pharmaceutical industries, is the opportunity factor for market growth. Further, the increased use of technology in genomics, proteomics, metabolomic medicine, and innovation drive market growth. Moreover, the rampant chromatography reagent use across the industries like food and beverages, academics, and the cosmetics industry is helping to propel the market growth. Additionally, the rapidly increasing adoption of technologically advanced solutions and the availability of sophisticated technologies are anticipated to drive market growth over the forthcoming year.
The regions analyzed for the market include Europe, South America, Asia Pacific, North America, the Middle East, and Africa. North America emerged as the most significant global chromatography reagents market, with a 46.34% market revenue share in 2022. North America dominates the chromatography reagents market due to the growing popularity of green chromatography. Moreover, a broad and well-established R&D infrastructure, increased drug development activities, and the widespread adoption of technologically advanced solutions are also helping boost the market growth in this region during the forecast period. Additionally, the increasing purchasing power of educational institutes and the rising demand for chromatography tools in various research procedures are expected to drive the forecast period over the forecast period. Asia Pacific is expected to grow the fastest during the forecast period due to the comprehensive study on biologics and drugs. Further, a significant rise in the number of public-private investments in the pharmaceutical & life science research sectors is also helping to boost the market growth in this region. Moreover, the rising demand for chromatographic reagents across different end-use industries, like food & beverages, pharmaceuticals, biotechnology, and environmental testing applications, are expected to propel the market growth during the forecast period.
North America Region Chromatography Reagents Market Share in 2022 - 46.34%
www.thebrainyinsights.com
Check the geographical analysis of this market by requesting a free sample
The application segment is divided into biopharma-biotech applications, pharmaceutical testing, environmental testing, cosmeceutical applications, petrochemical analysis, clinical testing, forensic testing, food and beverage testing, research and academic applications. The pharmaceutical testing segment dominated, with a market share of around 18.23% in 2022. This growth is attributed to increased R&D for therapeutic areas like cancer, HIV/AIDS, and immunodeficiency disorders. The patent expiration of blockbuster drugs and biomolecules is also expected to boost the segment’s market growth. Further, by 2032, the environmental testing segment will likely dominate the market due to the government’s growing investments in high-tech testing services or tools to maintain hygienic & ecological standards.
Moreover, utilising chromatography reagents in environmental testing helps monitor contaminants via several tests, including liquid-liquid extraction, solid-phase extraction, desorption/adsorption procedures, or membrane filtration methods. However, food companies across different regions increasingly use chromatographic techniques during multiple production stages. These include monitoring quality throughout manufacturing processes, testing incoming materials before processing, and validating final product specifications by assuring they meet consumer acceptance criteria.
The separation mechanism segment is divided into partition, adsorption, ion exchange, affinity, size exclusion, and others. In 2022, the adsorption segment dominated the market with 24.15% and a USD 1.42 billion revenue. This growth is attributed to the growing applications of chromatography techniques. Additionally, adsorption chromatography is a type of liquid chromatography in which chemicals are included based on their desorption and adsorption at the surface of the support, which also serves as the stationary phase. Further, by 2032, the affinity segment will likely dominate the market due to the increasing demand for purification in immunotherapies.
The type segment is divided into derivatization reagents, buffers, ion-pair reagents, solvents, and others. In 2022, the solvents segment dominated the market with 28.17% and a USD 1.66 billion revenue. This growth is attributed to the increasing usage of chromatography and proteomics. However, a chromatographic analytical process called solvent chromatography separates ions or molecules dissolved in a solvent. Further, by 2032, the ion-pair reagents segment will likely dominate the market due to the high selectivity and speed, scalability, and prolonged separation performance. However, the derivatization method is used to reduce the polarity of amines & modify their feature. Derivatization reagents are used to alter compounds, which are then analyzed using gas chromatography and high-performance liquid. Additionally, the buffers are solutions formed by mixing a weak acid and its weak base or a conjugate base and its conjugate acid. Also, the buffers are crucial for their property of maintaining pH & analyzing ionizable analytes.
The end-user segment is divided into super critical fluid chromatography (SFC) reagents, liquid chromatography (LC) reagents, paper chromatography, thin layer chromatography (TLC) reagents, gas chromatography (GC) reagents, and others. In 2022, the liquid chromatography (LC) reagents segment dominated the market with 27.21% and a USD 1.60 billion revenue. This growth is attributed to the increasing demand for preclinical and clinical trials in the drug development process. Further, by 2032, the supercritical fluid chromatography (SFC) reagents segment will likely dominate the market due to the increasing demand for supercritical fluid chromatography in different industries.
| Attribute | Description |
|---|---|
| Market Size | Revenue (USD Billion) |
| Market size value in 2022 | USD 5.91 Billion |
| Market size value in 2032 | USD 10.61 Billion |
| CAGR (2023 to 2032) | 6.03% |
| Historical data | 2019-2021 |
| Base Year | 2022 |
| Forecast | 2023-2032 |
| Regional Segments | The key regions are North America, South America, Europe, Asia Pacific, and Middle East & Africa. |
| Segments | Key Segments are application, separation mechanism, type, end-user, and regions |
As per The Brainy Insights, the size of the chromatography reagents market was valued at USD 5.91 Billion in 2022 to USD 10.61 Billion by 2032.
The global chromatography reagents market is growing at a CAGR of 6.03% during the forecast period 2023-2032.
North America region emerged as the largest market for chromatography reagents.
1. Introduction
1.1. Objectives of the Study
1.2. Market Definition
1.3. Research Scope
1.4. Currency
1.5. Key Target Audience
2. Research Methodology and Assumptions
3. Executive Summary
4. Premium Insights
4.1. Porter’s Five Forces Analysis
4.2. Value Chain Analysis
4.3. Top Investment Pockets
4.3.1. Market Attractiveness Analysis By Application
4.3.2. Market Attractiveness Analysis By Separation Mechanism
4.3.3. Market Attractiveness Analysis By Type
4.3.4. Market Attractiveness Analysis By End-User
4.3.5. Market Attractiveness Analysis By Region
4.4. Industry Trends
5. Market Dynamics
5.1. Market Evaluation
5.2. Drivers
5.2.1. The high growth of the pharmaceutical industry
5.2.2. The growing importance of chromatographic testing in drug approvals
5.2.3. The rising R&D spending in the pharmaceutical and biotech sectors
5.2.4. The rising importance of chromatography across various industries
5.3. Restraints
5.3.1. The high cost of chromatography reagents
5.3.2. The shortage of skilled professionals
5.4. Opportunities
5.4.1. The increased adoption of chromatography techniques
1. Global Chromatography Reagents Market Analysis and Forecast, By Application
1.1. Segment Overview
1.2. Biopharma-Biotech Applications
1.3. Pharmaceutical Testing
1.4. Environmental Testing
1.5. Cosmeceutical Applications
1.6. Petrochemical Analysis
1.7. Clinical Testing
1.8. Forensic Testing
1.9. Food and Beverage Testing
1.10. Research and Academic Applications
2. Global Chromatography Reagents Market Analysis and Forecast, By Separation Mechanism
2.1. Segment Overview
2.2. Partition
2.3. Adsorption
2.4. Ion Exchange
2.5. Affinity
2.6. Size Exclusion
2.7. Others
3. Global Chromatography Reagents Market Analysis and Forecast, By Type
3.1. Segment Overview
3.2. Derivatization Reagents
3.3. Buffers
3.4. Ion-Pair Reagents
3.5. Solvents
3.6. Others
4. Global Chromatography Reagents Market Analysis and Forecast, By End-User
5.5. Segment Overview
5.6. Super Critical Fluid Chromatography (SFC) Reagents
5.7. Liquid Chromatography (LC) Reagents
5.8. Paper Chromatography
5.9. Thin Layer Chromatography (TLC) Reagents
5.10. Gas Chromatography (GC) Reagents
5.11. Others
5. Global Chromatography Reagents Market Analysis and Forecast, By Regional Analysis
5.1. Segment Overview
5.2. North America
5.2.1. U.S.
5.2.2. Canada
5.2.3. Mexico
5.3. Europe
5.3.1. Germany
5.3.2. France
5.3.3. U.K.
5.3.4. Italy
5.3.5. Spain
5.4. Asia-Pacific
5.4.1. Japan
5.4.2. China
5.4.3. India
5.5. South America
5.5.1. Brazil
5.6. Middle East and Africa
5.6.1. UAE
5.6.2. South Africa
6. Global Chromatography Reagents Market-Competitive Landscape
6.1. Overview
6.2. Market Share of Key Players in Global Chromatography Reagents Market
6.2.1. Global Company Market Share
6.2.2. North America Company Market Share
6.2.3. Europe Company Market Share
6.2.4. APAC Company Market Share
6.3. Competitive Situations and Trends
6.3.1. Product Launches and Developments
6.3.2. Partnerships, Collaborations, and Agreements
6.3.3. Mergers & Acquisitions
6.3.4. Expansions
7. Company Profiles
7.1. Agilent Technologies, Inc.
7.1.1. Business Overview
7.1.2. Company Snapshot
7.1.3. Company Market Share Analysis
7.1.4. Company Product Portfolio
7.1.5. Recent Developments
7.1.6. SWOT Analysis
7.2. Bio-Rad Laboratories, Inc.
7.2.1. Business Overview
7.2.2. Company Snapshot
7.2.3. Company Market Share Analysis
7.2.4. Company Product Portfolio
7.2.5. Recent Developments
7.2.6. SWOT Analysis
7.3. Loba Chemie Pvt. Ltd
7.3.1. Business Overview
7.3.2. Company Snapshot
7.3.3. Company Market Share Analysis
7.3.4. Company Product Portfolio
7.3.5. Recent Developments
7.3.6. SWOT Analysis
7.4. Chiron AS
7.4.1. Business Overview
7.4.2. Company Snapshot
7.4.3. Company Market Share Analysis
7.4.4. Company Product Portfolio
7.4.5. Recent Developments
7.4.6. SWOT Analysis
7.5. Kanto Chemical
7.5.1. Business Overview
7.5.2. Company Snapshot
7.5.3. Company Market Share Analysis
7.5.4. Company Product Portfolio
7.5.5. Recent Developments
7.5.6. SWOT Analysis
7.6. Avantor
7.6.1. Business Overview
7.6.2. Company Snapshot
7.6.3. Company Market Share Analysis
7.6.4. Company Product Portfolio
7.6.5. Recent Developments
7.6.6. SWOT Analysis
7.7. Regis Technologies, Inc.
7.7.1. Business Overview
7.7.2. Company Snapshot
7.7.3. Company Market Share Analysis
7.7.4. Company Product Portfolio
7.7.5. Recent Developments
7.7.6. SWOT Analysis
7.8. Cytiva, Merck KGaA
7.8.1. Business Overview
7.8.2. Company Snapshot
7.8.3. Company Market Share Analysis
7.8.4. Company Product Portfolio
7.8.5. Recent Developments
7.8.6. SWOT Analysis
7.9. GFS Chemicals Inc.
7.9.1. Business Overview
7.9.2. Company Snapshot
7.9.3. Company Market Share Analysis
7.9.4. Company Product Portfolio
7.9.5. Recent Developments
7.9.6. SWOT Analysis
7.10. Santa Cruz Biotechnology
7.10.1. Business Overview
7.10.2. Company Snapshot
7.10.3. Company Market Share Analysis
7.10.4. Company Product Portfolio
7.10.5. Recent Developments
7.10.6. SWOT Analysis
7.11. Spectrum Chemical Mfg. Corp.
7.11.1. Business Overview
7.11.2. Company Snapshot
7.11.3. Company Market Share Analysis
7.11.4. Company Product Portfolio
7.11.5. Recent Developments
7.11.6. SWOT Analysis
7.12. Restek
7.12.1. Business Overview
7.12.2. Company Snapshot
7.12.3. Company Market Share Analysis
7.12.4. Company Product Portfolio
7.12.5. Recent Developments
7.12.6. SWOT Analysis
7.13. Tosoh Bioscience
7.13.1. Business Overview
7.13.2. Company Snapshot
7.13.3. Company Market Share Analysis
7.13.4. Company Product Portfolio
7.13.5. Recent Developments
7.13.6. SWOT Analysis
7.14. Thermo Fisher Scientific
7.14.1. Business Overview
7.14.2. Company Snapshot
7.14.3. Company Market Share Analysis
7.14.4. Company Product Portfolio
7.14.5. Recent Developments
7.14.6. SWOT Analysis
7.15. Waters Corporation
7.15.1. Business Overview
7.15.2. Company Snapshot
7.15.3. Company Market Share Analysis
7.15.4. Company Product Portfolio
7.15.5. Recent Developments
7.15.6. SWOT Analysis
List of Table
1. Global Chromatography Reagents Market, By Application, 2019-2032 (USD Billion)
2. Global Biopharma-Biotech Applications, Chromatography Reagents Market, By Region, 2019-2032 (USD Billion)
3. Global Pharmaceutical Testing, Chromatography Reagents Market, By Region, 2019-2032 (USD Billion)
4. Global Environmental Testing, Chromatography Reagents Market, By Region, 2019-2032 (USD Billion)
5. Global Cosmeceutical Applications, Chromatography Reagents Market, By Region, 2019-2032 (USD Billion)
6. Global Petrochemical Analysis, Chromatography Reagents Market, By Region, 2019-2032 (USD Billion)
7. Global Clinical Testing, Chromatography Reagents Market, By Region, 2019-2032 (USD Billion)
8. Global Forensic Testing, Chromatography Reagents Market, By Region, 2019-2032 (USD Billion)
9. Global Food and Beverage Testing, Chromatography Reagents Market, By Region, 2019-2032 (USD Billion)
10. Global Research and Academic Applications, Chromatography Reagents Market, By Region, 2019-2032 (USD Billion)
11. Global Chromatography Reagents Market, By Separation Mechanism, 2019-2032 (USD Billion)
12. Global Partition, Chromatography Reagents Market, By Region, 2019-2032 (USD Billion)
13. Global Adsorption, Chromatography Reagents Market, By Region, 2019-2032 (USD Billion)
14. Global Ion Exchange, Chromatography Reagents Market, By Region, 2019-2032 (USD Billion)
15. Global Affinity, Chromatography Reagents Market, By Region, 2019-2032 (USD Billion)
16. Global Size Exclusion, Chromatography Reagents Market, By Region, 2019-2032 (USD Billion)
17. Global Others, Chromatography Reagents Market, By Region, 2019-2032 (USD Billion)
18. Global Chromatography Reagents Market, By Type, 2019-2032 (USD Billion)
19. Global Derivatization Reagents, Chromatography Reagents Market, By Region, 2019-2032 (USD Billion)
20. Global Buffers, Chromatography Reagents Market, By Region, 2019-2032 (USD Billion)
21. Global Ion-Pair Reagents, Chromatography Reagents Market, By Region, 2019-2032 (USD Billion)
22. Global Solvents, Chromatography Reagents Market, By Region, 2019-2032 (USD Billion)
23. Global Others, Chromatography Reagents Market, By Region, 2019-2032 (USD Billion)
24. Global Chromatography Reagents Market, By End-User, 2019-2032 (USD Billion)
25. Global Super Critical Fluid Chromatography (SFC) Reagents, Chromatography Reagents Market, By Region, 2019-2032 (USD Billion)
26. Global Liquid Chromatography (LC) Reagents, Chromatography Reagents Market, By Region, 2019-2032 (USD Billion)
27. Global Paper Chromatography, Chromatography Reagents Market, By Region, 2019-2032 (USD Billion)
28. Global Thin Layer Chromatography (TLC) Reagents, Chromatography Reagents Market, By Region, 2019-2032 (USD Billion)
29. Global Gas Chromatography (GC) Reagents, Chromatography Reagents Market, By Region, 2019-2032 (USD Billion)
30. Global Others, Chromatography Reagents Market, By Region, 2019-2032 (USD Billion)
31. North America Chromatography Reagents Market, By Application, 2019-2032 (USD Billion)
32. North America Chromatography Reagents Market, By Separation Mechanism, 2019-2032 (USD Billion)
33. North America Chromatography Reagents Market, By Type, 2019-2032 (USD Billion)
34. North America Chromatography Reagents Market, By End-User, 2019-2032 (USD Billion)
35. U.S. Chromatography Reagents Market, By Application, 2019-2032 (USD Billion)
36. U.S. Chromatography Reagents Market, By Separation Mechanism, 2019-2032 (USD Billion)
37. U.S. Chromatography Reagents Market, By Type, 2019-2032 (USD Billion)
38. U.S. Chromatography Reagents Market, By End-User, 2019-2032 (USD Billion)
39. Canada Chromatography Reagents Market, By Application, 2019-2032 (USD Billion)
40. Canada Chromatography Reagents Market, By Separation Mechanism, 2019-2032 (USD Billion)
41. Canada Chromatography Reagents Market, By Type, 2019-2032 (USD Billion)
42. Canada Chromatography Reagents Market, By End-User, 2019-2032 (USD Billion)
43. Mexico Chromatography Reagents Market, By Application, 2019-2032 (USD Billion)
44. Mexico Chromatography Reagents Market, By Separation Mechanism, 2019-2032 (USD Billion)
45. Mexico Chromatography Reagents Market, By Type, 2019-2032 (USD Billion)
46. Mexico Chromatography Reagents Market, By End-User, 2019-2032 (USD Billion)
47. Europe Chromatography Reagents Market, By Application, 2019-2032 (USD Billion)
48. Europe Chromatography Reagents Market, By Separation Mechanism, 2019-2032 (USD Billion)
49. Europe Chromatography Reagents Market, By Type, 2019-2032 (USD Billion)
50. Europe Chromatography Reagents Market, By End-User, 2019-2032 (USD Billion)
51. Germany Chromatography Reagents Market, By Application, 2019-2032 (USD Billion)
52. Germany Chromatography Reagents Market, By Separation Mechanism, 2019-2032 (USD Billion)
53. Germany Chromatography Reagents Market, By Type, 2019-2032 (USD Billion)
54. Germany Chromatography Reagents Market, By End-User, 2019-2032 (USD Billion)
55. France Chromatography Reagents Market, By Application, 2019-2032 (USD Billion)
56. France Chromatography Reagents Market, By Separation Mechanism, 2019-2032 (USD Billion)
57. France Chromatography Reagents Market, By Type, 2019-2032 (USD Billion)
58. France Chromatography Reagents Market, By End-User, 2019-2032 (USD Billion)
59. U.K. Chromatography Reagents Market, By Application, 2019-2032 (USD Billion)
60. U.K. Chromatography Reagents Market, By Separation Mechanism, 2019-2032 (USD Billion)
61. U.K. Chromatography Reagents Market, By Type, 2019-2032 (USD Billion)
62. U.K. Chromatography Reagents Market, By End-User, 2019-2032 (USD Billion)
63. Italy Chromatography Reagents Market, By Application, 2019-2032 (USD Billion)
64. Italy Chromatography Reagents Market, By Separation Mechanism, 2019-2032 (USD Billion)
65. Italy Chromatography Reagents Market, By Type, 2019-2032 (USD Billion)
66. Italy Chromatography Reagents Market, By End-User, 2019-2032 (USD Billion)
67. Spain Chromatography Reagents Market, By Application, 2019-2032 (USD Billion)
68. Spain Chromatography Reagents Market, By Separation Mechanism, 2019-2032 (USD Billion)
69. Spain Chromatography Reagents Market, By Type, 2019-2032 (USD Billion)
70. Spain Chromatography Reagents Market, By End-User, 2019-2032 (USD Billion)
71. Asia Pacific Chromatography Reagents Market, By Application, 2019-2032 (USD Billion)
72. Asia Pacific Chromatography Reagents Market, By Separation Mechanism, 2019-2032 (USD Billion)
73. Asia Pacific Chromatography Reagents Market, By Type, 2019-2032 (USD Billion)
74. Asia Pacific Chromatography Reagents Market, By End-User, 2019-2032 (USD Billion)
75. Japan Chromatography Reagents Market, By Application, 2019-2032 (USD Billion)
76. Japan Chromatography Reagents Market, By Separation Mechanism, 2019-2032 (USD Billion)
77. Japan Chromatography Reagents Market, By Type, 2019-2032 (USD Billion)
78. Japan Chromatography Reagents Market, By End-User, 2019-2032 (USD Billion)
79. China Chromatography Reagents Market, By Application, 2019-2032 (USD Billion)
80. China Chromatography Reagents Market, By Separation Mechanism, 2019-2032 (USD Billion)
81. China Chromatography Reagents Market, By Type, 2019-2032 (USD Billion)
82. China Chromatography Reagents Market, By End-User, 2019-2032 (USD Billion)
83. India Chromatography Reagents Market, By Application, 2019-2032 (USD Billion)
84. India Chromatography Reagents Market, By Separation Mechanism, 2019-2032 (USD Billion)
85. India Chromatography Reagents Market, By Type, 2019-2032 (USD Billion)
86. India Chromatography Reagents Market, By End-User, 2019-2032 (USD Billion)
87. South America Chromatography Reagents Market, By Application, 2019-2032 (USD Billion)
88. South America Chromatography Reagents Market, By Separation Mechanism, 2019-2032 (USD Billion)
89. South America Chromatography Reagents Market, By Type, 2019-2032 (USD Billion)
90. South America Chromatography Reagents Market, By End-User, 2019-2032 (USD Billion)
91. Brazil Chromatography Reagents Market, By Application, 2019-2032 (USD Billion)
92. Brazil Chromatography Reagents Market, By Separation Mechanism, 2019-2032 (USD Billion)
93. Brazil Chromatography Reagents Market, By Type, 2019-2032 (USD Billion)
94. Brazil Chromatography Reagents Market, By End-User, 2019-2032 (USD Billion)
95. Middle East and Africa Chromatography Reagents Market, By Application, 2019-2032 (USD Billion)
96. Middle East and Africa Chromatography Reagents Market, By Separation Mechanism, 2019-2032 (USD Billion)
97. Middle East and Africa Chromatography Reagents Market, By Type, 2019-2032 (USD Billion)
98. Middle East and Africa Chromatography Reagents Market, By End-User, 2019-2032 (USD Billion)
99. UAE Chromatography Reagents Market, By Application, 2019-2032 (USD Billion)
100. UAE Chromatography Reagents Market, By Separation Mechanism, 2019-2032 (USD Billion)
101. UAE Chromatography Reagents Market, By Type, 2019-2032 (USD Billion)
102. UAE Chromatography Reagents Market, By End-User, 2019-2032 (USD Billion)
103. South Africa Chromatography Reagents Market, By Application, 2019-2032 (USD Billion)
104. South Africa Chromatography Reagents Market, By Separation Mechanism, 2019-2032 (USD Billion)
105. South Africa Chromatography Reagents Market, By Type, 2019-2032 (USD Billion)
106. South Africa Chromatography Reagents Market, By End-User, 2019-2032 (USD Billion)
List of Figures
1. Global Chromatography Reagents Market Segmentation
2. Global Chromatography Reagents Market: Research Methodology
3. Market Size Estimation Methodology: Bottom-Up Approach
4. Market Size Estimation Methodology: Top-Down Approach
5. Data Triangulation
6. Porter’s Five Forces Analysis
7. Value Chain Analysis
8. Global Chromatography Reagents Market Attractiveness Analysis By Application
9. Global Chromatography Reagents Market Attractiveness Analysis By Separation Mechanism
10. Global Chromatography Reagents Market Attractiveness Analysis By Type
11. Global Chromatography Reagents Market Attractiveness Analysis By End-User
12. Global Chromatography Reagents Market Attractiveness Analysis By Region
13. Global Chromatography Reagents Market: Dynamics
14. Global Chromatography Reagents Market Share By Application (2023 & 2032)
15. Global Chromatography Reagents Market Share By Separation Mechanism (2023 & 2032)
16. Global Chromatography Reagents Market Share By Type (2023 & 2032)
17. Global Chromatography Reagents Market Share By End-User (2023 & 2032)
18. Global Chromatography Reagents Market Share By Regions (2023 & 2032)
19. Global Chromatography Reagents Market Share By Company (2022)
This study forecasts revenue at global, regional, and country levels from 2019 to 2032. The Brainy Insights has segmented the global chromatography reagents based on below mentioned segments:
Global Chromatography Reagents Market by Application:
Global Chromatography Reagents Market By Separation Mechanism
Global Chromatography Reagents Market By Type
Global Chromatography Reagents Market By End-User
Global Chromatography Reagents by Region:
Research has its special purpose to undertake marketing efficiently. In this competitive scenario, businesses need information across all industry verticals; the information about customer wants, market demand, competition, industry trends, distribution channels etc. This information needs to be updated regularly because businesses operate in a dynamic environment. Our organization, The Brainy Insights incorporates scientific and systematic research procedures in order to get proper market insights and industry analysis for overall business success. The analysis consists of studying the market from a miniscule level wherein we implement statistical tools which helps us in examining the data with accuracy and precision.
Our research reports feature both; quantitative and qualitative aspects for any market. Qualitative information for any market research process are fundamental because they reveal the customer needs and wants, usage and consumption for any product/service related to a specific industry. This in turn aids the marketers/investors in knowing certain perceptions of the customers. Qualitative research can enlighten about the different product concepts and designs along with unique service offering that in turn, helps define marketing problems and generate opportunities. On the other hand, quantitative research engages with the data collection process through interviews, e-mail interactions, surveys and pilot studies. Quantitative aspects for the market research are useful to validate the hypotheses generated during qualitative research method, explore empirical patterns in the data with the help of statistical tools, and finally make the market estimations.
The Brainy Insights offers comprehensive research and analysis, based on a wide assortment of factual insights gained through interviews with CXOs and global experts and secondary data from reliable sources. Our analysts and industry specialist assume vital roles in building up statistical tools and analysis models, which are used to analyse the data and arrive at accurate insights with exceedingly informative research discoveries. The data provided by our organization have proven precious to a diverse range of companies, facilitating them to address issues such as determining which products/services are the most appealing, whether or not customers use the product in the manner anticipated, the purchasing intentions of the market and many others.
Our research methodology encompasses an idyllic combination of primary and secondary initiatives. Key phases involved in this process are listed below:

The phase involves the gathering and collecting of market data and its related information with the help of different sources & research procedures.

The data procurement stage involves in data gathering and collecting through various data sources.
This stage involves in extensive research. These data sources includes:
Purchased Database: Purchased databases play a crucial role in estimating the market sizes irrespective of the domain. Our purchased database includes:
Primary Research: The Brainy Insights interacts with leading companies and experts of the concerned domain to develop the analyst team’s market understanding and expertise. It improves and substantiates every single data presented in the market reports. Primary research mainly involves in telephonic interviews, E-mail interactions and face-to-face interviews with the raw material providers, manufacturers/producers, distributors, & independent consultants. The interviews that we conduct provides valuable data on market size and industry growth trends prevailing in the market. Our organization also conducts surveys with the various industry experts in order to gain overall insights of the industry/market. For instance, in healthcare industry we conduct surveys with the pharmacists, doctors, surgeons and nurses in order to gain insights and key information of a medical product/device/equipment which the customers are going to usage. Surveys are conducted in the form of questionnaire designed by our own analyst team. Surveys plays an important role in primary research because surveys helps us to identify the key target audiences of the market. Additionally, surveys helps to identify the key target audience engaged with the market. Our survey team conducts the survey by targeting the key audience, thus gaining insights from them. Based on the perspectives of the customers, this information is utilized to formulate market strategies. Moreover, market surveys helps us to understand the current competitive situation of the industry. To be precise, our survey process typically involve with the 360 analysis of the market. This analytical process begins by identifying the prospective customers for a product or service related to the market/industry to obtain data on how a product/service could fit into customers’ lives.

Secondary Research: The secondary data sources includes information published by the on-profit organizations such as World bank, WHO, company fillings, investor presentations, annual reports, national government documents, statistical databases, blogs, articles, white papers and others. From the annual report, we analyse a company’s revenue to understand the key segment and market share of that organization in a particular region. We analyse the company websites and adopt the product mapping technique which is important for deriving the segment revenue. In the product mapping method, we select and categorize the products offered by the companies catering to domain specific market, deduce the product revenue for each of the companies so as to get overall estimation of the market size. We also source data and analyses trends based on information received from supply side and demand side intermediaries in the value chain. The supply side denotes the data gathered from supplier, distributor, wholesaler and the demand side illustrates the data gathered from the end customers for respective market domain.

The supply side for a domain specific market is analysed by:
The demand side for the market is estimated through:
In-house Library: Apart from these third-party sources, we have our in-house library of qualitative and quantitative information. Our in-house database includes market data for various industry and domains. These data are updated on regular basis as per the changing market scenario. Our library includes, historic databases, internal audit reports and archives.
Sometimes there are instances where there is no metadata or raw data available for any domain specific market. For those cases, we use our expertise to forecast and estimate the market size in order to generate comprehensive data sets. Our analyst team adopt a robust research technique in order to produce the estimates:
Data Synthesis: This stage involves the analysis & mapping of all the information obtained from the previous step. It also involves in scrutinizing the data for any discrepancy observed while data gathering related to the market. The data is collected with consideration to the heterogeneity of sources. Robust scientific techniques are in place for synthesizing disparate data sets and provide the essential contextual information that can orient market strategies. The Brainy Insights has extensive experience in data synthesis where the data passes through various stages:


Market Deduction & Formulation: The final stage comprises of assigning data points at appropriate market spaces so as to deduce feasible conclusions. Analyst perspective & subject matter expert based holistic form of market sizing coupled with industry analysis also plays a crucial role in this stage.
This stage involves in finalization of the market size and numbers that we have collected from data integration step. With data interpolation, it is made sure that there is no gap in the market data. Successful trend analysis is done by our analysts using extrapolation techniques, which provide the best possible forecasts for the market.
Data Validation & Market Feedback: Validation is the most important step in the process. Validation & re-validation via an intricately designed process helps us finalize data-points to be used for final calculations.

The Brainy Insights interacts with leading companies and experts of the concerned domain to develop the analyst team’s market understanding and expertise. It improves and substantiates every single data presented in the market reports. The data validation interview and discussion panels are typically composed of the most experienced industry members. The participants include, however, are not limited to:
Moreover, we always validate our data and findings through primary respondents from all the major regions we are working on.


Free Customization
Fortune 500 Clients
Free Yearly Update On Purchase Of Multi/Corporate License
Companies Served Till Date