- +1-315-215-1633
- sales@thebrainyinsights.com

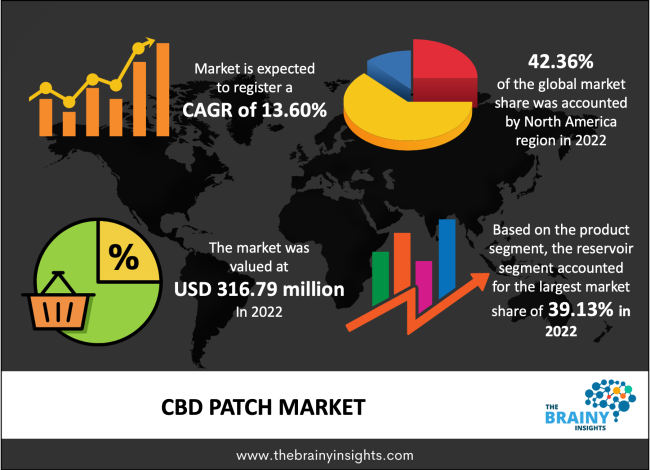
The global CBD patch market was valued at USD 316.79 million in 2022, increasing at a CAGR of 13.60% from 2022 to 2030 and anticipated to reach USD 878.61 million by 2030. Asia Pacific is expected to grow the fastest during the forecast period. Further, the rising use of cannabis derivatives for various medical conditions drives market growth. Moreover, the increasing use of CBD patches for pain relief and consumer awareness acts is also helping to stimulate market growth during the forecast period.
CBD patches are adhesives that include Cannabidiol, a compound from the hemp plant which delivers numerous wellness and health benefits. Cannabidiol (CBD) is used for anxiety, treating pain, Crohn disease, muscle disorder (dystonia), Parkinson's disease and many other medical conditions. A CBD patch is a small patch that sticks to the skin. It's similar to a nicotine patch but contains CBD and other ingredients to help with localized pain relief. CBD patches are identical in build to plasters & are applied to the skin, providing a slow release of Cannabidiol, which is absorbed into the bloodstream.
Get an overview of this study by requesting a free sample
The rising adoption of Cannabidiol (CBD) in medical applications: The increasing awareness among the population regarding the medical benefits of CBD is the driving factor of the market growth. Additionally, the high effectiveness of cannabidiol extracted from marijuana is a driving factor of the market growth. Further, the increasing demand for cannabidiol from cosmetics has propelled the market growth. Moreover, the ever-rising investment from governments and major players in the R&D sector is helping to boost market growth. Additionally, cannabidiol is the most broadly utilized Cannabidiol (CBD) for therapeutic purposes due to its lack of psychoactive effects are propelling the market growth. Further, a strong web of online sales channels, a high degree of awareness about the different benefits of cannabidiol, and the introduction of retail products such as CBD gummies, CBD oil, and CBD beverages are propelling the market growth over the forecast period.
The adverse consequences/side effects and legalization of different medicinal cannabis drugs: The side effects of medical cannabis, like cognitive impairment associated with its use as a medicine, are anticipated to hinder the market growth over the projection period. Further, the existence of strict regulations along with the high cost of cannabidiol products is restraining the market growth. Additionally, the absence of legalization initiatives in many African and Asian countries hamper the market growth. Moreover, regulations imposed on the application and sales of certain products are expected to hinder market growth.
The technological advancements in Cannabidiol (CBD) drug treatments: The revealing benefits and adoption of transdermal drug delivery are driving market growth factors. Also, the increased acceptance of CBD-based products to treat diseases propels market growth. Moreover, the increasing demand for Cannabidiol (CBD) for health and wellness purposes is vital due to its therapeutic characteristics, which drive market growth. Additionally, the growing research towards developing modified CBD oil extracts stimulates market growth. Further, the increasing approvals for medicinal cannabis products, along with the growing research and development activities by the key players, are propelling the market growth over the forecast period.
The regions analyzed for the market include Europe, South America, Asia Pacific, North America, the Middle East, and Africa. North America emerged as the largest global CBD patch market, with a 42.36% market revenue share in 2022. North America dominates the CBD patch market due to the increasing demand from the pharmaceutical sector. Further, the presence of developed healthcare infrastructure and the high healthcare expenditure are also propelling the market growth during the forecast period in this region. Moreover, the expanding research areas and the rising demand for natural products are driving factors of the market growth. Additionally, the presence of favourable laws regarding the use of CBD products and the increasingly health-conscious population in the country are stimulating market growth during the forecast period in this region. Apart from this, the rising government initiatives to enhance regional healthcare and the subsequently increasing cannabinoid product penetration are also helping to boost the region's market growth during the forecast period. Additionally, Asia Pacific is expected to grow the fastest during the forecast period due to the rising chronic pain incidences of the senior population in Japan and China. Also, the presence of world-class healthcare infrastructure, high health cognizance among people, leading pharmaceutical companies, and high disposable income are expected to propel market growth in this region. Moreover, the strong R&D and promotion of new therapies and the increased acceptance of CBD-based products to treat diseases are driving the market growth during the forecast period in this region.
North America Region CBD Patch Market Share in 2022 - 42.36%
www.thebrainyinsights.com
Check the geographical analysis of this market by requesting a free sample
The product segment is divided into the matrix, reservoir, and layer drug-in-adhesive. The reservoir segment dominated, with a market share of around 39.13% in 2022. This growth is attributed to the introduction of pressure-sensitive adhesives and permeation enhancers. Further, by 2030, the layer drug-in-adhesive segment will likely dominate the market due to the growing population with chronic ailments demand for better systems to deliver vaccines. Also, the increasing beneficial government initiatives and an increase in the number of research partnerships are helping to boost the segment’s market growth.
The species segment is divided into sativa, cannabis indica, and hybrid. In 2022, the cannabis indica segment dominated the market, accounting for around 38.18% of global revenue. This growth is attributed to the growing percentage of countries permitting the usage of medical marijuana in various parts of the globe.
The derivatives segment is divided into tetrahydrocannabinol (THC), Cannabidiol (CBD), and others. In 2022, the cannabidiol (CBD) segment dominated the market, accounting for around 41.22% of global revenue. This growth is attributed to the increasing demand from the pharmaceutical sector.
The source type segment is divided into synthetic and natural. In 2022, the natural segment dominated the market, accounting for around 54.12% of global revenue. This growth is attributed to the increasing awareness of CBD oil.
The application segment is divided into an elevate mood, chronic pain, neurological pain, arthritis, anxiety, and others. In 2022, the chronic pain segment dominated the market, accounting for around 21.18% of global revenue. This growth is attributed to increased cases of chronic pain such as neck pain, shoulder pain, etc. Also, the growing geriatric population across the world, as well as the sedentary lifestyle, are helping to boost the segment's market growth.
The distribution channel segment is divided into online, dispensaries & pharmacies, and conventional stores. In 2022, the online segment dominated the market, accounting for around 36.15% of global revenue. This growth is attributed to its wide availability and relatively lower prices. Further, by 2030, the dispensaries & pharmacies segment will likely dominate the market due to its presence and established supply chain from manufacturer to consumer. Also, the growing awareness regarding the medical benefits of Cannabidiol, including its healing properties, is helping to boost the segment's market growth.
The end-user segment is divided into rehab centers, clinics, home care settings, hospitals, research & development centers, and others. In 2022, the homecare setting segment dominated the market, accounting for around 23.02% of global revenue. This growth is attributed to the advent of advanced home healthcare services.
| Attribute | Description |
|---|---|
| Market Size | Revenue (USD Million) |
| Market size value in 2022 | USD 316.79 million |
| Market size value in 2030 | USD 878.61 million |
| CAGR (2022 to 2030) | 13.60% |
| Historical data | 2019-2020 |
| Base Year | 2021 |
| Forecast | 2022-2030 |
| Segments | Key Segments are product, species, derivatives, source type, application, distribution channel, end-user, and regions |
| Regional Segments | The key regions are North America, South America, Europe, Asia Pacific, and Middle East & Africa. |
North America region emerged as the largest market for the CBD patch.
The market's growth will be influenced by the rising adoption of Cannabidiol (CBD) in medical applications.
The lack of approvals & CBD acceptance could hamper the market growth.
The technological advancements in Cannabidiol (CBD) drug treatments will provide huge opportunities to the market.
Key players Always pure organics, NENO'S Naturals, CBD British Cannabis, Pure Ratio Wellness, Atlas Thrive, Mary's Medicinals, Pacific Roots, Pure Kana, Essentia Pura and among others.
1. Introduction
1.1. Objectives of the Study
1.2. Market Definition
1.3. Research Scope
1.4. Currency
1.5. Key Target Audience
2. Research Methodology and Assumptions
3. Executive Summary
4. Premium Insights
4.1. Porter’s Five Forces Analysis
4.2. Value Chain Analysis
4.3. Top Investment Pockets
4.3.1. Market Attractiveness Analysis By Product
4.3.2. Market Attractiveness Analysis By Species
4.3.3. Market Attractiveness Analysis By Derivatives
4.3.4. Market Attractiveness Analysis By Source Type
4.3.5. Market Attractiveness Analysis By Application
4.3.6. Market Attractiveness Analysis By Distribution Channel
4.3.7. Market Attractiveness Analysis By End-User
4.3.8. Market Attractiveness Analysis By Region
4.4. Industry Trends
5. Market Dynamics
5.1. Market Evaluation
5.2. Drivers
5.2.1. The legalization of the use of CBD oil and related products
5.2.2. The growing research and development activities
5.2.3. The rising sales & applications of CBD patches
5.3. Restraints
5.3.1. The lack of approvals & CBD acceptance
5.3.2. The adverse consequences/side effects and legalization of different medicinal cannabis drugs
5.4. Opportunities
5.4.1. The rising demand for cannabidiol in fitness and health
5.4.2. The technological advancements in Cannabidiol (CBD) drug treatments
1. Global CBD Patch Market Analysis and Forecast, By Product
1.1. Segment Overview
1.2. Matrix
1.3. Reservoir
1.4. Layer Drug-In-Adhesive
2. Global CBD Patch Market Analysis and Forecast, By Species
2.1. Segment Overview
2.2. Sativa
2.3. Cannabis Indica
2.4. Hybrid
3. Global CBD Patch Market Analysis and Forecast, By Derivatives
3.1. Segment Overview
3.2. Tetrahydrocannabinol (THC)
3.3. Cannabidiol (CBD)
3.4. Others
4. Global CBD Patch Market Analysis and Forecast, By Source Type
4.1. Segment Overview
4.2. Synthetic
4.3. Natural
5. Global CBD Patch Market Analysis and Forecast, By Application
5.1. Segment Overview
5.2. Elevate Mood
5.3. Chronic Pain
5.4. Neurological Pain
5.5. Arthritis
5.6. Anxiety
5.7. Others
6. Global CBD Patch Market Analysis and Forecast, By Distribution Channel
6.1. Segment Overview
6.2. Online
6.3. Dispensaries & Pharmacies
6.4. Conventional Stores
7. Global CBD Patch Market Analysis and Forecast, By End-User
7.1. Segment Overview
7.2. Rehab Centers
7.3. Clinics
7.4. Homecare Settings
7.5. Hospitals
7.6. Research & Development Centers
7.7. Others
8. Global CBD Patch Market Analysis and Forecast, By Regional Analysis
8.1. Segment Overview
8.2. North America
8.2.1. U.S.
8.2.2. Canada
8.2.3. Mexico
8.3. Europe
8.3.1. Germany
8.3.2. France
8.3.3. U.K.
8.3.4. Italy
8.3.5. Spain
8.4. Asia-Pacific
8.4.1. Japan
8.4.2. China
8.4.3. India
8.5. South America
8.5.1. Brazil
8.6. Middle East and Africa
8.6.1. UAE
8.6.2. South Africa
9. Global CBD Patch Market-Competitive Landscape
9.1. Overview
9.2. Market Share of Key Players in Global CBD Patch Market
9.2.1. Global Company Market Share
9.2.2. North America Company Market Share
9.2.3. Europe Company Market Share
9.2.4. APAC Company Market Share
9.3. Competitive Situations and Trends
9.3.1. Product Launches and Developments
9.3.2. Partnerships, Collaborations, and Agreements
9.3.3. Mergers & Acquisitions
9.3.4. Expansions
10. Company Profiles
10.1. Always pure organics
10.1.1. Business Overview
10.1.2. Company Snapshot
10.1.3. Company Market Share Analysis
10.1.4. Company Product Portfolio
10.1.5. Recent Developments
10.1.6. SWOT Analysis
10.2. NENO'S Naturals
10.2.1. Business Overview
10.2.2. Company Snapshot
10.2.3. Company Market Share Analysis
10.2.4. Company Product Portfolio
10.2.5. Recent Developments
10.2.6. SWOT Analysis
10.3. CBD British Cannabis
10.3.1. Business Overview
10.3.2. Company Snapshot
10.3.3. Company Market Share Analysis
10.3.4. Company Product Portfolio
10.3.5. Recent Developments
10.3.6. SWOT Analysis
10.4. Pure Ratio Wellness
10.4.1. Business Overview
10.4.2. Company Snapshot
10.4.3. Company Market Share Analysis
10.4.4. Company Product Portfolio
10.4.5. Recent Developments
10.4.6. SWOT Analysis
10.5. Atlas Thrive
10.5.1. Business Overview
10.5.2. Company Snapshot
10.5.3. Company Market Share Analysis
10.5.4. Company Product Portfolio
10.5.5. Recent Developments
10.5.6. SWOT Analysis
10.6. Mary's Medicinals
10.6.1. Business Overview
10.6.2. Company Snapshot
10.6.3. Company Market Share Analysis
10.6.4. Company Product Portfolio
10.6.5. Recent Developments
10.6.6. SWOT Analysis
10.7. Pacific Roots
10.7.1. Business Overview
10.7.2. Company Snapshot
10.7.3. Company Market Share Analysis
10.7.4. Company Product Portfolio
10.7.5. Recent Developments
10.7.6. SWOT Analysis
10.8. Pure Kana
10.8.1. Business Overview
10.8.2. Company Snapshot
10.8.3. Company Market Share Analysis
10.8.4. Company Product Portfolio
10.8.5. Recent Developments
10.8.6. SWOT Analysis
10.9. Essentia Pura
10.9.1. Business Overview
10.9.2. Company Snapshot
10.9.3. Company Market Share Analysis
10.9.4. Company Product Portfolio
10.9.5. Recent Developments
10.9.6. SWOT Analysis
List of Table
1. Global CBD Patch Market, By Product, 2019-2030 (USD Million)
2. Global Matrix, CBD Patch Market, By Region, 2019-2030 (USD Million)
3. Global Reservoir, CBD Patch Market, By Region, 2019-2030 (USD Million)
4. Global Layer Drug-In-Adhesive, CBD Patch Market, By Region, 2019-2030 (USD Million)
5. Global CBD Patch Market, By Species, 2019-2030 (USD Million)
6. Global Sativa, CBD Patch Market, By Region, 2019-2030 (USD Million)
7. Global Cannabis Indica, CBD Patch Market, By Region, 2019-2030 (USD Million)
8. Global Hybrid, CBD Patch Market, By Region, 2019-2030 (USD Million)
9. Global CBD Patch Market, By Derivatives, 2019-2030 (USD Million)
10. Global Tetrahydrocannabinol (THC), CBD Patch Market, By Region, 2019-2030 (USD Million)
11. Global Cannabidiol (CBD), CBD Patch Market, By Region, 2019-2030 (USD Million)
12. Global Others, CBD Patch Market, By Region, 2019-2030 (USD Million)
13. Global CBD Patch Market, By Source Type, 2019-2030 (USD Million)
14. Global Synthetic, CBD Patch Market, By Region, 2019-2030 (USD Million)
15. Global Natural, CBD Patch Market, By Region, 2019-2030 (USD Million)
16. Global CBD Patch Market, By Application, 2019-2030 (USD Million)
17. Global Elevate Mood, CBD Patch Market, By Region, 2019-2030 (USD Million)
18. Global Chronic Pain, CBD Patch Market, By Region, 2019-2030 (USD Million)
19. Global Neurological Pain, CBD Patch Market, By Region, 2019-2030 (USD Million)
20. Global Arthritis, CBD Patch Market, By Region, 2019-2030 (USD Million)
21. Global Anxiety, CBD Patch Market, By Region, 2019-2030 (USD Million)
22. Global Others, CBD Patch Market, By Region, 2019-2030 (USD Million)
23. Global CBD Patch Market, By Distribution Channel, 2019-2030 (USD Million)
24. Global Online, CBD Patch Market, By Region, 2019-2030 (USD Million)
25. Global Dispensaries & Pharmacies, CBD Patch Market, By Region, 2019-2030 (USD Million)
26. Global Conventional Stores, CBD Patch Market, By Region, 2019-2030 (USD Million)
27. Global CBD Patch Market, By End-User, 2019-2030 (USD Million)
28. Global Rehab Centers, CBD Patch Market, By Region, 2019-2030 (USD Million)
29. Global Clinics, CBD Patch Market, By Region, 2019-2030 (USD Million)
30. Global Homecare Settings, CBD Patch Market, By Region, 2019-2030 (USD Million)
31. Global Hospitals, CBD Patch Market, By Region, 2019-2030 (USD Million)
32. Global Research & Development Centers, CBD Patch Market, By Region, 2019-2030 (USD Million)
33. Global Others, CBD Patch Market, By Region, 2019-2030 (USD Million)
34. North America CBD Patch Market, By Product, 2019-2030 (USD Million)
35. North America CBD Patch Market, By Species, 2019-2030 (USD Million)
36. North America CBD Patch Market, By Derivatives, 2019-2030 (USD Million)
37. North America CBD Patch Market, By Source Type, 2019-2030 (USD Million)
38. North America CBD Patch Market, By Application, 2019-2030 (USD Million)
39. North America CBD Patch Market, By Distribution Channel, 2019-2030 (USD Million)
40. North America CBD Patch Market, By End-User, 2019-2030 (USD Million)
41. U.S. CBD Patch Market, By Product, 2019-2030 (USD Million)
42. U.S. CBD Patch Market, By Species, 2019-2030 (USD Million)
43. U.S. CBD Patch Market, By Derivatives, 2019-2030 (USD Million)
44. U.S. CBD Patch Market, By Source Type, 2019-2030 (USD Million)
45. U.S. CBD Patch Market, By Application, 2019-2030 (USD Million)
46. U.S. CBD Patch Market, By Distribution Channel, 2019-2030 (USD Million)
47. U.S. CBD Patch Market, By End-User, 2019-2030 (USD Million)
48. Canada CBD Patch Market, By Product, 2019-2030 (USD Million)
49. Canada CBD Patch Market, By Species, 2019-2030 (USD Million)
50. Canada CBD Patch Market, By Derivatives, 2019-2030 (USD Million)
51. Canada CBD Patch Market, By Source Type, 2019-2030 (USD Million)
52. Canada CBD Patch Market, By Application, 2019-2030 (USD Million)
53. Canada CBD Patch Market, By Distribution Channel, 2019-2030 (USD Million)
54. Canada CBD Patch Market, By End-User, 2019-2030 (USD Million)
55. Mexico CBD Patch Market, By Product, 2019-2030 (USD Million)
56. Mexico CBD Patch Market, By Species, 2019-2030 (USD Million)
57. Mexico CBD Patch Market, By Derivatives, 2019-2030 (USD Million)
58. Mexico CBD Patch Market, By Source Type, 2019-2030 (USD Million)
59. Mexico CBD Patch Market, By Application, 2019-2030 (USD Million)
60. Mexico CBD Patch Market, By Distribution Channel, 2019-2030 (USD Million)
61. Mexico CBD Patch Market, By End-User, 2019-2030 (USD Million)
62. Europe CBD Patch Market, By Product, 2019-2030 (USD Million)
63. Europe CBD Patch Market, By Species, 2019-2030 (USD Million)
64. Europe CBD Patch Market, By Derivatives, 2019-2030 (USD Million)
65. Europe CBD Patch Market, By Source Type, 2019-2030 (USD Million)
66. Europe CBD Patch Market, By Application, 2019-2030 (USD Million)
67. Europe CBD Patch Market, By Distribution Channel, 2019-2030 (USD Million)
68. Europe CBD Patch Market, By End-User, 2019-2030 (USD Million)
69. Germany CBD Patch Market, By Product, 2019-2030 (USD Million)
70. Germany CBD Patch Market, By Species, 2019-2030 (USD Million)
71. Germany CBD Patch Market, By Derivatives, 2019-2030 (USD Million)
72. Germany CBD Patch Market, By Source Type, 2019-2030 (USD Million)
73. Germany CBD Patch Market, By Application, 2019-2030 (USD Million)
74. Germany CBD Patch Market, By Distribution Channel, 2019-2030 (USD Million)
75. Germany CBD Patch Market, By End-User, 2019-2030 (USD Million)
76. France CBD Patch Market, By Product, 2019-2030 (USD Million)
77. France CBD Patch Market, By Species, 2019-2030 (USD Million)
78. France CBD Patch Market, By Derivatives, 2019-2030 (USD Million)
79. France CBD Patch Market, By Source Type, 2019-2030 (USD Million)
80. France CBD Patch Market, By Application, 2019-2030 (USD Million)
81. France CBD Patch Market, By Distribution Channel, 2019-2030 (USD Million)
82. France CBD Patch Market, By End-User, 2019-2030 (USD Million)
83. U.K. CBD Patch Market, By Product, 2019-2030 (USD Million)
84. U.K. CBD Patch Market, By Species, 2019-2030 (USD Million)
85. U.K. CBD Patch Market, By Derivatives, 2019-2030 (USD Million)
86. U.K. CBD Patch Market, By Source Type, 2019-2030 (USD Million)
87. U.K. CBD Patch Market, By Application, 2019-2030 (USD Million)
88. U.K. CBD Patch Market, By Distribution Channel, 2019-2030 (USD Million)
89. U.K. CBD Patch Market, By End-User, 2019-2030 (USD Million)
90. Italy CBD Patch Market, By Product, 2019-2030 (USD Million)
91. Italy CBD Patch Market, By Species, 2019-2030 (USD Million)
92. Italy CBD Patch Market, By Derivatives, 2019-2030 (USD Million)
93. Italy CBD Patch Market, By Source Type, 2019-2030 (USD Million)
94. Italy CBD Patch Market, By Application, 2019-2030 (USD Million)
95. Italy CBD Patch Market, By Distribution Channel, 2019-2030 (USD Million)
96. Italy CBD Patch Market, By End-User, 2019-2030 (USD Million)
97. Spain CBD Patch Market, By Product, 2019-2030 (USD Million)
98. Spain CBD Patch Market, By Species, 2019-2030 (USD Million)
99. Spain CBD Patch Market, By Derivatives, 2019-2030 (USD Million)
100. Spain CBD Patch Market, By Source Type, 2019-2030 (USD Million)
101. Spain CBD Patch Market, By Application, 2019-2030 (USD Million)
102. Spain CBD Patch Market, By Distribution Channel, 2019-2030 (USD Million)
103. Spain CBD Patch Market, By End-User, 2019-2030 (USD Million)
104. Asia Pacific CBD Patch Market, By Product, 2019-2030 (USD Million)
105. Asia Pacific CBD Patch Market, By Species, 2019-2030 (USD Million)
106. Asia Pacific CBD Patch Market, By Derivatives, 2019-2030 (USD Million)
107. Asia Pacific CBD Patch Market, By Source Type, 2019-2030 (USD Million)
108. Asia Pacific CBD Patch Market, By Application, 2019-2030 (USD Million)
109. Asia Pacific CBD Patch Market, By Distribution Channel, 2019-2030 (USD Million)
110. Asia Pacific CBD Patch Market, By End-User, 2019-2030 (USD Million)
111. Japan CBD Patch Market, By Product, 2019-2030 (USD Million)
112. Japan CBD Patch Market, By Species, 2019-2030 (USD Million)
113. Japan CBD Patch Market, By Derivatives, 2019-2030 (USD Million)
114. Japan CBD Patch Market, By Source Type, 2019-2030 (USD Million)
115. Japan CBD Patch Market, By Application, 2019-2030 (USD Million)
116. Japan CBD Patch Market, By Distribution Channel, 2019-2030 (USD Million)
117. Japan CBD Patch Market, By End-User, 2019-2030 (USD Million)
118. China CBD Patch Market, By Product, 2019-2030 (USD Million)
119. China CBD Patch Market, By Species, 2019-2030 (USD Million)
120. China CBD Patch Market, By Derivatives, 2019-2030 (USD Million)
121. China CBD Patch Market, By Source Type, 2019-2030 (USD Million)
122. China CBD Patch Market, By Application, 2019-2030 (USD Million)
123. China CBD Patch Market, By Distribution Channel, 2019-2030 (USD Million)
124. China CBD Patch Market, By End-User, 2019-2030 (USD Million)
125. India CBD Patch Market, By Product, 2019-2030 (USD Million)
126. India CBD Patch Market, By Species, 2019-2030 (USD Million)
127. India CBD Patch Market, By Derivatives, 2019-2030 (USD Million)
128. India CBD Patch Market, By Source Type, 2019-2030 (USD Million)
129. India CBD Patch Market, By Application, 2019-2030 (USD Million)
130. India CBD Patch Market, By Distribution Channel, 2019-2030 (USD Million)
131. India CBD Patch Market, By End-User, 2019-2030 (USD Million)
132. South America CBD Patch Market, By Product, 2019-2030 (USD Million)
133. South America CBD Patch Market, By Species, 2019-2030 (USD Million)
134. South America CBD Patch Market, By Derivatives, 2019-2030 (USD Million)
135. South America CBD Patch Market, By Source Type, 2019-2030 (USD Million)
136. South America CBD Patch Market, By Application, 2019-2030 (USD Million)
137. South America CBD Patch Market, By Distribution Channel, 2019-2030 (USD Million)
138. South America CBD Patch Market, By End-User, 2019-2030 (USD Million)
139. Brazil CBD Patch Market, By Product, 2019-2030 (USD Million)
140. Brazil CBD Patch Market, By Species, 2019-2030 (USD Million)
141. Brazil CBD Patch Market, By Derivatives, 2019-2030 (USD Million)
142. Brazil CBD Patch Market, By Source Type, 2019-2030 (USD Million)
143. Brazil CBD Patch Market, By Application, 2019-2030 (USD Million)
144. Brazil CBD Patch Market, By Distribution Channel, 2019-2030 (USD Million)
145. Brazil CBD Patch Market, By End-User, 2019-2030 (USD Million)
146. Middle East and Africa CBD Patch Market, By Product, 2019-2030 (USD Million)
147. Middle East and Africa CBD Patch Market, By Species, 2019-2030 (USD Million)
148. Middle East and Africa CBD Patch Market, By Derivatives, 2019-2030 (USD Million)
149. Middle East and Africa CBD Patch Market, By Source Type, 2019-2030 (USD Million)
150. Middle East and Africa CBD Patch Market, By Application, 2019-2030 (USD Million)
151. Middle East and Africa CBD Patch Market, By Distribution Channel, 2019-2030 (USD Million)
152. Middle East and Africa CBD Patch Market, By End-User, 2019-2030 (USD Million)
153. UAE CBD Patch Market, By Product, 2019-2030 (USD Million)
154. UAE CBD Patch Market, By Species, 2019-2030 (USD Million)
155. UAE CBD Patch Market, By Derivatives, 2019-2030 (USD Million)
156. UAE CBD Patch Market, By Source Type, 2019-2030 (USD Million)
157. UAE CBD Patch Market, By Application, 2019-2030 (USD Million)
158. UAE CBD Patch Market, By Distribution Channel, 2019-2030 (USD Million)
159. UAE CBD Patch Market, By End-User, 2019-2030 (USD Million)
160. South Africa CBD Patch Market, By Product, 2019-2030 (USD Million)
161. South Africa CBD Patch Market, By Species, 2019-2030 (USD Million)
162. South Africa CBD Patch Market, By Derivatives, 2019-2030 (USD Million)
163. South Africa CBD Patch Market, By Source Type, 2019-2030 (USD Million)
164. South Africa CBD Patch Market, By Application, 2019-2030 (USD Million)
165. South Africa CBD Patch Market, By Distribution Channel, 2019-2030 (USD Million)
166. South Africa CBD Patch Market, By End-User, 2019-2030 (USD Million)
List of Figures
1. Global CBD Patch Market Segmentation
2. Global CBD Patch Market: Research Methodology
3. Market Size Estimation Methodology: Bottom-Up Approach
4. Market Size Estimation Methodology: Top-Down Approach
5. Data Triangulation
6. Porter’s Five Forces Analysis
7. Value Chain Analysis
8. Global CBD Patch Market Attractiveness Analysis By Product
9. Global CBD Patch Market Attractiveness Analysis By Species
10. Global CBD Patch Market Attractiveness Analysis By Derivatives
11. Global CBD Patch Market Attractiveness Analysis By Source Type
12. Global CBD Patch Market Attractiveness Analysis By Application
13. Global CBD Patch Market Attractiveness Analysis By Distribution Channel
14. Global CBD Patch Market Attractiveness Analysis By End-User
15. Global CBD Patch Market Attractiveness Analysis By Region
16. Global CBD Patch Market: Dynamics
17. Global CBD Patch Market Share By Product (2022 & 2030)
18. Global CBD Patch Market Share By Species (2022 & 2030)
19. Global CBD Patch Market Share By Derivatives (2022 & 2030)
20. Global CBD Patch Market Share By Source Type (2022 & 2030)
21. Global CBD Patch Market Share By Application (2022 & 2030)
22. Global CBD Patch Market Share By Distribution Channel, (2022 & 2030)
23. Global CBD Patch Market Share By End-User (2022 & 2030)
24. Global CBD Patch Market Share By Regions (2022 & 2030)
25. Global CBD Patch Market Share By Company (2021)
This study forecasts revenue at global, regional, and country levels from 2019 to 2030. The Brainy Insights has segmented the global CBD patch based on below mentioned segments:
Global CBD Patch Market by Product:
Global CBD Patch Market by Species:
Global CBD Patch Market by Derivatives:
Global CBD Patch Market by Source Type:
Global CBD Patch Market by Application:
Global CBD Patch Market by Distribution Channel:
Global CBD Patch Market by End-User:
Global CBD Patch by Region:
Research has its special purpose to undertake marketing efficiently. In this competitive scenario, businesses need information across all industry verticals; the information about customer wants, market demand, competition, industry trends, distribution channels etc. This information needs to be updated regularly because businesses operate in a dynamic environment. Our organization, The Brainy Insights incorporates scientific and systematic research procedures in order to get proper market insights and industry analysis for overall business success. The analysis consists of studying the market from a miniscule level wherein we implement statistical tools which helps us in examining the data with accuracy and precision.
Our research reports feature both; quantitative and qualitative aspects for any market. Qualitative information for any market research process are fundamental because they reveal the customer needs and wants, usage and consumption for any product/service related to a specific industry. This in turn aids the marketers/investors in knowing certain perceptions of the customers. Qualitative research can enlighten about the different product concepts and designs along with unique service offering that in turn, helps define marketing problems and generate opportunities. On the other hand, quantitative research engages with the data collection process through interviews, e-mail interactions, surveys and pilot studies. Quantitative aspects for the market research are useful to validate the hypotheses generated during qualitative research method, explore empirical patterns in the data with the help of statistical tools, and finally make the market estimations.
The Brainy Insights offers comprehensive research and analysis, based on a wide assortment of factual insights gained through interviews with CXOs and global experts and secondary data from reliable sources. Our analysts and industry specialist assume vital roles in building up statistical tools and analysis models, which are used to analyse the data and arrive at accurate insights with exceedingly informative research discoveries. The data provided by our organization have proven precious to a diverse range of companies, facilitating them to address issues such as determining which products/services are the most appealing, whether or not customers use the product in the manner anticipated, the purchasing intentions of the market and many others.
Our research methodology encompasses an idyllic combination of primary and secondary initiatives. Key phases involved in this process are listed below:

The phase involves the gathering and collecting of market data and its related information with the help of different sources & research procedures.

The data procurement stage involves in data gathering and collecting through various data sources.
This stage involves in extensive research. These data sources includes:
Purchased Database: Purchased databases play a crucial role in estimating the market sizes irrespective of the domain. Our purchased database includes:
Primary Research: The Brainy Insights interacts with leading companies and experts of the concerned domain to develop the analyst team’s market understanding and expertise. It improves and substantiates every single data presented in the market reports. Primary research mainly involves in telephonic interviews, E-mail interactions and face-to-face interviews with the raw material providers, manufacturers/producers, distributors, & independent consultants. The interviews that we conduct provides valuable data on market size and industry growth trends prevailing in the market. Our organization also conducts surveys with the various industry experts in order to gain overall insights of the industry/market. For instance, in healthcare industry we conduct surveys with the pharmacists, doctors, surgeons and nurses in order to gain insights and key information of a medical product/device/equipment which the customers are going to usage. Surveys are conducted in the form of questionnaire designed by our own analyst team. Surveys plays an important role in primary research because surveys helps us to identify the key target audiences of the market. Additionally, surveys helps to identify the key target audience engaged with the market. Our survey team conducts the survey by targeting the key audience, thus gaining insights from them. Based on the perspectives of the customers, this information is utilized to formulate market strategies. Moreover, market surveys helps us to understand the current competitive situation of the industry. To be precise, our survey process typically involve with the 360 analysis of the market. This analytical process begins by identifying the prospective customers for a product or service related to the market/industry to obtain data on how a product/service could fit into customers’ lives.

Secondary Research: The secondary data sources includes information published by the on-profit organizations such as World bank, WHO, company fillings, investor presentations, annual reports, national government documents, statistical databases, blogs, articles, white papers and others. From the annual report, we analyse a company’s revenue to understand the key segment and market share of that organization in a particular region. We analyse the company websites and adopt the product mapping technique which is important for deriving the segment revenue. In the product mapping method, we select and categorize the products offered by the companies catering to domain specific market, deduce the product revenue for each of the companies so as to get overall estimation of the market size. We also source data and analyses trends based on information received from supply side and demand side intermediaries in the value chain. The supply side denotes the data gathered from supplier, distributor, wholesaler and the demand side illustrates the data gathered from the end customers for respective market domain.

The supply side for a domain specific market is analysed by:
The demand side for the market is estimated through:
In-house Library: Apart from these third-party sources, we have our in-house library of qualitative and quantitative information. Our in-house database includes market data for various industry and domains. These data are updated on regular basis as per the changing market scenario. Our library includes, historic databases, internal audit reports and archives.
Sometimes there are instances where there is no metadata or raw data available for any domain specific market. For those cases, we use our expertise to forecast and estimate the market size in order to generate comprehensive data sets. Our analyst team adopt a robust research technique in order to produce the estimates:
Data Synthesis: This stage involves the analysis & mapping of all the information obtained from the previous step. It also involves in scrutinizing the data for any discrepancy observed while data gathering related to the market. The data is collected with consideration to the heterogeneity of sources. Robust scientific techniques are in place for synthesizing disparate data sets and provide the essential contextual information that can orient market strategies. The Brainy Insights has extensive experience in data synthesis where the data passes through various stages:


Market Deduction & Formulation: The final stage comprises of assigning data points at appropriate market spaces so as to deduce feasible conclusions. Analyst perspective & subject matter expert based holistic form of market sizing coupled with industry analysis also plays a crucial role in this stage.
This stage involves in finalization of the market size and numbers that we have collected from data integration step. With data interpolation, it is made sure that there is no gap in the market data. Successful trend analysis is done by our analysts using extrapolation techniques, which provide the best possible forecasts for the market.
Data Validation & Market Feedback: Validation is the most important step in the process. Validation & re-validation via an intricately designed process helps us finalize data-points to be used for final calculations.

The Brainy Insights interacts with leading companies and experts of the concerned domain to develop the analyst team’s market understanding and expertise. It improves and substantiates every single data presented in the market reports. The data validation interview and discussion panels are typically composed of the most experienced industry members. The participants include, however, are not limited to:
Moreover, we always validate our data and findings through primary respondents from all the major regions we are working on.


Free Customization
Fortune 500 Clients
Free Yearly Update On Purchase Of Multi/Corporate License
Companies Served Till Date