- +1-315-215-1633
- sales@thebrainyinsights.com

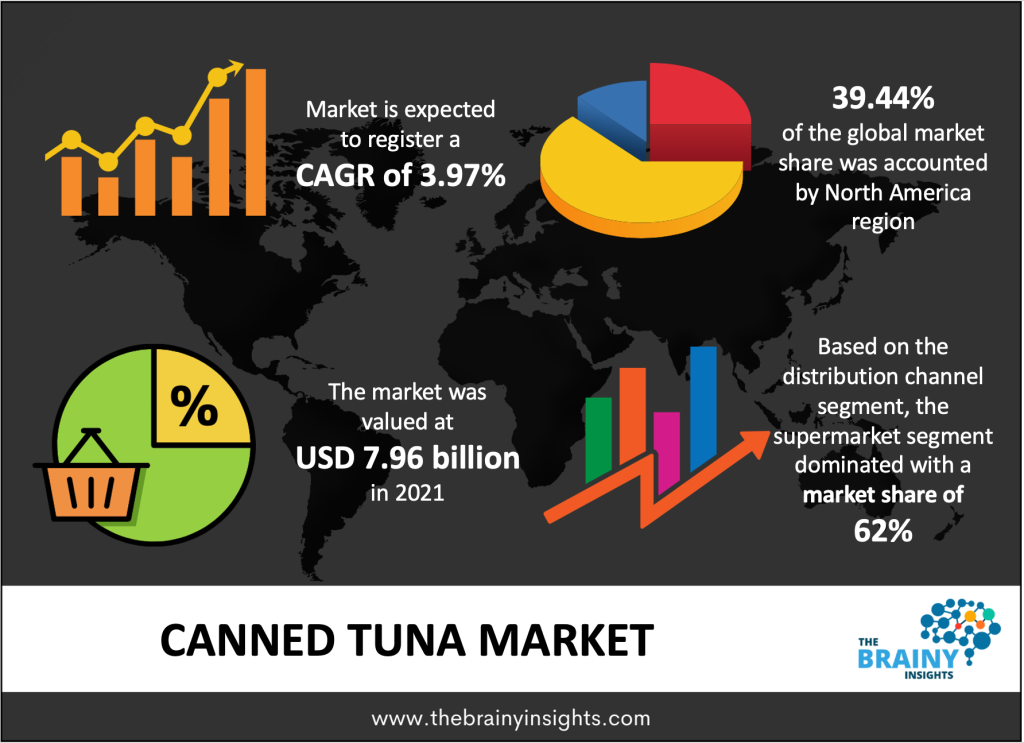
The global canned tuna market was valued at USD 7.96 billion in 2021and it is growing at a CAGR of 3.97% from 2022 to 2030. The global canned tuna market is expected to reach USD 11.30 billion by 2030. North America is expected to grow the fastest during the forecast period
Tuna fish is a saltwater fish, and it belongs to the Thunnini tribe. There are 15 species in this family of saltwater fishes, varying in size and color. Skipjack, mackerel, little tunny, albacore, bluefin, yellowfin, and bigeye are some examples of tuna fish. Tuna fishing is a commercially valuable business, given the abundant tuna stock in ocean bodies. Canned tuna processing involves multiple steps, from catching the fish to distributing them. The tuna is received from loading docks and freeze-stored. Then are thawed and sorted according to sizes. The tuna is then cooked to eliminate the excess oil, cleaned, and packed into tin containers. The tuna is covered in a liquid before it is packed into containers to retain its flavor and nutrition. The containers are sterilized and cooled before labeling and distributing to the market. Tuna is a staple diet for many households. It is a cheap source of protein and can last for years in the pantry. It contains several vitamins, minerals, and essential fatty acids that promote bone health and improve immunity. They promote growth in children and are good for cardiovascular health as well.
The canned tuna market would be driven by the increasing demand for seafood to replace meat as a source of protein. Tuna is among the most popular seafood, given its nutritional health benefits. Canned tuna is rich in protein, vitamins, minerals, omega-3, and other essential fatty acids. Furthermore, it is easy to cook or can be eaten directly. Given the increasing prevalence of consuming convenience foods given the busy lifestyle of the population, the ready-to-eat/cook nature of canned tuna will offer market expansion opportunities. The growing popularity of tuna sandwiches and salads as healthy meals in western nations will also contribute to the development of the market. The abundant tuna in the ocean makes the canned tuna industry a sustainable venture. The abundance of tuna combined with the increasing presence of processing units globally will reduce retail prices of canned tuna, thereby making them more affordable and expanding its consumer market.
Nostromo, an Italian brand of canned tuna fish owned by the Calvo Group, debuted a stylish new package with actual peel technology in January 2022. When prepared using this method, the final product, known as "Apri gira facile" tuna, has no inner rim and may be placed directly onto the dish without needing a fork, preventing food waste.
Get an overview of this study by requesting a free sample
Increasing demand for seafood - The rising awareness about climate change, environmental degradation & its severe consequences on humankind has created an urgency for adopting sustainable development models. Consumers are shifting towards seafood as the primary source of protein as it leaves fewer carbon footprints than meat. Tuna is highly nutritious. Tuna fishes have omega 3, essential fatty acids, vitamins, and minerals, which fulfill the human body’s nutritional requirements. Tuna is abundantly present in ocean bodies making their processing a sustainable practice. Seafood's strong flavor offers a distinct taste pallet for consumers to exploit. Tuna is amongst the most consumed seafood globally, given its nature as convenience food. It is available in ready-to-eat and ready-to-cook forms, making them highly popular amongst busy millennials worldwide. The increasing popularity of seafood from Japan, Korea, and Thailand in the western nations as fusion dishes is also driving the canned tuna market.
High mercury concentration in tuna - Canned tuna market growth would be hampered by the high mercury concentration in tuna. Mercury is a heavy metal that is highly toxic to human health. Increased levels of mercury in the body can cause fatigue and sometimes affect the central nervous system. The increasing water contamination due to anthropogenic activities has increased the mercury levels in water bodies. Furthermore, since tuna fishes eat smaller fishes that may already have elevated mercury levels, the canned tuna will also contain higher levels of mercury. The rising research and publications presenting the adverse effects of mercury from canned tuna will limit the market's growth.
The growing consumer demand for packaged foods - The busy and hectic schedules of the population have increased the popularity of ready-to-eat and ready-to-drink packaged products. Packaged foods are convenient, quick, affordable & accessible, making its increasing demand a positive development for the canned tuna market. However, even with hectic schedules, individuals today do not want to compromise on product quality and demand healthier products. Canned tuna is a rich source of protein, essential fatty acids, and numerous vitamins and minerals. It helps in enhancing bone health, reduces disease risk by improving immunity, and boosts metabolism to promote growth. The growing awareness about the benefits of canned tuna will positively contribute to the development of the market. The increased internet penetration and the e-commerce boom have further fueled the demand for canned tuna. The tech-savvy millennial population drives the demand for canned tuna on online platforms. The introduction of canned tuna on online platforms by major market players will also contribute to the development of the market.
The growing popularity of vegan culture - The rising awareness about the ill effects of eating animals. The increasing availability and accessibility of vegan food encourage more people to go vegan. Activism against animal cruelty and promoting plant-based nutritious meals by social media influencers contribute to the popularity of vegan culture among millennials and gen-Z. The rising ethical peer pressure of eating animals persuades non-vegetarians to go vegan. Going vegan helps save the environment by reducing the demand for meat products and seafood, which prevents overexploitation of natural resources and restores the balance. The ethical, environmental, and health benefits of going vegan are gaining prominence globally, thereby challenging the growth of the canned tuna market.
The regions analyzed for the market include North America, Europe, South America, Asia Pacific, the Middle East, and Africa. North America region emerged as the largest market for the global canned tuna market, with a 39.44% share of the market revenue in 2021.
North America dominates the canned tuna market due to the increasing demand for convenience foods. With their busy lifestyles, the significant millennial and gen-Z population demand ready-to-eat/cook foods. However, given the rising disposable income and awareness about having a healthy lifestyle, the increasing demand for ready-to-eat/cook food is primarily concentrated on only healthy and nutritious products. The significant presence of the migrant population of Japan, China, Korea, and Thailand has also increased the popularity of traditional seafood in these countries. Hybrid or fusion recipes, namely, tuna salads or tuna sandwiches, have developed as the region's go-to healthy and nutritious meals. The long coastline with abundant tuna stock in the Atlantic and Pacific oceans also contributes to the development of the market. Europe is expected to be the second largest market for the global tuna market. Tuna is amongst the most consumed seafood in the European market. The presence of significant processing units and robust supply chains are attributed to the development of the European canned tuna market. The absence of rigid borders in the trading block of the European Union has contributed to the flourishing canned tuna market. Market players in the European region offer multiple varieties of canned with distinct flavors, which blend the local tastes and preferences, further propelling the market's growth.
North America Region Canned Tuna Market Share in 2021 - 39.44%
www.thebrainyinsights.com
Check the geographical analysis of this market by requesting a free sample
The product type segment is divided into skipjack, yellowfin, bigeye, albacore, bluefin, and others. In 2021, the skipjack tuna segment dominated the market, accounting for around 54% of the global market share. Skipjack tuna is a canned light tuna. Light canned tuna has a softer texture giving it a rich flavor. Skipjack tuna is the smallest tuna, and it is abundantly found in marine bodies. The abundance of skipjack tuna makes its processing commercially viable, which is why it is preferred by tuna manufacturers globally. The large stock of skipjack tuna in oceans makes commercial processing of tuna a sustainable endeavor. The abundance of skipjack also benefits the customers by making it cheaper than other varieties of albacore or bluefin tuna. A very distinct and strong flavor of skipjack tuna makes it popular among consumers. Skipjack tuna is a good source of protein, minerals, essential fatty acids, and vitamins A, E, and D. it is also a rich source of omega 3, which helps in maintaining cardiovascular health. It also has small amounts of potassium, manganese, and vitamins B1 and B6, which are good for mental health. Given the numerous health benefits of skipjack tuna, it is gaining prominence in the canned tuna market, thereby contributing to its growing dominance.
The distribution channel segment is divided into supermarkets/hypermarkets, business-to-business, convenience stores, specialty stores, online, and others. In 2021, the supermarkets/hypermarkets segment dominated, accounting for around 62% of the global market share. The increasing presence of retail market chains like Walmart, Target, D-mart, big bazaar, and other national retailers has contributed to their growing accessibility globally. Supermarkets/hypermarkets have dedicated lanes and aisles for different products, which offer various brands to choose from. The presence of all brands and their respective products in one place enhances the shopping experience for consumers. Rapid urbanization and increasing disposable income contribute to the growing popularity of supermarkets/hypermarkets. Furthermore, given the extensive retail network of these supermarkets/hypermarkets, canned tuna manufacturers take them onboard as their primary distributors to reach more customers. Multiple year-round offers, discounts, sales, and other rewards also drive the growth of the segment in the global canned tuna market.
| Attribute | Description |
|---|---|
| Market Size | Revenue (USD Billion), Sales Volume (Kgs) |
| Market size value in 2021 | USD 7.96 Billion |
| Market size value in 2030 | USD 11.30 Billion |
| CAGR (2022 to 2030) | 3.97% |
| Historical data | 2019-2020 |
| Base Year | 2021 |
| Forecast | 2022 to 2030 |
| Segments | Product type and Distribution Channel |
| Regional Segments | The regions segmented into South America Europe, Asia Pacific, North America, and Middle East and Africa. |
As per The Brainy Insights, the size of the canned tuna market was valued at USD 7.96 billion in 2021 to USD 11.30 billion by 2030.
Global canned tuna market is growing at a CAGR of 3.97% during the forecast period 2022-2030.
The market's growth will be influenced by the increasing demand for seafood.
High concentration of mercury in tuna could hamper the market growth.
The growing consumer demand for packaged foods will provide huge opportunities to the market.
Key players are American Tuna Inc., Bumble Bee Foods LLC, Century Pacific Food Inc., Frinsa del Noroeste SA, Grupo Calvo, Jealsa, Oceans Brands GP, StarKist Co., Thai Union Group PCL, and Wild Planet Foods Inc.
1. Introduction
1.1. Objectives of the Study
1.2. Market Definition
1.3. Research Scope
1.4. Currency
1.5. Key Target Audience
2. Research Methodology and Assumptions
3. Executive Summary
4. Premium Insights
4.1. Porter’s Five Forces Analysis
4.2. Value Chain Analysis
4.3. Top Investment Pockets
4.3.1. Market Attractiveness Analysis By Product Type
4.3.2. Market Attractiveness Analysis By Distribution Channel
4.3.3. Market Attractiveness Analysis By Region
4.4. Industry Trends
5. Market Dynamics
5.1. Market Evaluation
5.2. Drivers
5.2.1. Increasing demand for seafood
5.3. Restraints
5.3.1. High concentration of mercury in tuna
5.4. Opportunities
5.4.1. The growing consumer demand for packaged foods
5.5. Challenges
5.5.1. Growing popularity of vegan culture
6. Global Canned Tuna Market Analysis and Forecast, By Product Type
6.1. Segment Overview
6.2. Skipjack
6.3. Yellowfin
6.4. Bigeye
6.5. Albacore
6.6. Bluefin
6.7. Others
7. Global Canned Tuna Market Analysis and Forecast, By Distribution Channel
7.1. Segment Overview
7.2. Supermarkets/Hypermarkets
7.3. Business-To-Business
7.4. Convenience Stores
7.5. Specialty Stores
7.6. Online
7.7. Others
8. Global Canned Tuna Market Analysis and Forecast, By Regional Analysis
8.1. Segment Overview
8.2. North America
8.2.1. U.S.
8.2.2. Canada
8.2.3. Mexico
8.3. Europe
8.3.1. Germany
8.3.2. France
8.3.3. U.K.
8.3.4. Italy
8.3.5. Spain
8.4. Asia-Pacific
8.4.1. Japan
8.4.2. China
8.4.3. India
8.5. South America
8.5.1. Brazil
8.6. Middle East and Africa
8.6.1. UAE
8.6.2. South Africa
9. Global Canned Tuna Market-Competitive Landscape
9.1. Overview
9.2. Market Share of Key Players in the Canned Tuna Market
9.2.1. Global Company Market Share
9.2.2. North America Company Market Share
9.2.3. Europe Company Market Share
9.2.4. APAC Company Market Share
9.3. Competitive Situations and Trends
9.3.1. Product Launches and Developments
9.3.2. Partnerships, Collaborations, and Agreements
9.3.3. Mergers & Acquisitions
9.3.4. Expansions
10. Company Profiles
10.1. American Tuna Inc.
10.1.1. Business Overview
10.1.2. Company Snapshot
10.1.3. Company Market Share Analysis
10.1.4. Company Product Portfolio
10.1.5. Recent Developments
10.1.6. SWOT Analysis
10.2. Bumble Bee Foods LLC
10.2.1. Business Overview
10.2.2. Company Snapshot
10.2.3. Company Market Share Analysis
10.2.4. Company Product Portfolio
10.2.5. Recent Developments
10.2.6. SWOT Analysis
10.3. Century Pacific Food Inc.
10.3.1. Business Overview
10.3.2. Company Snapshot
10.3.3. Company Market Share Analysis
10.3.4. Company Product Portfolio
10.3.5. Recent Developments
10.3.6. SWOT Analysis
10.4. Frinsa del Noroeste SA
10.4.1. Business Overview
10.4.2. Company Snapshot
10.4.3. Company Market Share Analysis
10.4.4. Company Product Portfolio
10.4.5. Recent Developments
10.4.6. SWOT Analysis
10.5. Grupo Calvo
10.5.1. Business Overview
10.5.2. Company Snapshot
10.5.3. Company Market Share Analysis
10.5.4. Company Product Portfolio
10.5.5. Recent Developments
10.5.6. SWOT Analysis
10.6. Jealsa
10.6.1. Business Overview
10.6.2. Company Snapshot
10.6.3. Company Market Share Analysis
10.6.4. Company Product Portfolio
10.6.5. Recent Developments
10.6.6. SWOT Analysis
10.7. Oceans Brands GP
10.7.1. Business Overview
10.7.2. Company Snapshot
10.7.3. Company Market Share Analysis
10.7.4. Company Product Portfolio
10.7.5. Recent Developments
10.7.6. SWOT Analysis
10.8. StarKist Co.
10.8.1. Business Overview
10.8.2. Company Snapshot
10.8.3. Company Market Share Analysis
10.8.4. Company Product Portfolio
10.8.5. Recent Developments
10.8.6. SWOT Analysis
10.9. Thai Union Group PCL
10.9.1. Business Overview
10.9.2. Company Snapshot
10.9.3. Company Market Share Analysis
10.9.4. Company Product Portfolio
10.9.5. Recent Developments
10.9.6. SWOT Analysis
10.10. Wild Planet Foods Inc.
10.10.1. Business Overview
10.10.2. Company Snapshot
10.10.3. Company Market Share Analysis
10.10.4. Company Component Portfolio
10.10.5. Recent Developments
10.10.6. SWOT Analysis
List of Table
1. Global Canned Tuna Market, By Product Type, 2019-2030 (USD Billion)
2. Global Skipjack Canned Tuna Market, By Region, 2019-2030 (USD Billion)
3. Global Yellowfin Canned Tuna Market, By Region, 2019-2030 (USD Billion)
4. Global Bigeye Canned Tuna Market, By Region, 2019-2030 (USD Billion)
5. Global Albacore Canned Tuna Market, By Region, 2019-2030 (USD Billion)
6. Global Bluefin Canned Tuna Market, By Region, 2019-2030 (USD Billion)
7. Global Others Canned Tuna Market, By Region, 2019-2030 (USD Billion)
8. Global Canned Tuna Market, By Distribution Channel, 2019-2030 (USD Billion)
9. Global Supermarkets/Hypermarkets Canned Tuna Market, By Region, 2019-2030 (USD Billion)
10. Global Business-To-Business Canned Tuna Market, By Region, 2019-2030 (USD Billion)
11. Global Convenience Stores Canned Tuna Market, By Region, 2019-2030 (USD Billion)
12. Global Specialty Stores Canned Tuna Market, By Region, 2019-2030 (USD Billion)
13. Global Online Canned Tuna Market, By Region, 2019-2030 (USD Billion)
14. Global Others Canned Tuna Market, By Region, 2019-2030 (USD Billion)
15. Global Canned Tuna Market, By Region, 2019-2030 (USD Billion)
16. North America Canned Tuna Market, By Product Type, 2019-2030 (USD Billion)
17. North America Canned Tuna Market, By Distribution Channel, 2019-2030 (USD Billion)
18. U.S. Canned Tuna Market, By Product Type, 2019-2030 (USD Billion)
19. U.S. Canned Tuna Market, By Distribution Channel, 2019-2030 (USD Billion)
20. Canada Canned Tuna Market, By Product Type, 2019-2030 (USD Billion)
21. Canada Canned Tuna Market, By Distribution Channel, 2019-2030 (USD Billion)
22. Mexico Canned Tuna Market, By Product Type, 2019-2030 (USD Billion)
23. Mexico Canned Tuna Market, By Distribution Channel, 2019-2030 (USD Billion)
24. Europe Canned Tuna Market, By Product Type, 2019-2030 (USD Billion)
25. Europe Canned Tuna Market, By Distribution Channel, 2019-2030 (USD Billion)
26. Germany Canned Tuna Market, By Product Type, 2019-2030 (USD Billion)
27. Germany Canned Tuna Market, By Distribution Channel, 2019-2030 (USD Billion)
28. France Canned Tuna Market, By Product Type, 2019-2030 (USD Billion)
29. France Canned Tuna Market, By Distribution Channel, 2019-2030 (USD Billion)
30. U.K. Canned Tuna Market, By Product Type, 2019-2030 (USD Billion)
31. U.K. Canned Tuna Market, By Distribution Channel, 2019-2030 (USD Billion)
32. Italy Canned Tuna Market, By Product Type, 2019-2030 (USD Billion)
33. Italy Canned Tuna Market, By Distribution Channel, 2019-2030 (USD Billion)
34. Spain Canned Tuna Market, By Product Type, 2019-2030 (USD Billion)
35. Spain Canned Tuna Market, By Distribution Channel, 2019-2030 (USD Billion)
36. Asia Pacific Canned Tuna Market, By Product Type, 2019-2030 (USD Billion)
37. Asia Pacific Canned Tuna Market, By Distribution Channel, 2019-2030 (USD Billion)
38. Japan Canned Tuna Market, By Product Type, 2019-2030 (USD Billion)
39. Japan Canned Tuna Market, By Distribution Channel, 2019-2030 (USD Billion)
40. China Canned Tuna Market, By Product Type, 2019-2030 (USD Billion)
41. China Canned Tuna Market, By Distribution Channel, 2019-2030 (USD Billion)
42. India Canned Tuna Market, By Product Type, 2019-2030 (USD Billion)
43. India Canned Tuna Market, By Distribution Channel, 2019-2030 (USD Billion)
44. South America Canned Tuna Market, By Product Type, 2019-2030 (USD Billion)
45. South America Canned Tuna Market, By Distribution Channel, 2019-2030 (USD Billion)
46. Brazil Canned Tuna Market, By Product Type, 2019-2030 (USD Billion)
47. Brazil Canned Tuna Market, By Distribution Channel, 2019-2030 (USD Billion)
48. Middle East and Africa Canned Tuna Market, By Product Type, 2019-2030 (USD Billion)
49. Middle East and Africa Canned Tuna Market, By Distribution Channel, 2019-2030 (USD Billion)
50. UAE Canned Tuna Market, By Product Type, 2019-2030 (USD Billion)
51. UAE Canned Tuna Market, By Distribution Channel, 2019-2030 (USD Billion)
52. South Africa Canned Tuna Market, By Product Type, 2019-2030 (USD Billion)
53. South Africa Canned Tuna Market, By Distribution Channel, 2019-2030 (USD Billion)
List of Figures
1. Global Canned Tuna Market Segmentation
2. Canned Tuna Market: Research Methodology
3. Market Size Estimation Methodology: Bottom-Up Approach
4. Market Size Estimation Methodology: Top-Down Approach
5. Data Triangulation
6. Porter’s Five Forces Analysis
7. Value Chain Analysis
8. Global Canned Tuna Market Attractiveness Analysis By Product Type
9. Global Canned Tuna Market Attractiveness Analysis By Distribution Channel
10. Global Canned Tuna Market Attractiveness Analysis By Region
11. Global Canned Tuna Market: Dynamics
12. Global Canned Tuna Market Share by Product Type (2022 & 2030)
13. Global Canned Tuna Market Share by Distribution Channel (2022 & 2030)
14. Global Canned Tuna Market Share by Regions (2022 & 2030)
15. Global Canned Tuna Market Share by Company (2021)
This study forecasts revenue at global, regional, and country levels from 2019 to 2030. The Brainy Insights has segmented the global canned tuna market based on below mentioned segments:
Global Canned Tuna Market by Product Type:
Global Canned Tuna Market by Distribution Channel:
Global Canned Tuna Market by Region:
Research has its special purpose to undertake marketing efficiently. In this competitive scenario, businesses need information across all industry verticals; the information about customer wants, market demand, competition, industry trends, distribution channels etc. This information needs to be updated regularly because businesses operate in a dynamic environment. Our organization, The Brainy Insights incorporates scientific and systematic research procedures in order to get proper market insights and industry analysis for overall business success. The analysis consists of studying the market from a miniscule level wherein we implement statistical tools which helps us in examining the data with accuracy and precision.
Our research reports feature both; quantitative and qualitative aspects for any market. Qualitative information for any market research process are fundamental because they reveal the customer needs and wants, usage and consumption for any product/service related to a specific industry. This in turn aids the marketers/investors in knowing certain perceptions of the customers. Qualitative research can enlighten about the different product concepts and designs along with unique service offering that in turn, helps define marketing problems and generate opportunities. On the other hand, quantitative research engages with the data collection process through interviews, e-mail interactions, surveys and pilot studies. Quantitative aspects for the market research are useful to validate the hypotheses generated during qualitative research method, explore empirical patterns in the data with the help of statistical tools, and finally make the market estimations.
The Brainy Insights offers comprehensive research and analysis, based on a wide assortment of factual insights gained through interviews with CXOs and global experts and secondary data from reliable sources. Our analysts and industry specialist assume vital roles in building up statistical tools and analysis models, which are used to analyse the data and arrive at accurate insights with exceedingly informative research discoveries. The data provided by our organization have proven precious to a diverse range of companies, facilitating them to address issues such as determining which products/services are the most appealing, whether or not customers use the product in the manner anticipated, the purchasing intentions of the market and many others.
Our research methodology encompasses an idyllic combination of primary and secondary initiatives. Key phases involved in this process are listed below:

The phase involves the gathering and collecting of market data and its related information with the help of different sources & research procedures.

The data procurement stage involves in data gathering and collecting through various data sources.
This stage involves in extensive research. These data sources includes:
Purchased Database: Purchased databases play a crucial role in estimating the market sizes irrespective of the domain. Our purchased database includes:
Primary Research: The Brainy Insights interacts with leading companies and experts of the concerned domain to develop the analyst team’s market understanding and expertise. It improves and substantiates every single data presented in the market reports. Primary research mainly involves in telephonic interviews, E-mail interactions and face-to-face interviews with the raw material providers, manufacturers/producers, distributors, & independent consultants. The interviews that we conduct provides valuable data on market size and industry growth trends prevailing in the market. Our organization also conducts surveys with the various industry experts in order to gain overall insights of the industry/market. For instance, in healthcare industry we conduct surveys with the pharmacists, doctors, surgeons and nurses in order to gain insights and key information of a medical product/device/equipment which the customers are going to usage. Surveys are conducted in the form of questionnaire designed by our own analyst team. Surveys plays an important role in primary research because surveys helps us to identify the key target audiences of the market. Additionally, surveys helps to identify the key target audience engaged with the market. Our survey team conducts the survey by targeting the key audience, thus gaining insights from them. Based on the perspectives of the customers, this information is utilized to formulate market strategies. Moreover, market surveys helps us to understand the current competitive situation of the industry. To be precise, our survey process typically involve with the 360 analysis of the market. This analytical process begins by identifying the prospective customers for a product or service related to the market/industry to obtain data on how a product/service could fit into customers’ lives.

Secondary Research: The secondary data sources includes information published by the on-profit organizations such as World bank, WHO, company fillings, investor presentations, annual reports, national government documents, statistical databases, blogs, articles, white papers and others. From the annual report, we analyse a company’s revenue to understand the key segment and market share of that organization in a particular region. We analyse the company websites and adopt the product mapping technique which is important for deriving the segment revenue. In the product mapping method, we select and categorize the products offered by the companies catering to domain specific market, deduce the product revenue for each of the companies so as to get overall estimation of the market size. We also source data and analyses trends based on information received from supply side and demand side intermediaries in the value chain. The supply side denotes the data gathered from supplier, distributor, wholesaler and the demand side illustrates the data gathered from the end customers for respective market domain.

The supply side for a domain specific market is analysed by:
The demand side for the market is estimated through:
In-house Library: Apart from these third-party sources, we have our in-house library of qualitative and quantitative information. Our in-house database includes market data for various industry and domains. These data are updated on regular basis as per the changing market scenario. Our library includes, historic databases, internal audit reports and archives.
Sometimes there are instances where there is no metadata or raw data available for any domain specific market. For those cases, we use our expertise to forecast and estimate the market size in order to generate comprehensive data sets. Our analyst team adopt a robust research technique in order to produce the estimates:
Data Synthesis: This stage involves the analysis & mapping of all the information obtained from the previous step. It also involves in scrutinizing the data for any discrepancy observed while data gathering related to the market. The data is collected with consideration to the heterogeneity of sources. Robust scientific techniques are in place for synthesizing disparate data sets and provide the essential contextual information that can orient market strategies. The Brainy Insights has extensive experience in data synthesis where the data passes through various stages:


Market Deduction & Formulation: The final stage comprises of assigning data points at appropriate market spaces so as to deduce feasible conclusions. Analyst perspective & subject matter expert based holistic form of market sizing coupled with industry analysis also plays a crucial role in this stage.
This stage involves in finalization of the market size and numbers that we have collected from data integration step. With data interpolation, it is made sure that there is no gap in the market data. Successful trend analysis is done by our analysts using extrapolation techniques, which provide the best possible forecasts for the market.
Data Validation & Market Feedback: Validation is the most important step in the process. Validation & re-validation via an intricately designed process helps us finalize data-points to be used for final calculations.

The Brainy Insights interacts with leading companies and experts of the concerned domain to develop the analyst team’s market understanding and expertise. It improves and substantiates every single data presented in the market reports. The data validation interview and discussion panels are typically composed of the most experienced industry members. The participants include, however, are not limited to:
Moreover, we always validate our data and findings through primary respondents from all the major regions we are working on.


Free Customization
Fortune 500 Clients
Free Yearly Update On Purchase Of Multi/Corporate License
Companies Served Till Date