- +1-315-215-1633
- sales@thebrainyinsights.com

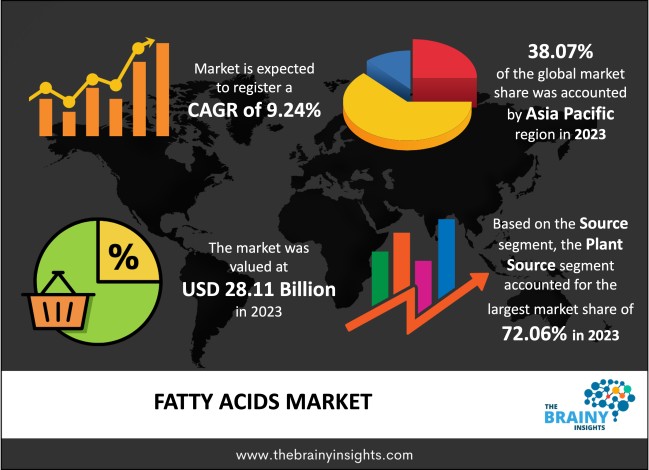
The global fatty acids market was valued at USD 28.11 Billion in 2023 and grew at a CAGR of 9.24% from 2024 to 2033. The market is expected to reach USD 68.02 Billion by 2033. The growth of the fatty acids market can be attributed to the rising usage in cosmetics, nutraceuticals, pharmaceuticals, food and beverages, and animal feeds.
The body's stored fat, and the fat found in food are composed of fatty acids. Fatty acids, taken into the bloodstream, are produced by the body during digestion. The body uses fatty acids for various vital processes, including energy storage. Furthermore, it is the primary dietary source of dairy, vegetables, grains, and fish oils. Fatty acids are mostly used in pharmaceuticals to manufacture drug carriers and in therapeutic nutrition. Furthermore, fatty acids are frequently employed as inert components in the manufacturing of pharmaceuticals, and their employment as carriers of active compounds is growing. Moreover, fatty acids are a component of complex lipids and are thus widely utilized in liposomes and soaps, among other cosmetic products. Fatty acids power the muscles, heart, and other organs and are considered the energy reserves for the body,
Get an overview of this study by requesting a free sample
Increasing use in pharmaceutical products: The fatty acids market is driven by increased applications in the pharmaceutical industry. The demand for natural and organic products is rising, which has increased the market share of fatty acids. Fatty acids are used more frequently in various applications, including prescription medications, consumer health, vitamins, and mineral supplements. Polyunsaturated fatty acids are used profoundly in the healthcare sector due to their numerous health advantages. They may be used to treat cardiovascular disease, blood pressure, and kidney and lung disorders. Furthermore, there has been a greater emphasis on preventative health measures in recent years due to the rising prevalence of chronic diseases. As a result, the market is expanding due to growing consumer knowledge of the advantages of consuming fatty acids and rising demand.
Adverse effects: Throughout the projected period, several prevalent health conditions and unfavourable effects of excessive fatty acid consumption are expected to impede market expansion. Due to their association with elevated cholesterol levels and an increased risk of heart disease, saturated fatty acids are frequently associated with adverse health effects.
Increasing growth of the nutraceutical industry: The nutraceutical business is expected to continue to develop, providing new chances for creative products based on customer interest in foods that enhance health as health awareness and lifestyle modifications spread worldwide. A paradigm shift is occurring in the global healthcare sector, with a greater emphasis now placed on preventive interventions instead of reactive therapies. Nutraceuticals are a significant fit for this preventative healthcare paradigm because of their innate ability to promote health. Nutraceuticals are expected to be in high demand as more people actively preserve their health.
The regions analyzed for the market include North America, Europe, South America, Asia Pacific, the Middle East, and Africa. Asia-Pacific emerged as the most significant fatty acids market, with a 38.07% market revenue share in 2023.
Asia-Pacific region will account for the largest market share with revenue growth. The region has a high demand for fatty acids in food and beverages, pharmaceutical and nutraceuticals, cosmetics, etc. The growing awareness among regional customers regarding their health provides lucrative opportunities to the market, especially in the pharmaceutical and nutraceutical industries.
Asia-Pacific region Fatty Acids Market Share in 2023 - 38.07%
www.thebrainyinsights.com
Check the geographical analysis of this market by requesting a free sample
The form segment is divided into powder, oil, and capsule. The capsule segment dominated the market, with a share of around 47.90% in 2023. The degree of saturation of fatty acids in edible fats and oils determines their classification. It is mostly extracted in oil form from the sources. The oil forms of fatty acids are used in many industries, such as pharmaceuticals, food and beverages and cosmetics.
The type segment is divided into saturated and unsaturated. The unsaturated segment dominated the market, with a share of around 73.61% in 2023. In contrast to saturated fatty acids, which lack double bonds, unsaturated fatty acid carbon chains have one or more double bonds together with a terminal carboxylic group. The quantity of double bonds in these fatty acids determines their category.
The source segment is divided into plant source and animal source. The plant source segment dominated the market, with a share of around 72.06% in 2023. Diets high in plant-based nutrients are good for the brain and may help prevent dementias such as Alzheimer's. Many plant-based diets have easy access to omega-3 fatty acids. The increasing global trend of being vegan and the rising consumption of vegetarian food are the primary causes of this segment's rise.
The application segment is divided into food and beverages, personal care and cosmetics, animal feed, pharmaceutical and nutraceutical, industrial and others. The food and beverages segment dominated the market, with a share of around 34.29% in 2023. Fish and other seafood include DHA and EPA. ALA is an essential fatty acid that the body cannot produce on its own, and the consumer must obtain it from foods and beverages. Many food products contain fatty acids, such as fish, olive oil, chia seeds, flaxseeds, walnuts, etc.
| Attribute | Description |
|---|---|
| Market Size | Revenue (USD Billion) |
| Market size value in 2023 | USD 28.11 Billion |
| Market size value in 2033 | USD 68.02 Billion |
| CAGR (2024 to 2033) | 9.24% |
| Historical data | 2020-2022 |
| Base Year | 2023 |
| Forecast | 2024-2033 |
| Region | The regions analyzed for the market are Asia Pacific, Europe, South America, North America, and Middle East & Africa. Furthermore, the regions are further analyzed at the country level. |
| Segments | Form, Type, Source and Application |
As per The Brainy Insights, the size of the fatty acids market was valued 28.11 Billion in 2023 to USD 68.02 Billion by 2033.
Global fatty acids market is growing at a CAGR of 9.24% during the forecast period 2024-2033.
Asia Pacific region emerged as the largest market for the fatty acids.
The market's growth will be influenced by the growing usage of fatty acids in different applications.
The adverse health effects can hamper the market growth.
The increasing growth of nutraceuticals industry is providing huge opportunities to the market.
1. Introduction
1.1. Objectives of the Study
1.2. Market Definition
1.3. Research Scope
1.4. Currency
1.5. Key Target Audience
2. Research Methodology and Assumptions
3. Executive Summary
4. Premium Insights
4.1. Porter’s Five Forces Analysis
4.2. Value Chain Analysis
4.3. Top Investment Pockets
4.3.1. Market Attractiveness Analysis By Form
4.3.2. Market Attractiveness Analysis By Type
4.3.3. Market Attractiveness Analysis By Source
4.3.4. Market Attractiveness Analysis By Application
4.3.5. Market Attractiveness Analysis By Region
4.4. Industry Trends
5. Market Dynamics
5.1. Market Evaluation
5.2. Drivers
5.2.1. Increasing use of fatty acids in nutraceutical product
5.3. Restraints
5.3.1. Adverse health effects
5.4. Opportunities
5.4.1. Increasing awareness for supplements
5.5. Challenges
5.5.1. Supply demand issues
6. Global Fatty Acids Market Analysis and Forecast, By Form
6.1. Segment Overview
6.2. Powder
6.3. Oil
6.4. Capsule
7. Global Fatty Acids Market Analysis and Forecast, By Type
7.1. Segment Overview
7.2. Saturated
7.3. Unsaturated
8. Global Fatty Acids Market Analysis and Forecast, By Source
8.1. Segment Overview
8.2. Plant Source
8.3. Animal Source
9. Global Fatty Acids Market Analysis and Forecast, By Application
9.1. Segment Overview
9.2. Food and Beverages
9.3. Personal Care and Cosmetics
9.4. Animal Feed
9.5. Pharmaceutical and Nutraceutical
9.6. Industrial
9.7. Others
10. Global Fatty Acids Market Analysis and Forecast, By Regional Analysis
10.1. Segment Overview
10.2. North America
10.2.1. U.S.
10.2.2. Canada
10.2.3. Mexico
10.3. Europe
10.3.1. Germany
10.3.2. France
10.3.3. U.K.
10.3.4. Italy
10.3.5. Spain
10.4. Asia-Pacific
10.4.1. Japan
10.4.2. China
10.4.3. India
10.5. South America
10.5.1. Brazil
10.6. Middle East and Africa
10.6.1. UAE
10.6.2. South Africa
11. Global Fatty Acids Market-Competitive Landscape
11.1. Overview
11.2. Market Share of Key Players in the Fatty Acids Market
11.2.1. Global Company Market Share
11.2.2. North America Company Market Share
11.2.3. Europe Company Market Share
11.2.4. APAC Company Market Share
11.3. Competitive Situations and Trends
11.3.1. Product Launches and Developments
11.3.2. Partnerships, Collaborations, and Agreements
11.3.3. Mergers & Acquisitions
11.3.4. Expansions
12. Company Profiles
12.1. Akzo Nobel
12.1.1. Business Overview
12.1.2. Company Snapshot
12.1.3. Company Market Share Analysis
12.1.4. Company Product Portfolio
12.1.5. Recent Developments
12.1.6. SWOT Analysis
12.2. BASF SE
12.2.1. Business Overview
12.2.2. Company Snapshot
12.2.3. Company Market Share Analysis
12.2.4. Company Product Portfolio
12.2.5. Recent Developments
12.2.6. SWOT Analysis
12.3. Arizona Chemicals
12.3.1. Business Overview
12.3.2. Company Snapshot
12.3.3. Company Market Share Analysis
12.3.4. Company Product Portfolio
12.3.5. Recent Developments
12.3.6. SWOT Analysis
12.4. Ashland Inc.
12.4.1. Business Overview
12.4.2. Company Snapshot
12.4.3. Company Market Share Analysis
12.4.4. Company Product Portfolio
12.4.5. Recent Developments
12.4.6. SWOT Analysis
12.5. Eastman Chemical
12.5.1. Business Overview
12.5.2. Company Snapshot
12.5.3. Company Market Share Analysis
12.5.4. Company Product Portfolio
12.5.5. Recent Developments
12.5.6. SWOT Analysis
12.6. Oleon N.V.
12.6.1. Business Overview
12.6.2. Company Snapshot
12.6.3. Company Market Share Analysis
12.6.4. Company Product Portfolio
12.6.5. Recent Developments
12.6.6. SWOT Analysis
12.7. Vantage Oleochemicals
12.7.1. Business Overview
12.7.2. Company Snapshot
12.7.3. Company Market Share Analysis
12.7.4. Company Product Portfolio
12.7.5. Recent Developments
12.7.6. SWOT Analysis
12.8. Ferro Corporation
1.1.1. Business Overview
1.1.2. Company Snapshot
1.1.3. Company Market Share Analysis
1.1.4. Company Product Portfolio
1.1.5. Recent Developments
1.1.6. SWOT Analysis
12.9. The Dow Chemical Company
12.9.1. Business Overview
12.9.2. Company Snapshot
12.9.3. Company Market Share Analysis
12.9.4. Company Product Portfolio
12.9.5. Recent Developments
12.9.6. SWOT Analysis
12.10. Koninklijke DSM NV
12.10.1. Business Overview
12.10.2. Company Snapshot
12.10.3. Company Market Share Analysis
12.10.4. Company Product Portfolio
12.10.5. Recent Developments
12.10.6. SWOT Analysis
12.11. FMC Corporation
12.11.1. Business Overview
12.11.2. Company Snapshot
12.11.3. Company Market Share Analysis
12.11.4. Company Product Portfolio
12.11.5. Recent Developments
12.11.6. SWOT Analysis
12.12. Omega Protein Corporation
12.12.1. Business Overview
12.12.2. Company Snapshot
12.12.3. Company Market Share Analysis
12.12.4. Company Product Portfolio
12.12.5. Recent Developments
12.12.6. SWOT Analysis
12.13. Enzymotec Ltd.
12.13.1. Business Overview
12.13.2. Company Snapshot
12.13.3. Company Market Share Analysis
12.13.4. Company Product Portfolio
12.13.5. Recent Developments
12.13.6. SWOT Analysis
12.14. Polaris Nutritional Lipids
12.14.1. Business Overview
12.14.2. Company Snapshot
12.14.3. Company Market Share Analysis
12.14.4. Company Product Portfolio
12.14.5. Recent Developments
12.14.6. SWOT Analysis
12.15. Croda International Plc
12.15.1. Business Overview
12.15.2. Company Snapshot
12.15.3. Company Market Share Analysis
12.15.4. Company Product Portfolio
12.15.5. Recent Developments
12.15.6. SWOT Analysis
12.16. Aker BioMarine AS
12.16.1. Business Overview
12.16.2. Company Snapshot
12.16.3. Company Market Share Analysis
12.16.4. Company Product Portfolio
12.16.5. Recent Developments
12.16.6. SWOT Analysis
12.17. Cargill
12.17.1. Business Overview
12.17.2. Company Snapshot
12.17.3. Company Market Share Analysis
12.17.4. Company Product Portfolio
12.17.5. Recent Developments
12.17.6. SWOT Analysis
List of Table
1. Global Fatty Acids Market, By Form, 2020-2033 (USD Billion)
2. Global Powder, Fatty Acids Market, By Region, 2020-2033 (USD Billion)
3. Global Oil, Fatty Acids Market, By Region, 2020-2033 (USD Billion)
4. Global Capsule, Fatty Acids Market, By Region, 2020-2033 (USD Billion)
5. Global Fatty Acids Market, By Type, 2020-2033 (USD Billion)
6. Global Saturated, Fatty Acids Market, By Region, 2020-2033 (USD Billion)
7. Global Unsaturated, Fatty Acids Market, By Region, 2020-2033 (USD Billion)
8. Global Fatty Acids Market, By Source, 2020-2033 (USD Billion)
9. Global Plant Source, Fatty Acids Market, By Region, 2020-2033 (USD Billion)
10. Global Animal Source, Fatty Acids Market, By Region, 2020-2033 (USD Billion)
11. Global Fatty Acids Market, By Application, 2020-2033 (USD Billion)
12. Global Food and Beverages, Fatty Acids Market, By Region, 2020-2033 (USD Billion)
13. Global Personal Care and Cosmetics, Fatty Acids Market, By Region, 2020-2033 (USD Billion)
14. Global Animal Feed, Fatty Acids Market, By Region, 2020-2033 (USD Billion)
15. Global Pharmaceutical and Nutraceutical, Fatty Acids Market, By Region, 2020-2033 (USD Billion)
16. Global Industrial, Fatty Acids Market, By Region, 2020-2033 (USD Billion)
17. Global Others, Fatty Acids Market, By Region, 2020-2033 (USD Billion)
18. Global Fatty Acids Market, By Region, 2020-2033 (USD Billion)
19. North America Fatty Acids Market, By Form, 2020-2033 (USD Billion)
20. North America Fatty Acids Market, By Type, 2020-2033 (USD Billion)
21. North America Fatty Acids Market, By Source, 2020-2033 (USD Billion)
22. North America Fatty Acids Market, By Application, 2020-2033 (USD Billion)
23. U.S. Fatty Acids Market, By Form, 2020-2033 (USD Billion)
24. U.S. Fatty Acids Market, By Type, 2020-2033 (USD Billion)
25. U.S. Fatty Acids Market, By Source, 2020-2033 (USD Billion)
26. U.S. Fatty Acids Market, By Application, 2020-2033 (USD Billion)
27. Canada Fatty Acids Market, By Form, 2020-2033 (USD Billion)
28. Canada Fatty Acids Market, By Type, 2020-2033 (USD Billion)
29. Canada Fatty Acids Market, By Source, 2020-2033 (USD Billion)
30. Canada Fatty Acids Market, By Application, 2020-2033 (USD Billion)
31. Mexico Fatty Acids Market, By Form, 2020-2033 (USD Billion)
32. Mexico Fatty Acids Market, By Type, 2020-2033 (USD Billion)
33. Mexico Fatty Acids Market, By Source, 2020-2033 (USD Billion)
34. Mexico Fatty Acids Market, By Application, 2020-2033 (USD Billion)
35. Europe Fatty Acids Market, By Form, 2020-2033 (USD Billion)
36. Europe Fatty Acids Market, By Type, 2020-2033 (USD Billion)
37. Europe Fatty Acids Market, By Source, 2020-2033 (USD Billion)
38. Europe Fatty Acids Market, By Application, 2020-2033 (USD Billion)
39. Germany Fatty Acids Market, By Form, 2020-2033 (USD Billion)
40. Germany Fatty Acids Market, By Type, 2020-2033 (USD Billion)
41. Germany Fatty Acids Market, By Source, 2020-2033 (USD Billion)
42. Germany Fatty Acids Market, By Application, 2020-2033 (USD Billion)
43. France Fatty Acids Market, By Form, 2020-2033 (USD Billion)
44. France Fatty Acids Market, By Type, 2020-2033 (USD Billion)
45. France Fatty Acids Market, By Source, 2020-2033 (USD Billion)
46. France Fatty Acids Market, By Application, 2020-2033 (USD Billion)
47. U.K. Fatty Acids Market, By Form, 2020-2033 (USD Billion)
48. U.K. Fatty Acids Market, By Type, 2020-2033 (USD Billion)
49. U.K. Fatty Acids Market, By Source, 2020-2033 (USD Billion)
50. U.K. Fatty Acids Market, By Application, 2020-2033 (USD Billion)
51. Italy Fatty Acids Market, By Form, 2020-2033 (USD Billion)
52. Italy Fatty Acids Market, By Type, 2020-2033 (USD Billion)
53. Italy Fatty Acids Market, By Source, 2020-2033 (USD Billion)
54. Italy Fatty Acids Market, By Application, 2020-2033 (USD Billion)
55. Spain Fatty Acids Market, By Form, 2020-2033 (USD Billion)
56. Spain Fatty Acids Market, By Type, 2020-2033 (USD Billion)
57. Spain Fatty Acids Market, By Source, 2020-2033 (USD Billion)
58. Spain Fatty Acids Market, By Application, 2020-2033 (USD Billion)
59. Asia Pacific Fatty Acids Market, By Form, 2020-2033 (USD Billion)
60. Asia Pacific Fatty Acids Market, By Type, 2020-2033 (USD Billion)
61. Asia Pacific Fatty Acids Market, By Source, 2020-2033 (USD Billion)
62. Asia Pacific Fatty Acids Market, By Application, 2020-2033 (USD Billion)
63. Japan Fatty Acids Market, By Form, 2020-2033 (USD Billion)
64. Japan Fatty Acids Market, By Type, 2020-2033 (USD Billion)
65. Japan Fatty Acids Market, By Source, 2020-2033 (USD Billion)
66. Japan Fatty Acids Market, By Application, 2020-2033 (USD Billion)
67. China Fatty Acids Market, By Form, 2020-2033 (USD Billion)
68. China Fatty Acids Market, By Type, 2020-2033 (USD Billion)
69. China Fatty Acids Market, By Source, 2020-2033 (USD Billion)
70. China Fatty Acids Market, By Application, 2020-2033 (USD Billion)
71. India Fatty Acids Market, By Form, 2020-2033 (USD Billion)
72. India Fatty Acids Market, By Type, 2020-2033 (USD Billion)
73. India Fatty Acids Market, By Source, 2020-2033 (USD Billion)
74. India Fatty Acids Market, By Application, 2020-2033 (USD Billion)
75. South America Fatty Acids Market, By Form, 2020-2033 (USD Billion)
76. South America Fatty Acids Market, By Type, 2020-2033 (USD Billion)
77. South America Fatty Acids Market, By Source, 2020-2033 (USD Billion)
78. South America Fatty Acids Market, By Application, 2020-2033 (USD Billion)
79. Brazil Fatty Acids Market, By Form, 2020-2033 (USD Billion)
80. Brazil Fatty Acids Market, By Type, 2020-2033 (USD Billion)
81. Brazil Fatty Acids Market, By Source, 2020-2033 (USD Billion)
82. Brazil Fatty Acids Market, By Application, 2020-2033 (USD Billion)
83. Middle East and Africa Fatty Acids Market, By Form, 2020-2033 (USD Billion)
84. Middle East and Africa Fatty Acids Market, By Type, 2020-2033 (USD Billion)
85. Middle East and Africa Fatty Acids Market, By Source, 2020-2033 (USD Billion)
86. Middle East and Africa Fatty Acids Market, By Application, 2020-2033 (USD Billion)
87. UAE Fatty Acids Market, By Form, 2020-2033 (USD Billion)
88. UAE Fatty Acids Market, By Type, 2020-2033 (USD Billion)
89. UAE Fatty Acids Market, By Source, 2020-2033 (USD Billion)
90. UAE Fatty Acids Market, By Application, 2020-2033 (USD Billion)
91. South Africa Fatty Acids Market, By Form, 2020-2033 (USD Billion)
92. South Africa Fatty Acids Market, By Type, 2020-2033 (USD Billion)
93. South Africa Fatty Acids Market, By Source, 2020-2033 (USD Billion)
94. South Africa Fatty Acids Market, By Application, 2020-2033 (USD Billion)
List of Figures
1. Global Fatty Acids Market Segmentation
2. Fatty Acids Market: Research Methodology
3. Market Size Estimation Methodology: Bottom-Up Approach
4. Market Size Estimation Methodology: Top-Down Approach
5. Data Triangulation
6. Porter’s Five Forces Analysis
7. Value Chain Analysis
8. Global Fatty Acids Market Attractiveness Analysis By Form
9. Global Fatty Acids Market Attractiveness Analysis By Type
10. Global Fatty Acids Market Attractiveness Analysis By Source
11. Global Fatty Acids Market Attractiveness Analysis By Application
12. Global Fatty Acids Market Attractiveness Analysis By Region
13. Global Fatty Acids Market: Dynamics
14. Global Fatty Acids Market Share by Form (2023 & 2032)
15. Global Fatty Acids Market Share by Type (2023 & 2032)
16. Global Fatty Acids Market Share by Source (2023 & 2032)
17. Global Fatty Acids Market Share by Application (2023 & 2032)
18. Global Fatty Acids Market Share by Regions (2023 & 2032)
19. Global Fatty Acids Market Share by Company (2023)
This study forecasts revenue at global, regional, and country levels from 2020 to 2033. The Brainy Insights has segmented the global fatty acids market based on below mentioned segments:
Global Fatty Acids Market by Form:
Global Fatty Acids Market by Type:
Global Fatty Acids Market by Source:
Global Fatty Acids Market by Application:
Global Fatty Acids Market by Region:
Research has its special purpose to undertake marketing efficiently. In this competitive scenario, businesses need information across all industry verticals; the information about customer wants, market demand, competition, industry trends, distribution channels etc. This information needs to be updated regularly because businesses operate in a dynamic environment. Our organization, The Brainy Insights incorporates scientific and systematic research procedures in order to get proper market insights and industry analysis for overall business success. The analysis consists of studying the market from a miniscule level wherein we implement statistical tools which helps us in examining the data with accuracy and precision.
Our research reports feature both; quantitative and qualitative aspects for any market. Qualitative information for any market research process are fundamental because they reveal the customer needs and wants, usage and consumption for any product/service related to a specific industry. This in turn aids the marketers/investors in knowing certain perceptions of the customers. Qualitative research can enlighten about the different product concepts and designs along with unique service offering that in turn, helps define marketing problems and generate opportunities. On the other hand, quantitative research engages with the data collection process through interviews, e-mail interactions, surveys and pilot studies. Quantitative aspects for the market research are useful to validate the hypotheses generated during qualitative research method, explore empirical patterns in the data with the help of statistical tools, and finally make the market estimations.
The Brainy Insights offers comprehensive research and analysis, based on a wide assortment of factual insights gained through interviews with CXOs and global experts and secondary data from reliable sources. Our analysts and industry specialist assume vital roles in building up statistical tools and analysis models, which are used to analyse the data and arrive at accurate insights with exceedingly informative research discoveries. The data provided by our organization have proven precious to a diverse range of companies, facilitating them to address issues such as determining which products/services are the most appealing, whether or not customers use the product in the manner anticipated, the purchasing intentions of the market and many others.
Our research methodology encompasses an idyllic combination of primary and secondary initiatives. Key phases involved in this process are listed below:

The phase involves the gathering and collecting of market data and its related information with the help of different sources & research procedures.

The data procurement stage involves in data gathering and collecting through various data sources.
This stage involves in extensive research. These data sources includes:
Purchased Database: Purchased databases play a crucial role in estimating the market sizes irrespective of the domain. Our purchased database includes:
Primary Research: The Brainy Insights interacts with leading companies and experts of the concerned domain to develop the analyst team’s market understanding and expertise. It improves and substantiates every single data presented in the market reports. Primary research mainly involves in telephonic interviews, E-mail interactions and face-to-face interviews with the raw material providers, manufacturers/producers, distributors, & independent consultants. The interviews that we conduct provides valuable data on market size and industry growth trends prevailing in the market. Our organization also conducts surveys with the various industry experts in order to gain overall insights of the industry/market. For instance, in healthcare industry we conduct surveys with the pharmacists, doctors, surgeons and nurses in order to gain insights and key information of a medical product/device/equipment which the customers are going to usage. Surveys are conducted in the form of questionnaire designed by our own analyst team. Surveys plays an important role in primary research because surveys helps us to identify the key target audiences of the market. Additionally, surveys helps to identify the key target audience engaged with the market. Our survey team conducts the survey by targeting the key audience, thus gaining insights from them. Based on the perspectives of the customers, this information is utilized to formulate market strategies. Moreover, market surveys helps us to understand the current competitive situation of the industry. To be precise, our survey process typically involve with the 360 analysis of the market. This analytical process begins by identifying the prospective customers for a product or service related to the market/industry to obtain data on how a product/service could fit into customers’ lives.

Secondary Research: The secondary data sources includes information published by the on-profit organizations such as World bank, WHO, company fillings, investor presentations, annual reports, national government documents, statistical databases, blogs, articles, white papers and others. From the annual report, we analyse a company’s revenue to understand the key segment and market share of that organization in a particular region. We analyse the company websites and adopt the product mapping technique which is important for deriving the segment revenue. In the product mapping method, we select and categorize the products offered by the companies catering to domain specific market, deduce the product revenue for each of the companies so as to get overall estimation of the market size. We also source data and analyses trends based on information received from supply side and demand side intermediaries in the value chain. The supply side denotes the data gathered from supplier, distributor, wholesaler and the demand side illustrates the data gathered from the end customers for respective market domain.

The supply side for a domain specific market is analysed by:
The demand side for the market is estimated through:
In-house Library: Apart from these third-party sources, we have our in-house library of qualitative and quantitative information. Our in-house database includes market data for various industry and domains. These data are updated on regular basis as per the changing market scenario. Our library includes, historic databases, internal audit reports and archives.
Sometimes there are instances where there is no metadata or raw data available for any domain specific market. For those cases, we use our expertise to forecast and estimate the market size in order to generate comprehensive data sets. Our analyst team adopt a robust research technique in order to produce the estimates:
Data Synthesis: This stage involves the analysis & mapping of all the information obtained from the previous step. It also involves in scrutinizing the data for any discrepancy observed while data gathering related to the market. The data is collected with consideration to the heterogeneity of sources. Robust scientific techniques are in place for synthesizing disparate data sets and provide the essential contextual information that can orient market strategies. The Brainy Insights has extensive experience in data synthesis where the data passes through various stages:


Market Deduction & Formulation: The final stage comprises of assigning data points at appropriate market spaces so as to deduce feasible conclusions. Analyst perspective & subject matter expert based holistic form of market sizing coupled with industry analysis also plays a crucial role in this stage.
This stage involves in finalization of the market size and numbers that we have collected from data integration step. With data interpolation, it is made sure that there is no gap in the market data. Successful trend analysis is done by our analysts using extrapolation techniques, which provide the best possible forecasts for the market.
Data Validation & Market Feedback: Validation is the most important step in the process. Validation & re-validation via an intricately designed process helps us finalize data-points to be used for final calculations.

The Brainy Insights interacts with leading companies and experts of the concerned domain to develop the analyst team’s market understanding and expertise. It improves and substantiates every single data presented in the market reports. The data validation interview and discussion panels are typically composed of the most experienced industry members. The participants include, however, are not limited to:
Moreover, we always validate our data and findings through primary respondents from all the major regions we are working on.


Free Customization
Fortune 500 Clients
Free Yearly Update On Purchase Of Multi/Corporate License
Companies Served Till Date