- +1-315-215-1633
- sales@thebrainyinsights.com

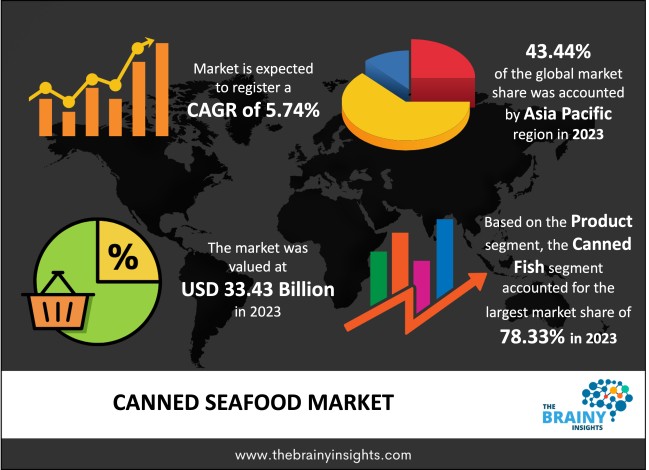
The canned seafood market was valued at USD 33.43 billion in 2023 and is expected to reach USD 58.40 billion by 2033, expanding at a CAGR of 5.74% from 2024 to 2033. The growing demand for convenience food products is expected to boost the demand for canned seafood. Further, increased awareness about the many health benefits of seafood such as tuna, and salmon is propelling the adoption of canned seafood.
According to a USDA study, canned varieties of seafood have higher levels of omega-3 and added amounts of calcium. An additional benefit of canned salmon is that it has reduced contents of mercury as it is being caught wild rather than farmed. Similarly, the percentage of pesticides found in canned salmon is lower, which drives the demand for canned fish over fresh fish.
Seafood is a rich source of protein along with various essential nutrients that increase metabolism and concentration, improve eyesight, decrease the risk of depression, and increase immunity, among other benefits. The American Heart Association recommends eating fish at least two times per week as part of a healthy diet.
Get an overview of this study by requesting a free sample
Canned seafood has become a part of the palette for consumers in America and European countries. Canned seafood of clams, octopus, mussels and other species are also gaining traction among consumers. Now a day, consumers are seeking canned seafood in olive oil or organic oil as it tastes better with oil and pair it with a glass of wine.
Canned fish dominated the market and held a share of over 78.33% in 2023. The canned fish segment is further segmented into tuna, salmon, sardines, and other fishes. Among these, tuna held a share of over 49.21% in 2023. The popular species of tuna used for canning include skipjack, yellowfin, and albacore. Depending upon the color of the flesh of the tuna species, the can is often marked as "light" or "white" which refers to a greyish pink or light pink color. Manufacturers are looking to launch sustainably source canned tuna owing to increasing consumer demand for sustainable food products.
Canned crustaceans, mollusks, and cephalopods are anticipated to expand at a faster CAGR during the forecast period. Among these, prawns held the largest market share during the forecast period. Prawns also promote healthy bones and teeth since they are rich in calcium. They also contain vitamin E and are hence good for the skin. Furthermore, prawns contain Vitamin B, which helps keep memory sharp and is good for cardiac health. Some of the popular recipes prepared using canned prawns include prawn laksa skewers, tamarind school prawn cocktail, pan-roasted prawns, satay prawns, chili prawn larb lettuce cups, butterflied prawns, prawn cocktail salad, barbecued prawns, and beer-battered lemon and prawns.
Retail led the market with a share of over 57.11% in 2023. Most consumers prefer to purchase canned and other convenience food products through the retail channel as they consume these foods in the comfort of their homes. Further, the wide availability of brands from all over the world also influences a consumer to purchase a product through this channel. During the outbreak of Covid-19, consumers stocked up on canned seafood products available through retail stores in North America and Europe owing to uncertainty in the market.
The food service channel is anticipated to expand with a higher CAGR of 6.2% from 2022-2030. The rising consumption of canned seafood in high-end restaurants and hotels is driving the demand through this channel. According to Bloomberg, the following restaurants in North America serve canned fish: -
| Restaurant Name | Location |
|---|---|
| Sardine Head | Portland, US |
| Dyllan’s Raw Bar Grill | Washington D.C., US |
| Mercado Little Spain | New York, U.S. |
| Verjus | San Francisco, US |
| Middle Brow Bungalow | Chicago, US |
Asia Pacific accounted for the highest share of 43.44% of the market in 2023. The high consumption of canned seafood in countries like China, Japan, Malaysia, and Indonesia is driving regional growth. Further, the rapid development of the processing and manufacturing industries, availability of cheap labor, and increasing consumption are also expected to drive growth in the coming years.
North America is anticipated to register significant growth over the forecast period. The demand for canned seafood is anticipated to increase especially because of the rising demand for canned tuna and salmon in the US and Canada. Further, product launches and innovations are expected to bode well for regional growth. In September 2020, Bart van Olphen, a celebrity chef and founder of the sustainable seafood brand Fish Tales, launched a sustainable canned seafood line under his new brand Sea Tales in the U.S. market. The product line was launched in Stop & Shop and Whole Foods Market stores.
Similarly, in September 2020, Scout, a Canadian seafood brand, launched a canned seafood line to source species off local shores. The brand has been focused on creating a local and sustainable business model, established through a network of small-scale and sustainable fisheries, local to Canada and the US. Its products are certified by the Marine Stewardship Council and include Prince Edward Island mussels, Atlantic lobster, Albacore Tuna from the Pacific Northwest, and Ontario trout.
Canned seafood produced by the company is supplied to the domestic market as well as exported to offshore markets. The production volume for the market illustrates a growing trend throughout the years owing to continuous demand. The companies in this domain are involved in benchmarking their products along with the regulations following the sustainable food parameters.
Segments Covered in the Report
As per The Brainy Insights, the size of the Canned Seafood market was valued at USD 33.43 billion in 2023 to USD 58.40 billion by 2033.
Global Canned Seafood market is growing at a CAGR of 5.74% during the forecast period 2024-2033.
Asia Pacific region emerged as the largest market for the Canned Seafood.
Key players are Wild Planet Foods, Inc., Tri Marine, StarKist Co., Maruha Nichiro Corporation, Nippon Suisan Kaisha, Ltd, Thai Union Group, Bumble Bee Foods, LLC, American Tuna, Inc., Universal Canning Inc. and Trident Seafoods Corporation.
1. Introduction
1.1. Objectives of the Study
1.2. Market Definition
1.3. Research Scope
1.4. Currency
1.5. Key Target Audience
2. Research Methodology and Assumptions
3. Executive Summary
4. Premium Insights
4.1. Porter’s Five Forces Analysis
4.2. Value Chain Analysis
4.3. Top Investment Pockets
4.3.1. Market Attractiveness Analysis by Product
4.3.2. Market Attractiveness Analysis by Distribution Channel
4.3.3. Market Attractiveness Analysis by Region
4.4. Industry Trends
5. Market Dynamics
5.1. Market Evaluation
5.2. Drivers
5.2.1. Rising consumption of canned crustaceans and mollusks among consumers
5.3. Restraints
5.3.1. High price
5.4. Opportunities
5.4.1. Rising adoption from both residential and commercial users
6. Global Canned Seafood Market Analysis and Forecast, By Product
6.1. Segment Overview
6.2. Canned Fish
6.2.1. Tuna
6.2.2. Salmon
6.2.3. Sardines
6.2.4. Others
6.3. Canned Crustaceans, Mollusks and Cephalopods
6.3.1. Canned Crustaceans
6.3.2. Canned Mollusks
6.3.3. Canned Cephalopods
7. Global Canned Seafood Market Analysis and Forecast, By Distribution Channel
7.1. Segment Overview
7.2. Retail
7.3. Foodservice
8. Global Canned Seafood Market Analysis and Forecast, By Regional Analysis
8.1. Segment Overview
8.2. North America
8.2.1. U.S.
8.2.2. Canada
8.2.3. Mexico
8.3. Europe
8.3.1. Germany
8.3.2. France
8.3.3. U.K.
8.3.4. Italy
8.3.5. Spain
8.4. Asia-Pacific
8.4.1. Japan
8.4.2. China
8.4.3. India
8.5. South America
8.5.1. Brazil
8.6. Middle East and Africa
8.6.1. UAE
8.6.2. South Africa
9. Global Canned Seafood Market-Competitive Landscape
9.1. Overview
9.2. Market Share of Key Players in the Canned Seafood Market
9.2.1. Global Company Market Share
9.2.2. North America Company Market Share
9.2.3. Europe Company Market Share
9.2.4. APAC Company Market Share
9.3. Competitive Situations and Trends
9.3.1. Product Launches and Developments
9.3.2. Partnerships, Collaborations, and Agreements
9.3.3. Mergers & Acquisitions
9.3.4. Expansions
10. Company Profiles
10.1. Wild Planet Foods, Inc.
10.1.1. Business Overview
10.1.2. Company Snapshot
10.1.3. Company Market Share Analysis
10.1.4. Company Product Portfolio
10.1.5. Recent Developments
10.1.6. SWOT Analysis
10.2. Tri Marine
10.2.1. Business Overview
10.2.2. Company Snapshot
10.2.3. Company Market Share Analysis
10.2.4. Company Product Portfolio
10.2.5. Recent Developments
10.2.6. SWOT Analysis
10.3. StarKist Co.
10.3.1. Business Overview
10.3.2. Company Snapshot
10.3.3. Company Market Share Analysis
10.3.4. Company Product Portfolio
10.3.5. Recent Developments
10.3.6. SWOT Analysis
10.4. Maruha Nichiro Corporation
10.4.1. Business Overview
10.4.2. Company Snapshot
10.4.3. Company Market Share Analysis
10.4.4. Company Product Portfolio
10.4.5. Recent Developments
10.4.6. SWOT Analysis
10.5. Nippon Suisan Kaisha, Ltd
10.5.1. Business Overview
10.5.2. Company Snapshot
10.5.3. Company Market Share Analysis
10.5.4. Company Product Portfolio
10.5.5. Recent Developments
10.5.6. SWOT Analysis
10.6. Thai Union Group
10.6.1. Business Overview
10.6.2. Company Snapshot
10.6.3. Company Market Share Analysis
10.6.4. Company Product Portfolio
10.6.5. Recent Developments
10.6.6. SWOT Analysis
10.7. Bumble Bee Foods, LLC
10.7.1. Business Overview
10.7.2. Company Snapshot
10.7.3. Company Market Share Analysis
10.7.4. Company Product Portfolio
10.7.5. Recent Developments
10.7.6. SWOT Analysis
10.8. American Tuna, Inc.
10.8.1. Business Overview
10.8.2. Company Snapshot
10.8.3. Company Market Share Analysis
10.8.4. Company Product Portfolio
10.8.5. Recent Developments
10.8.6. SWOT Analysis
10.9. Universal Canning Inc.
10.9.1. Business Overview
10.9.2. Company Snapshot
10.9.3. Company Market Share Analysis
10.9.4. Company Product Portfolio
10.9.5. Recent Developments
10.9.6. SWOT Analysis
10.10. Trident Seafoods Corporation
10.10.1. Business Overview
10.10.2. Company Snapshot
10.10.3. Company Market Share Analysis
10.10.4. Company Product Portfolio
10.10.5. Recent Developments
10.10.6. SWOT Analysis
List of Table
1. Global Canned Seafood Market, By Product, 2020-2033 (USD Billion)
2. Global Canned Fish Canned Seafood Market, By Region, 2020-2033 (USD Billion)
3. Global Canned Crustaceans, Mollusks and Cephalopods Canned Seafood Market, By Region, 2020-2033 (USD Billion)
4. Global Canned Seafood Market, By Distribution Channel, 2020-2033 (USD Billion)
5. Global Retail Canned Seafood Market, By Region, 2020-2033 (USD Billion)
6. Global Foodservice Canned Seafood Market, By Region, 2020-2033 (USD Billion)
7. Global Canned Seafood Market, By Region, 2020-2033 (USD Billion)
8. North America Canned Seafood Market, By Product, 2020-2033 (USD Billion)
9. North America Canned Seafood Market, By Distribution Channel, 2020-2033 (USD Billion)
10. U.S. Canned Seafood Market, By Product, 2020-2033 (USD Billion)
11. U.S. Canned Seafood Market, By Distribution Channel, 2020-2033 (USD Billion)
12. Canada Canned Seafood Market, By Product, 2020-2033 (USD Billion)
13. Canada Canned Seafood Market, By Distribution Channel, 2020-2033 (USD Billion)
14. Mexico Canned Seafood Market, By Product, 2020-2033 (USD Billion)
15. Mexico Canned Seafood Market, By Distribution Channel, 2020-2033 (USD Billion)
16. Europe Canned Seafood Market, By Product, 2020-2033 (USD Billion)
17. Europe Canned Seafood Market, By Distribution Channel, 2020-2033 (USD Billion)
18. Germany Canned Seafood Market, By Product, 2020-2033 (USD Billion)
19. Germany Canned Seafood Market, By Distribution Channel, 2020-2033 (USD Billion)
20. France Canned Seafood Market, By Product, 2020-2033 (USD Billion)
21. France Canned Seafood Market, By Distribution Channel, 2020-2033 (USD Billion)
22. U.K. Canned Seafood Market, By Product, 2020-2033 (USD Billion)
23. U.K. Canned Seafood Market, By Distribution Channel, 2020-2033 (USD Billion)
24. Italy Canned Seafood Market, By Product, 2020-2033 (USD Billion)
25. Italy Canned Seafood Market, By Distribution Channel, 2020-2033 (USD Billion)
26. Spain Canned Seafood Market, By Product, 2020-2033 (USD Billion)
27. Spain Canned Seafood Market, By Distribution Channel, 2020-2033 (USD Billion)
28. Asia Pacific Canned Seafood Market, By Product, 2020-2033 (USD Billion)
29. Asia Pacific Canned Seafood Market, By Distribution Channel, 2020-2033 (USD Billion)
30. Japan Canned Seafood Market, By Product, 2020-2033 (USD Billion)
31. Japan Canned Seafood Market, By Distribution Channel, 2020-2033 (USD Billion)
32. China Canned Seafood Market, By Product, 2020-2033 (USD Billion)
33. China Canned Seafood Market, By Distribution Channel, 2020-2033 (USD Billion)
34. India Canned Seafood Market, By Product, 2020-2033 (USD Billion)
35. India Canned Seafood Market, By Distribution Channel, 2020-2033 (USD Billion)
36. South America Canned Seafood Market, By Product, 2020-2033 (USD Billion)
37. South America Canned Seafood Market, By Distribution Channel, 2020-2033 (USD Billion)
38. Brazil Canned Seafood Market, By Product, 2020-2033 (USD Billion)
39. Brazil Canned Seafood Market, By Distribution Channel, 2020-2033 (USD Billion)
40. Middle East and Africa Canned Seafood Market, By Product, 2020-2033 (USD Billion)
41. Middle East and Africa Canned Seafood Market, By Distribution Channel, 2020-2033 (USD Billion)
42. UAE Canned Seafood Market, By Product, 2020-2033 (USD Billion)
43. UAE Canned Seafood Market, By Distribution Channel, 2020-2033 (USD Billion)
44. South Africa Canned Seafood Market, By Product, 2020-2033 (USD Billion)
45. South Africa Canned Seafood Market, By Distribution Channel, 2020-2033 (USD Billion)
List of Figures
1. Global Canned Seafood Market Segmentation
2. Canned Seafood Market: Research Methodology
3. Market Size Estimation Methodology: Bottom-Up Approach
4. Market Size Estimation Methodology: Top-Down Approach
5. Data Triangulation
6. Porter’s Five Forces Analysis
7. Value Chain Analysis
8. Global Canned Seafood Market Attractiveness Analysis by Product
9. Global Canned Seafood Market Attractiveness Analysis by Distribution Channel
10. Global Canned Seafood Market Attractiveness Analysis by Region
11. Global Canned Seafood Market: Dynamics
12. Global Canned Seafood Market Share by Product (2023 & 2033)
13. Global Canned Seafood Market Share by Distribution Channel (2023 & 2033)
14. Global Canned Seafood Market Share by Regions (2023 & 2033)
15. Global Canned Seafood Market Share by Company (2023)
This study forecasts revenue at global, regional, and country levels from 2020 to 2033. The Brainy Insights has segmented the global Canned Seafood market based on below mentioned segments:
Global Canned Seafood Market by Product:
Global Canned Seafood Market by Distribution Channel:
Global Canned Seafood Market by Region:
Research has its special purpose to undertake marketing efficiently. In this competitive scenario, businesses need information across all industry verticals; the information about customer wants, market demand, competition, industry trends, distribution channels etc. This information needs to be updated regularly because businesses operate in a dynamic environment. Our organization, The Brainy Insights incorporates scientific and systematic research procedures in order to get proper market insights and industry analysis for overall business success. The analysis consists of studying the market from a miniscule level wherein we implement statistical tools which helps us in examining the data with accuracy and precision.
Our research reports feature both; quantitative and qualitative aspects for any market. Qualitative information for any market research process are fundamental because they reveal the customer needs and wants, usage and consumption for any product/service related to a specific industry. This in turn aids the marketers/investors in knowing certain perceptions of the customers. Qualitative research can enlighten about the different product concepts and designs along with unique service offering that in turn, helps define marketing problems and generate opportunities. On the other hand, quantitative research engages with the data collection process through interviews, e-mail interactions, surveys and pilot studies. Quantitative aspects for the market research are useful to validate the hypotheses generated during qualitative research method, explore empirical patterns in the data with the help of statistical tools, and finally make the market estimations.
The Brainy Insights offers comprehensive research and analysis, based on a wide assortment of factual insights gained through interviews with CXOs and global experts and secondary data from reliable sources. Our analysts and industry specialist assume vital roles in building up statistical tools and analysis models, which are used to analyse the data and arrive at accurate insights with exceedingly informative research discoveries. The data provided by our organization have proven precious to a diverse range of companies, facilitating them to address issues such as determining which products/services are the most appealing, whether or not customers use the product in the manner anticipated, the purchasing intentions of the market and many others.
Our research methodology encompasses an idyllic combination of primary and secondary initiatives. Key phases involved in this process are listed below:

The phase involves the gathering and collecting of market data and its related information with the help of different sources & research procedures.

The data procurement stage involves in data gathering and collecting through various data sources.
This stage involves in extensive research. These data sources includes:
Purchased Database: Purchased databases play a crucial role in estimating the market sizes irrespective of the domain. Our purchased database includes:
Primary Research: The Brainy Insights interacts with leading companies and experts of the concerned domain to develop the analyst team’s market understanding and expertise. It improves and substantiates every single data presented in the market reports. Primary research mainly involves in telephonic interviews, E-mail interactions and face-to-face interviews with the raw material providers, manufacturers/producers, distributors, & independent consultants. The interviews that we conduct provides valuable data on market size and industry growth trends prevailing in the market. Our organization also conducts surveys with the various industry experts in order to gain overall insights of the industry/market. For instance, in healthcare industry we conduct surveys with the pharmacists, doctors, surgeons and nurses in order to gain insights and key information of a medical product/device/equipment which the customers are going to usage. Surveys are conducted in the form of questionnaire designed by our own analyst team. Surveys plays an important role in primary research because surveys helps us to identify the key target audiences of the market. Additionally, surveys helps to identify the key target audience engaged with the market. Our survey team conducts the survey by targeting the key audience, thus gaining insights from them. Based on the perspectives of the customers, this information is utilized to formulate market strategies. Moreover, market surveys helps us to understand the current competitive situation of the industry. To be precise, our survey process typically involve with the 360 analysis of the market. This analytical process begins by identifying the prospective customers for a product or service related to the market/industry to obtain data on how a product/service could fit into customers’ lives.

Secondary Research: The secondary data sources includes information published by the on-profit organizations such as World bank, WHO, company fillings, investor presentations, annual reports, national government documents, statistical databases, blogs, articles, white papers and others. From the annual report, we analyse a company’s revenue to understand the key segment and market share of that organization in a particular region. We analyse the company websites and adopt the product mapping technique which is important for deriving the segment revenue. In the product mapping method, we select and categorize the products offered by the companies catering to domain specific market, deduce the product revenue for each of the companies so as to get overall estimation of the market size. We also source data and analyses trends based on information received from supply side and demand side intermediaries in the value chain. The supply side denotes the data gathered from supplier, distributor, wholesaler and the demand side illustrates the data gathered from the end customers for respective market domain.

The supply side for a domain specific market is analysed by:
The demand side for the market is estimated through:
In-house Library: Apart from these third-party sources, we have our in-house library of qualitative and quantitative information. Our in-house database includes market data for various industry and domains. These data are updated on regular basis as per the changing market scenario. Our library includes, historic databases, internal audit reports and archives.
Sometimes there are instances where there is no metadata or raw data available for any domain specific market. For those cases, we use our expertise to forecast and estimate the market size in order to generate comprehensive data sets. Our analyst team adopt a robust research technique in order to produce the estimates:
Data Synthesis: This stage involves the analysis & mapping of all the information obtained from the previous step. It also involves in scrutinizing the data for any discrepancy observed while data gathering related to the market. The data is collected with consideration to the heterogeneity of sources. Robust scientific techniques are in place for synthesizing disparate data sets and provide the essential contextual information that can orient market strategies. The Brainy Insights has extensive experience in data synthesis where the data passes through various stages:


Market Deduction & Formulation: The final stage comprises of assigning data points at appropriate market spaces so as to deduce feasible conclusions. Analyst perspective & subject matter expert based holistic form of market sizing coupled with industry analysis also plays a crucial role in this stage.
This stage involves in finalization of the market size and numbers that we have collected from data integration step. With data interpolation, it is made sure that there is no gap in the market data. Successful trend analysis is done by our analysts using extrapolation techniques, which provide the best possible forecasts for the market.
Data Validation & Market Feedback: Validation is the most important step in the process. Validation & re-validation via an intricately designed process helps us finalize data-points to be used for final calculations.

The Brainy Insights interacts with leading companies and experts of the concerned domain to develop the analyst team’s market understanding and expertise. It improves and substantiates every single data presented in the market reports. The data validation interview and discussion panels are typically composed of the most experienced industry members. The participants include, however, are not limited to:
Moreover, we always validate our data and findings through primary respondents from all the major regions we are working on.


Free Customization
Fortune 500 Clients
Free Yearly Update On Purchase Of Multi/Corporate License
Companies Served Till Date