- +1-315-215-1633
- sales@thebrainyinsights.com

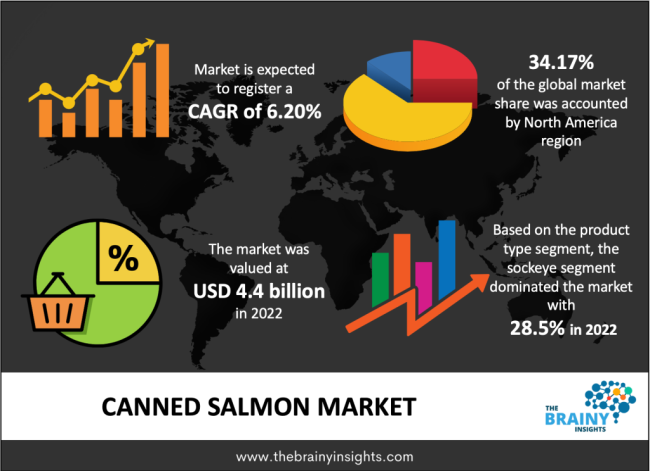
The global canned salmon market was valued at USD 4.4 billion in 2022 and growing at a CAGR of 6.20% from 2022 to 2030. The market is expected to reach USD 7.11 billion by 2030. Canned salmon is noticing an increased demand due to high consumption of seafood that gives various health advantages. Canned salmon is an excellent source of vital nutrients like protein, which is needed for a healthy body. Customer understanding of healthy lifestyles and the advantage of healthy food is increasing, leading the consumers to approach nutrient-enriched food products, which helps to promote the growth of the global canned salmon market. Also, the transformation in the way of living and a growth in the working people has brought a change in the eating habits of customers. Customers are choosing processed food like canned salmon that is ready-to-eat, convenient for storage and consumption, and includes nutritional ingredients that are useful for good health.
Canned salmon is an essential food source. Canned salmon is rich in protein and other nutrients; many nutrients are a good form of omega-3 fatty acids. Numerous sea creatures are canned, including molluscs, fish, and crustaceans. Salmon is one of the healthiest fish choices among all. It is enriched with protein and omega-3 fatty acids, and different minerals and vitamins. Salmon is sealed raw into cans by removing the fins, skin, and bones, which are edible after processing, and are considered part of the pack. Canned salmon is rich in vitamin D, protein, calcium, and omega-3 fats. Omega-3 fats are healthy for the heart and boost healthy infant brain growth. The various types of canned salmon (chum, red sockeye, coho, and pink) are healthy options. Selecting the canned salmon with the bones is highly rich in calcium. Salmon is also a part of the meat and beans group; foods from the meat and beans give essential nutrients like iron and protein. Most canned salmon include only salmon and salt. The added salt works as both a preservative and flavor enhancer; however, an adequate quantity of sodium intake is essential. One serving of the canned salmon labels includes between 200 and 300 milligrams of sodium or around 10% of the suggested daily intake. Wild Planet's Wild Pink and Sockeye canned salmon, Kirkland Signature canned salmon, 365 by Whole Foods canned salmon, and Chicken of the Sea canned salmon all range between 200 and 240 milligrams of sodium per serving which is the quantity prescribed for sodium intake for a healthy body.
In December 2021: The US Department of Agriculture (USDA) released a bid solicitation for 302,480 cases of canned sockeye salmon last week, extending the stretch of record federal seafood purchases.
In 2020, Taiwanese company FCF Co. Ltd. (FCF), one of the world’s biggest integrated marine industry supply-chain service providers, acquired Bumble Bee Seafoods.
Get an overview of this study by requesting a free sample
Canned Salmon Are Excellent Source of Proteins- Salmon includes many proteins and is a vital macronutrient for a healthy diet. A six-ounce can of salmon has around 33 grams of proteins, which is approximately 68% of the suggested daily intake of proteins. Therefore, canned salmon and appropriate exercise can help in living a healthy life.
Helps in improving the brain health- Fatty fish like salmon plays a vital role in supporting mental health, and it also helps in reducing the symptoms of depression and anxiety. It may also slow mental downfall. The study shows that over 66 people who consumed fatty fish at least two times a week had a 14% slower decrease in age-related memory problems compared to those who took less than a serving of fatty fish in a week.
Increased amounts of sodium- If consumed adequately, sodium intake through canned salmon benefits the body. Regardless, salt is broadly utilized as a natural preservative for canned salmon, which can increase the sodium intake more than the suggested amount. Therefore, people with compromised kidneys and high blood pressure are not recommended to take canned fish like salmon.
Technological advancement to maintain sustainability- Customers have begun selecting for seafood products that are formed sustainably according to consumers' increasing problem for socially and environmentally related seafood procurement which has resulted in the advancement in the number of canned salmon suppliers exploring to procure raw materials from the fisheries that are Aquaculture Stewardship Council (ASC) and Marine Stewardship Council (MSC) certified to be a part of the sustainable steps and ultimately push the canned salmon sales in the market.
Curd & adhesion associated with canned salmon- The use of raw fish which is not so fresh, and inadequate brining or precooking are responsible for emergence of curd in the can. Curd is precipitated protein often present on top of canned fish like salmon which is generally canned without pre-cooking. The curd may stick to the can surface and the lacquer may even get peeled off when the curd is removed.
The regions analyzed for the market include North America, Europe, South America, Asia Pacific, the Middle East, and Africa. North America emerged as the largest market for the global canned salmon market, with a 34.17% share of the market revenue in 2022.
Canned foods are the most acceptable choices for health-conscious consumers, especially athletes, and are famous in the North American region. Further, canned salmon has a long shelf life and the capability to store it and ship it to different continents or countries where salmon fish are scarce. Also, the increasing popularity of canned salmon among consumers would raise the market's growth during the forecasting period in the region. Additionally, the increase in the number of canned salmon manufacturers and the growth of existing manufacturers as per increasing demand is driving the sales of canned salmon. The European region registered for the second-highest share. An upsurge in the need for plant-based seafood is also pushing the European market. Customers looking for sustainable and vegan choices are transforming to plant-based seafood that gives nutritional advantages necessary for a healthy body.
North America Region Canned Salmon Market Share in 2022 - 34.17%
www.thebrainyinsights.com
Check the geographical analysis of this market by requesting a free sample
The product type segment is divided into chum salmon, sockeye salmon, coho salmon, and pink salmon. The sockeye segment dominated the market, with a market share of around 28.5% in 2022. The sockeye salmon is also called red salmon. The size of the salmon lies from 23 to 32 inches in length and weighs between 4 and 14 pounds. Red salmon have a hard texture and more high oil content. These are costly and not readily available compared to pink and chum salmon.
The source segment is divided into farmed canned salmon and wild canned salmon. The farmed canned salmon segment dominated the market, with a market share of around 54.5% in 2022. The farmed salmon production is growing drastically up. Farmed salmon can be increased in fat content. Farmed salmon has a different diet and environment than wild salmon.
The distribution channel segment is divided into specialty stores, online channels, hypermarket/supermarket, and others. The hypermarket/supermarket segment dominated the market, with a market share of around 27.2% in 2022. Consumers quickly get the product in the hypermarket/supermarket. Due to the customer purchasing power, the salmon market will likely rise in the growing countries. Additionally, the vast consumer base in growing countries positively impacts the growth of the segment.
| Attribute | Description |
|---|---|
| Market Size | Revenue (USD Billion), Volume (Kg) |
| Market size value in 2021 | USD 4.4 Billion |
| Market size value in 2030 | USD 7.11 Billion |
| CAGR (2022 to 2030) | 6.20% |
| Historical data | 2019-2020 |
| Base Year | 2021 |
| Forecast | 2022-2030 |
| Segments | Product Type, Source, Distribution Channel |
| Regional Segments | The regions analyzed for the market are Asia Pacific, Europe, North America, South America, and Middle East & Africa. Furthermore, the regions are further analyzed at the country level. |
As per The Brainy Insights, the size of the canned salmon market was valued at USD 4.4 billion in 2022 to USD 7.11 billion by 2030.
Global canned salmon market is growing at a CAGR of 6.20% during the forecast period 2022-2030.
The global canned salmon market has been segmented based on product type, source, distribution channel and regions. The sockeye segment led the market in 2022. The farmed canned salmon segment led the market in 2022.
North America region emerged as the largest market for the canned salmon market.
1. Introduction
1.1. Objectives of the Study
1.2. Market Definition
1.3. Research Scope
1.4. Currency
1.5. Key Target Audience
2. Research Methodology and Assumptions
3. Executive Summary
4. Premium Insights
4.1. Porter’s Five Forces Analysis
4.2. Value Chain Analysis
4.3. Top Investment Pockets
4.3.1. Market Attractiveness Analysis by Product Type
4.3.2. Market Attractiveness Analysis by Source
4.3.3. Market Attractiveness Analysis by Distribution Channel
4.3.4. Market Attractiveness Analysis by Region
4.4. Industry Trends
5. Market Dynamics
5.1. Market Evaluation
5.2. Drivers
5.2.1. Canned salmon are excellent source of proteins to propel market growth
5.3. Restraints
5.3.1. Increased amounts of sodium to restrict the market
5.4. Opportunities
5.4.1. Technological advancement to maintain sustainability
5.5. Challenges
5.5.1. Curd & adhesion associated with canned salmon
6. Global Canned Salmon Market Analysis and Forecast, By Product Type:
6.1. Segment Overview
6.2. Chum salmon
6.3. Sockeye Salmon
6.4. Coho Salmon
6.5. Pink Salmon
7. Global Canned Salmon Market Analysis and Forecast, By Source
7.1. Segment Overview
7.2. Farmed Canned Salmon
7.3. Wild Canned Salmon
8. Global Canned Salmon Market Analysis and Forecast, By Distribution Channel
8.1. Segment Overview
8.2. Specialty Stores
8.3. Online Channels
8.4. Hypermarket/Supermarket
8.5. Others
9. Global Canned Salmon Market Analysis and Forecast, By Regional Analysis
9.1. Segment Overview
9.2. North America
9.2.1. U.S.
9.2.2. Canada
9.2.3. Mexico
9.3. Europe
9.3.1. Germany
9.3.2. France
9.3.3. U.K.
9.3.4. Italy
9.3.5. Spain
9.4. Asia-Pacific
9.4.1. Japan
9.4.2. China
9.4.3. India
9.5. South America
9.5.1. Brazil
9.6. Middle East and Africa
9.6.1. UAE
9.6.2. South Africa
10. Global Canned Salmon Market-Competitive Landscape
10.1. Overview
10.2. Market Share of Key Players in the Canned Salmon Market
10.2.1. Global Company Market Share
10.2.2. North America Company Market Share
10.2.3. Europe Company Market Share
10.2.4. APAC Company Market Share
10.3. Competitive Situations and Trends
10.3.1. Product Launches and Developments
10.3.2. Partnerships, Collaborations, and Agreements
10.3.3. Mergers & Acquisitions
10.3.4. Expansions
11. Company Profiles
11.1. Bumble Bee Seafoods L.L.C
11.1.1. Business Overview
11.1.2. Company Snapshot
11.1.3. Company Market Share Analysis
11.1.4. Company Product Portfolio
11.1.5. Recent Developments
11.1.6. SWOT Analysis
11.2. Canada Fishing Company (Canfisco)
11.2.1. Business Overview
11.2.2. Company Snapshot
11.2.3. Company Market Share Analysis
11.2.4. Company Product Portfolio
11.2.5. Recent Developments
11.2.6. SWOT Analysis
11.3. Freedom Foods Group Limited
11.3.1. Business Overview
11.3.2. Company Snapshot
11.3.3. Company Market Share Analysis
11.3.4. Company Product Portfolio
11.3.5. Recent Developments
11.3.6. SWOT Analysis
11.4. Maruha Nichiro Corporation
11.4.1. Business Overview
11.4.2. Company Snapshot
11.4.3. Company Market Share Analysis
11.4.4. Company Product Portfolio
11.4.5. Recent Developments
11.4.6. SWOT Analysis
11.5. Pataya Food Industries
11.5.1. Business Overview
11.5.2. Company Snapshot
11.5.3. Company Market Share Analysis
11.5.4. Company Product Portfolio
11.5.5. Recent Developments
11.5.6. SWOT Analysis
11.6. Peter Pan Seafoods
11.6.1. Business Overview
11.6.2. Company Snapshot
11.6.3. Company Market Share Analysis
11.6.4. Company Product Portfolio
11.6.5. Recent Developments
11.6.6. SWOT Analysis
11.7. Princes Group Limited
11.7.1. Business Overview
11.7.2. Company Snapshot
11.7.3. Company Market Share Analysis
11.7.4. Company Product Portfolio
11.7.5. Recent Developments
11.7.6. SWOT Analysis
11.8. Safcol Co-op Limited.
11.8.1. Business Overview
11.8.2. Company Snapshot
11.8.3. Company Market Share Analysis
11.8.4. Company Product Portfolio
11.8.5. Recent Developments
11.8.6. SWOT Analysis
11.9. Tassal Group Limited
11.9.1. Business Overview
11.9.2. Company Snapshot
11.9.3. Company Market Share Analysis
11.9.4. Company Product Portfolio
11.9.5. Recent Developments
11.9.6. SWOT Analysis
11.10. Thai Union Group Public Company Limited
11.10.1. Business Overview
11.10.2. Company Snapshot
11.10.3. Company Market Share Analysis
11.10.4. Company Product Portfolio
11.10.5. Recent Developments
11.10.6. SWOT Analysis
List of Table
1. Global Canned Salmon Market, By Product Type, 2019-2030 (USD Billion)
2. Global Chum salmon Canned Salmon Market, By Region, 2019-2030 (USD Billion)
3. Global Sockeye Salmon Canned Salmon Market, By Region, 2019-2030 (USD Billion)
4. Global Coho Salmon Canned Salmon Market, By Region, 2019-2030 (USD Billion)
5. Global Canned Salmon Market, By Source, 2019-2030 (USD Billion)
6. Global Farmed Canned Salmon Canned Salmon Market, By Region, 2019-2030 (USD Billion)
7. Global Wild Canned Salmon Canned Salmon Market, By Region, 2019-2030 (USD Billion)
8. Global Canned Salmon Market, By Distribution Channel, 2019-2030 (USD Billion)
9. Global Specialty Stores Canned Salmon Market, By Region, 2019-2030 (USD Billion)
10. Global Online Channels Canned Salmon Market, By Region, 2019-2030 (USD Billion)
11. Global Hypermarket/Supermarket Canned Salmon Market, By Region, 2019-2030 (USD Billion)
12. Global Others Canned Salmon Market, By Region, 2019-2030 (USD Billion)
13. North America Canned Salmon Market, By Product Type, 2019-2030 (USD Billion)
14. North America Canned Salmon Market, By Source, 2019-2030 (USD Billion)
15. North America Canned Salmon Market, By Distribution Channel, 2019-2030 (USD Billion)
16. U.S. Canned Salmon Market, By Product Type, 2019-2030 (USD Billion)
17. U.S. Canned Salmon Market, By Source, 2019-2030 (USD Billion)
18. U.S. Canned Salmon Market, By Distribution Channel, 2019-2030 (USD Billion)
19. Canada Canned Salmon Market, By Product Type, 2019-2030 (USD Billion)
20. Canada Canned Salmon Market, By Source, 2019-2030 (USD Billion)
21. Canada Canned Salmon Market, By Distribution Channel, 2019-2030 (USD Billion)
22. Mexico Canned Salmon Market, By Product Source, 2019-2030 (USD Billion)
23. Mexico Canned Salmon Market, By Source, 2019-2030 (USD Billion)
24. Mexico Canned Salmon Market, By Distribution Channel, 2019-2030 (USD Billion)
25. Europe Canned Salmon Market, By Product Type, 2019-2030 (USD Billion)
26. Europe Canned Salmon Market, By Source, 2019-2030 (USD Billion)
27. Europe Canned Salmon Market, By Distribution Channel, 2019-2030 (USD Billion)
28. Germany Canned Salmon Market, By Product Type, 2019-2030 (USD Billion)
29. Germany Canned Salmon Market, By Source, 2019-2030 (USD Billion)
30. Germany Canned Salmon Market, By Distribution Channel, 2019-2030 (USD Billion)
31. France Canned Salmon Market, By Product Type 2019-2030 (USD Billion)
32. France Canned Salmon Market, By Source, 2019-2030 (USD Billion)
33. France Canned Salmon Market, By Distribution Channel, 2019-2030 (USD Billion)
34. U.K. Canned Salmon Market, By Product Type, 2019-2030 (USD Billion)
35. U.K. Canned Salmon Market, By Source, 2019-2030 (USD Billion)
36. U.K. Canned Salmon Market, By Distribution Channel, 2019-2030 (USD Billion)
37. Italy Canned Salmon Market, By Product Type, 2019-2030 (USD Billion)
38. Italy Canned Salmon Market, By Source, 2019-2030 (USD Billion)
39. Italy Canned Salmon Market, By Distribution Channel, 2019-2030 (USD Billion)
40. Spain Canned Salmon Market, By Product Type, 2019-2030 (USD Billion)
41. Spain Canned Salmon Market, By Source, 2019-2030 (USD Billion)
42. Spain Canned Salmon Market, By Distribution Channel, 2019-2030 (USD Billion)
43. Asia Pacific Canned Salmon Market, By Product Type, 2019-2030 (USD Billion)
44. Asia Pacific Canned Salmon Market, By Source, 2019-2030 (USD Billion)
45. Asia Pacific Canned Salmon Market, By Distribution Channel, 2019-2030 (USD Billion)
46. Japan Canned Salmon Market, By Product Type, 2019-2030 (USD Billion)
47. Japan Canned Salmon Market, By Source, 2019-2030 (USD Billion)
48. Japan Canned Salmon Market, By Distribution Channel, 2019-2030 (USD Billion)
49. China Canned Salmon Market, By Product Type 2019-2030 (USD Billion)
50. China Canned Salmon Market, By Source, 2019-2030 (USD Billion)
51. China Canned Salmon Market, By Distribution Channel, 2019-2030 (USD Billion)
52. India Canned Salmon Market, By Product Type 2019-2030 (USD Billion)
53. India Canned Salmon Market, By Source, 2019-2030 (USD Billion)
54. India Canned Salmon Market, By Distribution Channel, 2019-2030 (USD Billion)
55. South America Canned Salmon Market, By Product Type, 2019-2030 (USD Billion)
56. South America Canned Salmon Market, By Source, 2019-2030 (USD Billion)
57. South America Canned Salmon Market, By Distribution Channel, 2019-2030 (USD Billion)
58. Brazil Canned Salmon Market, By Product Source 2019-2030 (USD Billion)
59. Brazil Canned Salmon Market, By Source, 2019-2030 (USD Billion)
60. Brazil Canned Salmon Market, By Distribution Channel, 2019-2030 (USD Billion)
61. Middle East and Africa Canned Salmon Market, By Product Type, 2019-2030 (USD Billion)
62. Middle East and Africa Canned Salmon Market, By Source, 2019-2030 (USD Billion)
63. Middle East and Africa Canned Salmon Market, By Distribution Channel, 2019-2030 (USD Billion)
64. UAE Canned Salmon Market, By Product Type, 2019-2030 (USD Billion)
65. UAE Canned Salmon Market, By Source, 2019-2030 (USD Billion)
66. UAE Canned Salmon Market, By Distribution Channel, 2019-2030 (USD Billion)
67. South Africa Canned Salmon Market, By Product Type 2019-2030 (USD Billion)
68. South Africa Canned Salmon Market, By Source, 2019-2030 (USD Billion)
69. South Africa Canned Salmon Market, By Distribution Channel, 2019-2030 (USD Billion)
List of Figures
1. Global Canned Salmon Market Segmentation
2. Canned Salmon Market: Research Methodology
3. Market Size Estimation Methodology: Bottom-Up Approach
4. Market Size Estimation Methodology: Top-Down Approach
5. Data Triangulation
6. Porter’s Five Forces Analysis
7. Value Chain Analysis
8. Global Canned Salmon Market Attractiveness Analysis by Product Type
9. Global Canned Salmon Market Attractiveness Analysis by Source
10. Global Canned Salmon Market Attractiveness Analysis by Distribution Channel
11. Global Canned Salmon Market Attractiveness Analysis by Region
12. Global Canned Salmon Market: Dynamics
13. Global Canned Salmon Market Share by Product Type (2022 & 2030)
14. Global Canned Salmon Market Share by Source (2022 & 2030)
15. Global Canned Salmon Market Share by Distribution Channel (2022 & 2030)
16. Global Canned Salmon Market Share by Regions (2022 & 2030)
17. Global Canned Salmon Market Share by Company (2021)
This study forecasts revenue at global, regional, and country levels from 2019 to 2030. The Brainy Insights has segmented the global canned salmon market based on below mentioned segments:
Global Canned Salmon Market by Product Type:
Global Canned Salmon Market by Source:
Global Canned Salmon Market by Distribution Channel:
Global Canned Salmon Market by Region:
Research has its special purpose to undertake marketing efficiently. In this competitive scenario, businesses need information across all industry verticals; the information about customer wants, market demand, competition, industry trends, distribution channels etc. This information needs to be updated regularly because businesses operate in a dynamic environment. Our organization, The Brainy Insights incorporates scientific and systematic research procedures in order to get proper market insights and industry analysis for overall business success. The analysis consists of studying the market from a miniscule level wherein we implement statistical tools which helps us in examining the data with accuracy and precision.
Our research reports feature both; quantitative and qualitative aspects for any market. Qualitative information for any market research process are fundamental because they reveal the customer needs and wants, usage and consumption for any product/service related to a specific industry. This in turn aids the marketers/investors in knowing certain perceptions of the customers. Qualitative research can enlighten about the different product concepts and designs along with unique service offering that in turn, helps define marketing problems and generate opportunities. On the other hand, quantitative research engages with the data collection process through interviews, e-mail interactions, surveys and pilot studies. Quantitative aspects for the market research are useful to validate the hypotheses generated during qualitative research method, explore empirical patterns in the data with the help of statistical tools, and finally make the market estimations.
The Brainy Insights offers comprehensive research and analysis, based on a wide assortment of factual insights gained through interviews with CXOs and global experts and secondary data from reliable sources. Our analysts and industry specialist assume vital roles in building up statistical tools and analysis models, which are used to analyse the data and arrive at accurate insights with exceedingly informative research discoveries. The data provided by our organization have proven precious to a diverse range of companies, facilitating them to address issues such as determining which products/services are the most appealing, whether or not customers use the product in the manner anticipated, the purchasing intentions of the market and many others.
Our research methodology encompasses an idyllic combination of primary and secondary initiatives. Key phases involved in this process are listed below:

The phase involves the gathering and collecting of market data and its related information with the help of different sources & research procedures.

The data procurement stage involves in data gathering and collecting through various data sources.
This stage involves in extensive research. These data sources includes:
Purchased Database: Purchased databases play a crucial role in estimating the market sizes irrespective of the domain. Our purchased database includes:
Primary Research: The Brainy Insights interacts with leading companies and experts of the concerned domain to develop the analyst team’s market understanding and expertise. It improves and substantiates every single data presented in the market reports. Primary research mainly involves in telephonic interviews, E-mail interactions and face-to-face interviews with the raw material providers, manufacturers/producers, distributors, & independent consultants. The interviews that we conduct provides valuable data on market size and industry growth trends prevailing in the market. Our organization also conducts surveys with the various industry experts in order to gain overall insights of the industry/market. For instance, in healthcare industry we conduct surveys with the pharmacists, doctors, surgeons and nurses in order to gain insights and key information of a medical product/device/equipment which the customers are going to usage. Surveys are conducted in the form of questionnaire designed by our own analyst team. Surveys plays an important role in primary research because surveys helps us to identify the key target audiences of the market. Additionally, surveys helps to identify the key target audience engaged with the market. Our survey team conducts the survey by targeting the key audience, thus gaining insights from them. Based on the perspectives of the customers, this information is utilized to formulate market strategies. Moreover, market surveys helps us to understand the current competitive situation of the industry. To be precise, our survey process typically involve with the 360 analysis of the market. This analytical process begins by identifying the prospective customers for a product or service related to the market/industry to obtain data on how a product/service could fit into customers’ lives.

Secondary Research: The secondary data sources includes information published by the on-profit organizations such as World bank, WHO, company fillings, investor presentations, annual reports, national government documents, statistical databases, blogs, articles, white papers and others. From the annual report, we analyse a company’s revenue to understand the key segment and market share of that organization in a particular region. We analyse the company websites and adopt the product mapping technique which is important for deriving the segment revenue. In the product mapping method, we select and categorize the products offered by the companies catering to domain specific market, deduce the product revenue for each of the companies so as to get overall estimation of the market size. We also source data and analyses trends based on information received from supply side and demand side intermediaries in the value chain. The supply side denotes the data gathered from supplier, distributor, wholesaler and the demand side illustrates the data gathered from the end customers for respective market domain.

The supply side for a domain specific market is analysed by:
The demand side for the market is estimated through:
In-house Library: Apart from these third-party sources, we have our in-house library of qualitative and quantitative information. Our in-house database includes market data for various industry and domains. These data are updated on regular basis as per the changing market scenario. Our library includes, historic databases, internal audit reports and archives.
Sometimes there are instances where there is no metadata or raw data available for any domain specific market. For those cases, we use our expertise to forecast and estimate the market size in order to generate comprehensive data sets. Our analyst team adopt a robust research technique in order to produce the estimates:
Data Synthesis: This stage involves the analysis & mapping of all the information obtained from the previous step. It also involves in scrutinizing the data for any discrepancy observed while data gathering related to the market. The data is collected with consideration to the heterogeneity of sources. Robust scientific techniques are in place for synthesizing disparate data sets and provide the essential contextual information that can orient market strategies. The Brainy Insights has extensive experience in data synthesis where the data passes through various stages:


Market Deduction & Formulation: The final stage comprises of assigning data points at appropriate market spaces so as to deduce feasible conclusions. Analyst perspective & subject matter expert based holistic form of market sizing coupled with industry analysis also plays a crucial role in this stage.
This stage involves in finalization of the market size and numbers that we have collected from data integration step. With data interpolation, it is made sure that there is no gap in the market data. Successful trend analysis is done by our analysts using extrapolation techniques, which provide the best possible forecasts for the market.
Data Validation & Market Feedback: Validation is the most important step in the process. Validation & re-validation via an intricately designed process helps us finalize data-points to be used for final calculations.

The Brainy Insights interacts with leading companies and experts of the concerned domain to develop the analyst team’s market understanding and expertise. It improves and substantiates every single data presented in the market reports. The data validation interview and discussion panels are typically composed of the most experienced industry members. The participants include, however, are not limited to:
Moreover, we always validate our data and findings through primary respondents from all the major regions we are working on.


Free Customization
Fortune 500 Clients
Free Yearly Update On Purchase Of Multi/Corporate License
Companies Served Till Date