- +1-315-215-1633
- sales@thebrainyinsights.com

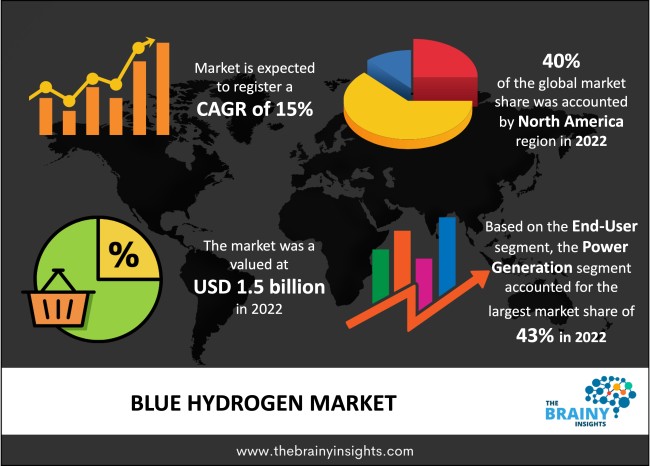
The global blue hydrogen market is expected to reach USD 6.0 billion by 2032, at a CAGR of 15% during the forecast period 2023 to 2032. Asia Pacific is expected to grow the fastest during the forecast period.
Blue hydrogen is produced from natural gas and backed by carbon capture and storage. The CO2 produced during the production process is caught and permanently stored. As a result, low-carbon hydrogen is produced that emits no CO2. Hydrogen is produced using various technologies, including steam methane reforming, partial oil oxidation, coal gasification, and auto-thermal reforming. Most hydrogen produced today is used in petroleum refineries and fertilizer manufacturing. Approximately 99% of it comes from fossil fuel reformation, which has shown to be the most cost-effective approach. Yet, this has no meaningful climate advantages because CO2 is emitted throughout the process. Hydrogen has many applications, including industrial feedstock, fuel cell vehicles, and energy storage. The presence of government measures to create the hydrogen economy will benefit the market. The UK government unveiled a national bus plan that includes a $3.7 billion investment in the public transportation industry across England and establishment of two funds totalling more than $22 million each for hydrogen supply and storage innovation. In addition, the government committed a $185 million investment to decarbonize industrial clusters. Furthermore, investigate the viability of hydrogen for buildings and the incorporation of up to 20% hydrogen into its natural gas network. These efforts in the UK will drive the expansion of the blue hydrogen market.
Get an overview of this study by requesting a free sample
Rise of Fuel Cell Vehicles- The increased usage of hydrogen in fuel cell vehicles is projected to drive the blue hydrogen market in the near future. Fuel cells offer environmentally friendly transportation and can be used as an alternative to fossil fuels. This increasing demand for blue hydrogen in fuel cell vehicles will drive the market's growth.
Leakage of Methane Gas- The presence of methane, a greenhouse gas, in natural gas significantly hinders market profit growth, as methane leaks during blue hydrogen synthesis contribute to global warming. Furthermore, utilizing natural gas to generate the significant energy required to manufacture blue hydrogen produces carbon dioxide emissions and limits the blue hydrogen market's revenue development.
Increasing Industrialization- Increasing industrialization and globalization are key drivers of the blue hydrogen market. One of the essential end-user industries for hydrogen is chemistry. More than two-thirds of the world's hydrogen production is used mainly in the chemical industry for ammonia and methanol synthesis.
Methane Leakage- Due to methane leakage, the market will face challenges. As methane harms people, it can be a significant drawback of the blue hydrogen market.
The regions analyzed for the market include North America, Europe, South America, Asia Pacific, the Middle East, and Africa. North America emerged as the most significant global blue hydrogen market, with a 40% market revenue share in 2022.
North America dominates the blue hydrogen market with a 40% market revenue share in 2022. In December 2020, Canada presented its first hydrogen strategy report, including national and provincial strategies. According to projections, clean hydrogen might provide roughly 30% of the country's end-use energy by 2050. In the United States, California is tightening its restrictions to assist in cutting carbon emissions by 2030 and supports using low-carbon hydrogen credits. By 2030, the California Fuel Cell Partnership hopes to have 1,000 hydrogen refuelling stations and one million FCEVs. The initiatives mentioned above will be important factors driving market expansion in this area throughout the forecast period.
Asia Pacific is expected to witness the fastest growth during the forecast period because of rising hydrogen demand in end-use sectors such as fertilizers, chemicals, and refineries in nations such as India, China, and South Korea. China consumes and produces the most hydrogen in any country. China's current yearly hydrogen consumption surpasses 24 million tonnes.
North America Region Blue Hydrogen Market Share in 2022 - 40%
www.thebrainyinsights.com
Check the geographical analysis of this market by requesting a free sample
The technology segment is divided into steam methane reforming, auto thermal reforming, and gas partial oxidation. The steam methane reforming segment dominated the market, with a market share of around 40% in 2022. The steam methane reforming segment dominates the global blue hydrogen market. Steam methane reforming is a method of obtaining hydrogen from natural gas (methane). This approach is one of the least expensive ways to obtain industrial hydrogen. This method involves heating gases such as methane in the presence of steam and a catalyst to produce an endothermic reaction that breaks the methane molecule into carbon monoxide and hydrogen. Steam methane reforming is a low-cost, energy-efficient method of producing high levels of pure hydrogen, which may be collected using in-house pressure swing adsorption purification technology. This will likely promote adoption and drive market growth throughout the forecast period.
The end-user segment is divided into power generation, refinery, chemical, and others. The power generation segment dominated the market, with a share of around 43% in 2022. 96% of the world's hydrogen is created from fossil fuels such as coal, oil, and natural gas using a technique known as reforming, which involves combining fossil fuels with steam to heat them to around 800 ° C. By mixing hydrogen and oxygen atoms, hydrogen fuel cells generate energy. Hydrogen combines with oxygen during an electrochemical reaction comparable to a battery, producing electricity, water, and a tiny quantity of heat. However, unlike fossil fuels, hydrogen fuel cells do not generate greenhouse gases during manufacturing, which is likely to drive demand for blue hydrogen in power generation and revenue development in this market.
| Attribute | Description |
|---|---|
| Market Size | Revenue (USD Billion) |
| Market size value in 2022 | USD 1.5 billion |
| Market size value in 2032 | USD 6.0 billion |
| CAGR (2023 to 2032) | 15% |
| Historical data | 2019-2021 |
| Base Year | 2022 |
| Forecast | 2023-2032 |
| Regional Segments | North America, Asia Pacific, Europe, Latin America, Middle East and Africa |
| Segments | Technology, End-User |
As per The Brainy Insights, the size of the blue hydrogen market was valued at USD 1.5 billion in 2022 to USD 6.0 billion by 2032.
The global blue hydrogen market is growing at a CAGR of 15% during the forecast period 2023-2032.
North America emerged as the largest blue hydrogen market.
1. Introduction
1.1. Objectives of the Study
1.2. Market Definition
1.3. Research Scope
1.4. Currency
1.5. Key Target Audience
2. Research Methodology and Assumptions
3. Executive Summary
4. Premium Insights
4.1. Porter’s Five Forces Analysis
4.2. Value Chain Analysis
4.3. Top Investment Pockets
4.3.1. Market Attractiveness Analysis by Technology
4.3.2. Market Attractiveness Analysis by End-User
4.3.3. Market Attractiveness Analysis by Region
4.4. Industry Trends
5. Market Dynamics
5.1. Market Evaluation
5.2. Drivers
5.2.1. Rise of Fuel Cell Vehicles
5.3. Restraints
5.3.1. Leakage of Methane Gas
5.4. Opportunities
5.4.1. Increasing Industrialization
5.5. Challenges
5.5.1. Methane Leakage
6. Global Blue Hydrogen Market Analysis and Forecast, By Technology
6.1. Segment Overview
6.2. Steam Methane Reforming
6.3. Auto Thermal Reforming
6.4. Gas Partial Oxidation
7. Global Blue Hydrogen Market Analysis and Forecast, By End-User
7.1. Segment Overview
7.2. Power Generation
7.3. Refinery
7.4. Chemical
7.5. Others
8. Global Blue Hydrogen Market Analysis and Forecast, By Regional Analysis
8.1. Segment Overview
8.2. North America
8.2.1. U.S.
8.2.2. Canada
8.2.3. Mexico
8.3. Europe
8.3.1. Germany
8.3.2. France
8.3.3. U.K.
8.3.4. Italy
8.3.5. Spain
8.4. Asia-Pacific
8.4.1. Japan
8.4.2. China
8.4.3. India
8.5. South America
8.5.1. Brazil
8.6. Middle East and Africa
8.6.1. UAE
8.6.2. South Africa
9. Global Blue Hydrogen Market-Competitive Landscape
9.1. Overview
9.2. Market Share of Key Players in Global Blue Hydrogen Market
9.2.1. Global Company Market Share
9.2.2. North America Company Market Share
9.2.3. Europe Company Market Share
9.2.4. APAC Company Market Share
9.3. Competitive Situations and Trends
9.3.1. Product Launches and Developments
9.3.2. Partnerships, Collaborations, and Agreements
9.3.3. Mergers & Acquisitions
9.3.4. Expansions
10. Company Profiles
10.1. ATCO Ltd.
10.1.1. Business Overview
10.1.2. Company Snapshot
10.1.3. Company Market Share Analysis
10.1.4. Company Product Portfolio
10.1.5. Recent Developments
10.1.6. SWOT Analysis
10.2. Suncor Energy Inc.
10.2.1. Business Overview
10.2.2. Company Snapshot
10.2.3. Company Market Share Analysis
10.2.4. Company Product Portfolio
10.2.5. Recent Developments
10.2.6. SWOT Analysis
10.3. Linde plc
10.3.1. Business Overview
10.3.2. Company Snapshot
10.3.3. Company Market Share Analysis
10.3.4. Company Product Portfolio
10.3.5. Recent Developments
10.3.6. SWOT Analysis
10.4. Redwood Materials, Inc.
10.4.1. Business Overview
10.4.2. Company Snapshot
10.4.3. Company Market Share Analysis
10.4.4. Company Product Portfolio
10.4.5. Recent Developments
10.4.6. SWOT Analysis
10.5. Saudi Aramco
10.5.1. Business Overview
10.5.2. Company Snapshot
10.5.3. Company Market Share Analysis
10.5.4. Company Product Portfolio
10.5.5. Recent Developments
10.5.6. SWOT Analysis
10.6. Toshibha Energy Systems & Solutions Corp.
10.6.1. Business Overview
10.6.2. Company Snapshot
10.6.3. Company Market Share Analysis
10.6.4. Company Product Portfolio
10.6.5. Recent Developments
10.6.6. SWOT Analysis
10.7. Air Products Inc.
10.7.1. Business Overview
10.7.2. Company Snapshot
10.7.3. Company Market Share Analysis
10.7.4. Company Product Portfolio
10.7.5. Recent Developments
10.7.6. SWOT Analysis
10.8. Uniper SE
10.8.1. Business Overview
10.8.2. Company Snapshot
10.8.3. Company Market Share Analysis
10.8.4. Company Product Portfolio
10.8.5. Recent Developments
10.8.6. SWOT Analysis
10.9. Cummins Inc.
10.9.1. Business Overview
10.9.2. Company Snapshot
10.9.3. Company Market Share Analysis
10.9.4. Company Product Portfolio
10.9.5. Recent Developments
10.9.6. SWOT Analysis
10.10. Siemens AG
10.10.1. Business Overview
10.10.2. Company Snapshot
10.10.3. Company Market Share Analysis
10.10.4. Company Product Portfolio
10.10.5. Recent Developments
10.10.6. SWOT Analysis
10.11. Equinor ASA
10.11.1. Business Overview
10.11.2. Company Snapshot
10.11.3. Company Market Share Analysis
10.11.4. Company Product Portfolio
10.11.5. Recent Developments
10.11.6. SWOT Analysis
10.12. CertifHy Canada Inc.
10.12.1. Business Overview
10.12.2. Company Snapshot
10.12.3. Company Market Share Analysis
10.12.4. Company Product Portfolio
10.12.5. Recent Developments
10.12.6. SWOT Analysis
10.13. Xebec Adsorption Inc.
10.13.1. Business Overview
10.13.2. Company Snapshot
10.13.3. Company Market Share Analysis
10.13.4. Company Product Portfolio
10.13.5. Recent Developments
10.13.6. SWOT Analysis
10.14. Reliance Industries Ltd
10.14.1. Business Overview
10.14.2. Company Snapshot
10.14.3. Company Market Share Analysis
10.14.4. Company Product Portfolio
10.14.5. Recent Developments
10.14.6. SWOT Analysis
10.15. AIR LIQUIDE S.A.
10.15.1. Business Overview
10.15.2. Company Snapshot
10.15.3. Company Market Share Analysis
10.15.4. Company Product Portfolio
10.15.5. Recent Developments
10.15.6. SWOT Analysis
List of Table
1. Global Blue Hydrogen Market, By Technology, 2019-2032 (USD Billion)
2. Global Steam Methane Reforming, Blue Hydrogen Market, By Region, 2019-2032 (USD Billion)
3. Global Auto Thermal Reforming, Blue Hydrogen Market, By Region, 2019-2032 (USD Billion)
4. Global Gas Partial Oxidation, Blue Hydrogen Market, By Region, 2019-2032 (USD Billion)
5. Global Blue Hydrogen Market, By End-User, 2019-2032 (USD Billion)
6. Global Power Generation, Blue Hydrogen Market, By Region, 2019-2032 (USD Billion)
7. Global Refinery, Blue Hydrogen Market, By Region, 2019-2032 (USD Billion)
8. Global Chemical, Blue Hydrogen Market, By Region, 2019-2032 (USD Billion)
9. Global Others, Blue Hydrogen Market, By Region, 2019-2032 (USD Billion)
10. North America Blue Hydrogen Market, By Technology, 2019-2032 (USD Billion)
11. North America Blue Hydrogen Market, By End-User, 2019-2032 (USD Billion)
12. U.S. Blue Hydrogen Market, By Technology, 2019-2032 (USD Billion)
13. U.S. Blue Hydrogen Market, By End-User, 2019-2032 (USD Billion)
14. Canada Blue Hydrogen Market, By Technology, 2019-2032 (USD Billion)
15. Canada Blue Hydrogen Market, By End-User, 2019-2032 (USD Billion)
16. Mexico Blue Hydrogen Market, By Technology, 2019-2032 (USD Billion)
17. Mexico Blue Hydrogen Market, By End-User, 2019-2032 (USD Billion)
18. Europe Blue Hydrogen Market, By Technology, 2019-2032 (USD Billion)
19. Europe Blue Hydrogen Market, By End-User, 2019-2032 (USD Billion)
20. Germany Blue Hydrogen Market, By Technology, 2019-2032 (USD Billion)
21. Germany Blue Hydrogen Market, By End-User, 2019-2032 (USD Billion)
22. France Blue Hydrogen Market, By Technology, 2019-2032 (USD Billion)
23. France Blue Hydrogen Market, By End-User, 2019-2032 (USD Billion)
24. U.K. Blue Hydrogen Market, By Technology, 2019-2032 (USD Billion)
25. U.K. Blue Hydrogen Market, By End-User, 2019-2032 (USD Billion)
26. Italy Blue Hydrogen Market, By Technology, 2019-2032 (USD Billion)
27. Italy Blue Hydrogen Market, By End-User, 2019-2032 (USD Billion)
28. Spain Blue Hydrogen Market, By Technology, 2019-2032 (USD Billion)
29. Spain Blue Hydrogen Market, By End-User, 2019-2032 (USD Billion)
30. Asia Pacific Blue Hydrogen Market, By Technology, 2019-2032 (USD Billion)
31. Asia Pacific Blue Hydrogen Market, By End-User, 2019-2032 (USD Billion)
32. Japan Blue Hydrogen Market, By Technology, 2019-2032 (USD Billion)
33. Japan Blue Hydrogen Market, By End-User, 2019-2032 (USD Billion)
34. China Blue Hydrogen Market, By Technology, 2019-2032 (USD Billion)
35. China Blue Hydrogen Market, By End-User, 2019-2032 (USD Billion)
36. India Blue Hydrogen Market, By Technology, 2019-2032 (USD Billion)
37. India Blue Hydrogen Market, By End-User, 2019-2032 (USD Billion)
38. South America Blue Hydrogen Market, By Technology, 2019-2032 (USD Billion)
39. South America Blue Hydrogen Market, By End-User, 2019-2032 (USD Billion)
40. Brazil Blue Hydrogen Market, By Technology, 2019-2032 (USD Billion)
41. Brazil Blue Hydrogen Market, By End-User, 2019-2032 (USD Billion)
42. Middle East and Africa Blue Hydrogen Market, By Technology, 2019-2032 (USD Billion)
43. Middle East and Africa Blue Hydrogen Market, By End-User, 2019-2032 (USD Billion)
44. UAE Blue Hydrogen Market, By Technology, 2019-2032 (USD Billion)
45. UAE Blue Hydrogen Market, By End-User, 2019-2032 (USD Billion)
46. South Africa Blue Hydrogen Market, By Technology, 2019-2032 (USD Billion)
47. South Africa Blue Hydrogen Market, By End-User, 2019-2032 (USD Billion)
List of Figures
1. Global Blue Hydrogen Market Segmentation
2. Global Blue Hydrogen Market: Research Methodology
3. Market Size Estimation Methodology: Bottom-Up Approach
4. Market Size Estimation Methodology: Top-Down Approach
5. Data Triangulation
6. Porter’s Five Forces Analysis
7. Value Chain Analysis
8. Global Blue Hydrogen Market Attractiveness Analysis by Technology
9. Global Blue Hydrogen Market Attractiveness Analysis by End-User
10. Global Blue Hydrogen Market Attractiveness Analysis by Region
11. Global Blue Hydrogen Market: Dynamics
12. Global Blue Hydrogen Market Share by Technology (2023 & 2032)
13. Global Blue Hydrogen Market Share by End-User (2023 & 2032)
14. Global Blue Hydrogen Market Share by Regions (2023 & 2032)
15. Global Blue Hydrogen Market Share by Company (2022)
This study forecasts global, regional, and country revenue from 2019 to 2032. The Brainy Insights has segmented the global blue hydrogen market based on the below-mentioned segments:
Global Blue Hydrogen Market By Technology:
Global Blue Hydrogen Market By End-User:
Global Blue Hydrogen Market By Region:
Research has its special purpose to undertake marketing efficiently. In this competitive scenario, businesses need information across all industry verticals; the information about customer wants, market demand, competition, industry trends, distribution channels etc. This information needs to be updated regularly because businesses operate in a dynamic environment. Our organization, The Brainy Insights incorporates scientific and systematic research procedures in order to get proper market insights and industry analysis for overall business success. The analysis consists of studying the market from a miniscule level wherein we implement statistical tools which helps us in examining the data with accuracy and precision.
Our research reports feature both; quantitative and qualitative aspects for any market. Qualitative information for any market research process are fundamental because they reveal the customer needs and wants, usage and consumption for any product/service related to a specific industry. This in turn aids the marketers/investors in knowing certain perceptions of the customers. Qualitative research can enlighten about the different product concepts and designs along with unique service offering that in turn, helps define marketing problems and generate opportunities. On the other hand, quantitative research engages with the data collection process through interviews, e-mail interactions, surveys and pilot studies. Quantitative aspects for the market research are useful to validate the hypotheses generated during qualitative research method, explore empirical patterns in the data with the help of statistical tools, and finally make the market estimations.
The Brainy Insights offers comprehensive research and analysis, based on a wide assortment of factual insights gained through interviews with CXOs and global experts and secondary data from reliable sources. Our analysts and industry specialist assume vital roles in building up statistical tools and analysis models, which are used to analyse the data and arrive at accurate insights with exceedingly informative research discoveries. The data provided by our organization have proven precious to a diverse range of companies, facilitating them to address issues such as determining which products/services are the most appealing, whether or not customers use the product in the manner anticipated, the purchasing intentions of the market and many others.
Our research methodology encompasses an idyllic combination of primary and secondary initiatives. Key phases involved in this process are listed below:

The phase involves the gathering and collecting of market data and its related information with the help of different sources & research procedures.

The data procurement stage involves in data gathering and collecting through various data sources.
This stage involves in extensive research. These data sources includes:
Purchased Database: Purchased databases play a crucial role in estimating the market sizes irrespective of the domain. Our purchased database includes:
Primary Research: The Brainy Insights interacts with leading companies and experts of the concerned domain to develop the analyst team’s market understanding and expertise. It improves and substantiates every single data presented in the market reports. Primary research mainly involves in telephonic interviews, E-mail interactions and face-to-face interviews with the raw material providers, manufacturers/producers, distributors, & independent consultants. The interviews that we conduct provides valuable data on market size and industry growth trends prevailing in the market. Our organization also conducts surveys with the various industry experts in order to gain overall insights of the industry/market. For instance, in healthcare industry we conduct surveys with the pharmacists, doctors, surgeons and nurses in order to gain insights and key information of a medical product/device/equipment which the customers are going to usage. Surveys are conducted in the form of questionnaire designed by our own analyst team. Surveys plays an important role in primary research because surveys helps us to identify the key target audiences of the market. Additionally, surveys helps to identify the key target audience engaged with the market. Our survey team conducts the survey by targeting the key audience, thus gaining insights from them. Based on the perspectives of the customers, this information is utilized to formulate market strategies. Moreover, market surveys helps us to understand the current competitive situation of the industry. To be precise, our survey process typically involve with the 360 analysis of the market. This analytical process begins by identifying the prospective customers for a product or service related to the market/industry to obtain data on how a product/service could fit into customers’ lives.

Secondary Research: The secondary data sources includes information published by the on-profit organizations such as World bank, WHO, company fillings, investor presentations, annual reports, national government documents, statistical databases, blogs, articles, white papers and others. From the annual report, we analyse a company’s revenue to understand the key segment and market share of that organization in a particular region. We analyse the company websites and adopt the product mapping technique which is important for deriving the segment revenue. In the product mapping method, we select and categorize the products offered by the companies catering to domain specific market, deduce the product revenue for each of the companies so as to get overall estimation of the market size. We also source data and analyses trends based on information received from supply side and demand side intermediaries in the value chain. The supply side denotes the data gathered from supplier, distributor, wholesaler and the demand side illustrates the data gathered from the end customers for respective market domain.

The supply side for a domain specific market is analysed by:
The demand side for the market is estimated through:
In-house Library: Apart from these third-party sources, we have our in-house library of qualitative and quantitative information. Our in-house database includes market data for various industry and domains. These data are updated on regular basis as per the changing market scenario. Our library includes, historic databases, internal audit reports and archives.
Sometimes there are instances where there is no metadata or raw data available for any domain specific market. For those cases, we use our expertise to forecast and estimate the market size in order to generate comprehensive data sets. Our analyst team adopt a robust research technique in order to produce the estimates:
Data Synthesis: This stage involves the analysis & mapping of all the information obtained from the previous step. It also involves in scrutinizing the data for any discrepancy observed while data gathering related to the market. The data is collected with consideration to the heterogeneity of sources. Robust scientific techniques are in place for synthesizing disparate data sets and provide the essential contextual information that can orient market strategies. The Brainy Insights has extensive experience in data synthesis where the data passes through various stages:


Market Deduction & Formulation: The final stage comprises of assigning data points at appropriate market spaces so as to deduce feasible conclusions. Analyst perspective & subject matter expert based holistic form of market sizing coupled with industry analysis also plays a crucial role in this stage.
This stage involves in finalization of the market size and numbers that we have collected from data integration step. With data interpolation, it is made sure that there is no gap in the market data. Successful trend analysis is done by our analysts using extrapolation techniques, which provide the best possible forecasts for the market.
Data Validation & Market Feedback: Validation is the most important step in the process. Validation & re-validation via an intricately designed process helps us finalize data-points to be used for final calculations.

The Brainy Insights interacts with leading companies and experts of the concerned domain to develop the analyst team’s market understanding and expertise. It improves and substantiates every single data presented in the market reports. The data validation interview and discussion panels are typically composed of the most experienced industry members. The participants include, however, are not limited to:
Moreover, we always validate our data and findings through primary respondents from all the major regions we are working on.


Free Customization
Fortune 500 Clients
Free Yearly Update On Purchase Of Multi/Corporate License
Companies Served Till Date