- +1-315-215-1633
- sales@thebrainyinsights.com

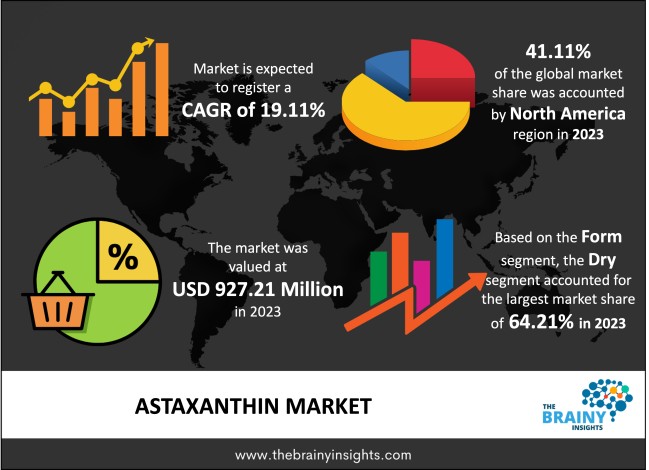
The global astaxanthin market is expected to grow from USD 927.21 Million in 2023 to USD 5,329.18 Million by 2033, at a CAGR of 19.11% during the forecast period 2024-2033. North America dominated the market in 2023.
Red pigment astaxanthin is a member of the class of substances known as carotenoids. It occurs in specific algae and gives salmon its pink-red colour. Moreover, astaxanthin may enhance immune system performance. People use astaxanthin for various conditions, including post-workout muscular soreness, poor athletic performance, Alzheimer's disease, ageing skin, etc. Moreover, rheumatoid arthritis affects roughly one in five Americans, and carpal tunnel syndrome may benefit from using astaxanthin. There have been a lot of studies on how astaxanthin might aid in treating different tumours because of its antioxidant characteristics. Although chemical synthesis has historically been used to produce this pigment for commercial use, the microalga Haematococcus pluvialis looks to be the most viable source for its industrial biological production.
Get an overview of this study by requesting a free sample
Increasing use of astaxanthin: Aquaculture, humans and livestock can all consume astaxanthin as a nutritional supplement. Astaxanthin derived from bacterial, synthetic, and algae sources is safe in the United States. Due to its antioxidant, colouring, and health-promoting qualities, astaxanthin has been used extensively in feed additives and the medical field. There is growing evidence that astaxanthin has various health advantages and significant nutraceutical uses in dermatology due to its diversified collective activities in skin biology. Astaxanthin is beneficial for the skin and eyes and is thus used for various cosmetics formulations. It enhances skin quality and helps to promote eye health. It increases the skin's moisture content, makes it more elastic, and lessens wrinkles and acne. Moreover, it strengthens the heart and immune systems.
Potential side-effects– There are possible side effects of astaxanthin, ranging from mild to severe. According to some laboratory research, astaxanthin may prevent the activity of an enzyme called 5-alpha-reductase. As a result, it might prevent the body from converting testosterone into the hormone DHT. It is unknown what impact this would have, although medications that target the same enzyme may have unfavourable side effects, including erectile dysfunction, male breast development, and decreased libido.
Increasing awareness about feed quality and safety: Animal feed is the largest and most significant component in ensuring the sustainable production of safe and inexpensive animal proteins in the global food business. The consumption of animal products is anticipated to increase by 70% in 2050 due to rapidly rising populations, urbanization, and affluence. A rise in animal output will necessitate the production of more feed. Not only must feed be produced to satisfy increasing demand, but it must also be safe. Feed safety is a requirement for food safety and human health, as well as the health and welfare of animals. It is a component of trade access, income production, and long-term economic viability. It also aids feed and food security and reduces feed losses. Feed is, in reality, an essential component of the food chain, and its safety has been acknowledged as a shared value and obligation. Thus, the rising awareness regarding feed safety and quality results in higher market shares for astaxanthin.
Stringent regulations for product approval – The regulations for product approval in astaxanthin are stringent. Companies must adhere to many regional and global rules to launch their drug. FDA regulations are necessary for all astaxanthin, and the companies must provide the manufacturing process details and the declaration of potential side effects.
The regions analyzed for the market include North America, Europe, South America, Asia Pacific, and Middle East & Africa. North America emerged as the most significant global astaxanthin market, with a revenue share of 41.11% in 2023. The region has a high market growth rate due to the increasing prevalence of skin-related diseases and nutritional deficiencies. The North American market will be driven by investment in the pharmaceutical and biotechnology industry to support the astaxanthin market. Also, the increase in the percentage of health-conscious people provides lucrative growth opportunities to the market. The Asia Pacific region is anticipated to grow lucratively during the forecast period. The market is witnessing a lucrative growth rate due to the increasing investment in aquaculture in India, China and Japan.
North America region Astaxanthin Market Share in 2023 - 41.11%
www.thebrainyinsights.com
Check the geographical analysis of this market by requesting a free sample
The form segment is divided into liquid and dry. The dry segment dominated the market with a revenue share of 64.21% in 2023. Dry astaxanthin is used in various applications owing to its longer shelf life. Dry astaxanthin can be mixed with animal feed, food and beverages, nutraceutical products, and cosmetics.
The source segment includes natural and synthetic. The natural segment further includes microalgae, shrimp, yeast and others. The natural segment dominated the market with a revenue share of 67.27% in 2023. Natural astaxanthin has several advantages, such as sustainability and high efficacy. Further, the increasing demand for organic food supplements has led to higher use of natural astaxanthin.
The production method segment includes fermentation, chemical synthesis, extraction and microalgae cultivation. The chemical synthesis segment dominated the market with a revenue share of 42.87% in 2023. Chemically synthesized astaxanthin is considered to be economical. However, the chemically synthesized astaxanthin is only suitable for feed production.
The application segment includes food and beverages, cosmetics, nutraceuticals and feed. The feed segment dominated the market with a revenue share of 46.89% in 2023. Astaxanthin is majorly used in the manufacturing of animal feeds. The growth of the aquaculture industry has led to high demand for astaxanthin. It is even used for improving seafood quality.
| Attribute | Description |
|---|---|
| Market Size | Revenue (USD Million) |
| Market size value in 2023 | USD 927.21 Million |
| Market size value in 2033 | USD 5,329.18 Million |
| CAGR (2024 to 2033) | 19.11% |
| Historical data | 2020-2022 |
| Base Year | 2023 |
| Forecast | 2024-2033 |
| Region | The regions examined for the market are Europe, Asia Pacific, North America, South America, and Middle East & Africa. |
| Segments | The research segment is based on form, source, production method, and application. |
As per The Brainy Insights, the size of the astaxanthin market was valued 927.21 Million in 2023 to USD 5,329.18 Million by 2033.
Global astaxanthin market is growing at a CAGR of 19.11% during the forecast period 2024-2033.
North America region emerged as the largest market for the astaxanthin.
The market's growth will be influenced by the growing demand from various end-user industries.
The potential side-effects of drugs could hamper the market growth.
The increasing investment in aquaculture industry is providing huge opportunities to the market.
1. Introduction
1.1. Objectives of the Study
1.2. Market Definition
1.3. Research Scope
1.4. Currency
1.5. Key Target Audience
2. Research Methodology and Assumptions
3. Executive Summary
4. Premium Insights
4.1. Porter’s Five Forces Analysis
4.2. Value Chain Analysis
4.3. Top Investment Pockets
4.3.1. Market Attractiveness Analysis by Form
4.3.2. Market Attractiveness Analysis by Source
4.3.3. Market Attractiveness Analysis by Production Method
4.3.4. Market Attractiveness Analysis by Application
4.3.5. Market Attractiveness Analysis by Region
4.4. Industry Trends
5. Market Dynamics
5.1. Market Evaluation
5.2. Drivers
5.2.1. Increasing use of astaxanthin in various application
5.3. Restraints
5.3.1. Potential side-effects
5.4. Opportunities
5.4.1. Increasing investment in aquaculture industry
5.5. Challenges
5.5.1. Stringent regulations for approval
6. Global Astaxanthin Market Analysis and Forecast, By Form
6.1. Segment Overview
6.2. Liquid
6.3. Dry
7. Global Astaxanthin Market Analysis and Forecast, By Source
7.1. Segment Overview
7.2. Natural
7.2.1. Microalgae
7.2.2. Shrimp
7.2.3. Yeast
7.2.4. Others
7.3. Synthetic
8. Global Astaxanthin Market Analysis and Forecast, By Production Method
8.1. Segment Overview
8.2. Fermentation
8.3. Chemical Synthesis
8.4. Extraction
8.5. Microalgae Cultivation
9. Global Astaxanthin Market Analysis and Forecast, By Application
9.1. Segment Overview
9.2. Food and Beverages
9.3. Cosmetics
9.4. Nutraceuticals
9.5. Feed
10. Global Astaxanthin Market Analysis and Forecast, By Regional Analysis
10.1. Segment Overview
10.2. North America
10.2.1. U.S.
10.2.2. Canada
10.2.3. Mexico
10.3. Europe
10.3.1. Germany
10.3.2. France
10.3.3. U.K.
10.3.4. Italy
10.3.5. Spain
10.4. Asia-Pacific
10.4.1. Japan
10.4.2. China
10.4.3. India
10.5. South America
10.5.1. Brazil
10.6. Middle East and Africa
10.6.1. UAE
10.6.2. South Africa
11. Global Astaxanthin Market-Competitive Landscape
11.1. Overview
11.2. Market Share of Key Players in the Astaxanthin Market
11.2.1. Global Company Market Share
11.2.2. North America Company Market Share
11.2.3. Europe Company Market Share
11.2.4. APAC Company Market Share
11.3. Competitive Situations and Trends
11.3.1. Product Launches and Developments
11.3.2. Partnerships, Collaborations, and Agreements
11.3.3. Mergers & Acquisitions
11.3.4. Expansions
12. Company Profiles
12.1. Cyanotech Corporation
12.1.1. Business Overview
12.1.2. Company Snapshot
12.1.3. Company Market Share Analysis
12.1.4. Company Product Portfolio
12.1.5. Recent Developments
12.1.6. SWOT Analysis
12.2. Algatech Ltd
12.2.1. Business Overview
12.2.2. Company Snapshot
12.2.3. Company Market Share Analysis
12.2.4. Company Product Portfolio
12.2.5. Recent Developments
12.2.6. SWOT Analysis
12.3. Beijing Gingko Group
12.3.1. Business Overview
12.3.2. Company Snapshot
12.3.3. Company Market Share Analysis
12.3.4. Company Product Portfolio
12.3.5. Recent Developments
12.3.6. SWOT Analysis
12.4. MicroA
12.4.1. Business Overview
12.4.2. Company Snapshot
12.4.3. Company Market Share Analysis
12.4.4. Company Product Portfolio
12.4.5. Recent Developments
12.4.6. SWOT Analysis
12.5. Algalíf Iceland EHF
12.5.1. Business Overview
12.5.2. Company Snapshot
12.5.3. Company Market Share Analysis
12.5.4. Company Product Portfolio
12.5.5. Recent Developments
12.5.6. SWOT Analysis
12.6. PIVEG, Inc.
12.6.1. Business Overview
12.6.2. Company Snapshot
12.6.3. Company Market Share Analysis
12.6.4. Company Product Portfolio
12.6.5. Recent Developments
12.6.6. SWOT Analysis
12.7. Fuji Chemical Industries Co. Ltd
12.7.1. Business Overview
12.7.2. Company Snapshot
12.7.3. Company Market Share Analysis
12.7.4. Company Product Portfolio
12.7.5. Recent Developments
12.7.6. SWOT Analysis
12.8. ENEOS Corporation
12.8.1. Business Overview
12.8.2. Company Snapshot
12.8.3. Company Market Share Analysis
12.8.4. Company Product Portfolio
12.8.5. Recent Developments
12.8.6. SWOT Analysis
12.9. Atacama Bio Natural Products S.A
12.9.1. Business Overview
12.9.2. Company Snapshot
12.9.3. Company Market Share Analysis
12.9.4. Company Product Portfolio
12.9.5. Recent Developments
12.9.6. SWOT Analysis
12.10. BASF SE
12.10.1. Business Overview
12.10.2. Company Snapshot
12.10.3. Company Market Share Analysis
12.10.4. Company Product Portfolio
12.10.5. Recent Developments
12.10.6. SWOT Analysis
12.11. Parry Nutraceuticals
12.11.1. Business Overview
12.11.2. Company Snapshot
12.11.3. Company Market Share Analysis
12.11.4. Company Product Portfolio
12.11.5. Recent Developments
12.11.6. SWOT Analysis
12.12. Fenchem Biotech Ltd.
12.12.1. Business Overview
12.12.2. Company Snapshot
12.12.3. Company Market Share Analysis
12.12.4. Company Product Portfolio
12.12.5. Recent Developments
12.12.6. SWOT Analysis
12.13. KDI Ingredients
12.13.1. Business Overview
12.13.2. Company Snapshot
12.13.3. Company Market Share Analysis
12.13.4. Company Product Portfolio
12.13.5. Recent Developments
12.13.6. SWOT Analysis
List of Table
1. Global Astaxanthin Market, By Form, 2020-2033 (USD Million)
2. Global Liquid, Astaxanthin Market, By Region, 2020-2033 (USD Million)
3. Global Dry, Astaxanthin Market, By Region, 2020-2033 (USD Million)
4. Global Astaxanthin Market, By Source, 2020-2033 (USD Million)
5. Global Natural, Astaxanthin Market, By Region, 2020-2033 (USD Million)
6. Global Synthetic, Astaxanthin Market, By Region, 2020-2033 (USD Million)
7. Global Astaxanthin Market, By Production Method, 2020-2033 (USD Million)
8. Global Fermentation, Astaxanthin Market, By Region, 2020-2033 (USD Million)
9. Global Chemical Synthesis, Astaxanthin Market, By Region, 2020-2033 (USD Million)
10. Global Extraction, Astaxanthin Market, By Region, 2020-2033 (USD Million)
11. Global Microalgae Cultivation, Astaxanthin Market, By Region, 2020-2033 (USD Million)
12. Global Astaxanthin Market, By Application, 2020-2033 (USD Million)
13. Global Food and Beverages, Astaxanthin Market, By Region, 2020-2033 (USD Million)
14. Global Cosmetics, Astaxanthin Market, By Region, 2020-2033 (USD Million)
15. Global Nutraceuticals, Astaxanthin Market, By Region, 2020-2033 (USD Million)
16. Global Feed, Astaxanthin Market, By Region, 2020-2033 (USD Million)
17. Global Astaxanthin Market, By Region, 2020-2033 (USD Million)
18. North America Astaxanthin Market, By Form, 2020-2033 (USD Million)
19. North America Astaxanthin Market, By Source, 2020-2033 (USD Million)
20. North America Astaxanthin Market, By Production Method, 2020-2033 (USD Million)
21. North America Astaxanthin Market, By Application, 2020-2033 (USD Million)
22. U.S. Astaxanthin Market, By Form, 2020-2033 (USD Million)
23. U.S. Astaxanthin Market, By Source, 2020-2033 (USD Million)
24. U.S. Astaxanthin Market, By Production Method, 2020-2033 (USD Million)
25. U.S. Astaxanthin Market, By Application, 2020-2033 (USD Million)
26. Canada Astaxanthin Market, By Form, 2020-2033 (USD Million)
27. Canada Astaxanthin Market, By Source, 2020-2033 (USD Million)
28. Canada Astaxanthin Market, By Production Method, 2020-2033 (USD Million)
29. Canada Astaxanthin Market, By Application, 2020-2033 (USD Million)
30. Mexico Astaxanthin Market, By Form, 2020-2033 (USD Million)
31. Mexico Astaxanthin Market, By Source, 2020-2033 (USD Million)
32. Mexico Astaxanthin Market, By Production Method, 2020-2033 (USD Million)
33. Mexico Astaxanthin Market, By Application, 2020-2033 (USD Million)
34. Europe Astaxanthin Market, By Form, 2020-2033 (USD Million)
35. Europe Astaxanthin Market, By Source, 2020-2033 (USD Million)
36. Europe Astaxanthin Market, By Production Method, 2020-2033 (USD Million)
37. Europe Astaxanthin Market, By Application, 2020-2033 (USD Million)
38. Germany Astaxanthin Market, By Form, 2020-2033 (USD Million)
39. Germany Astaxanthin Market, By Source, 2020-2033 (USD Million)
40. Germany Astaxanthin Market, By Production Method, 2020-2033 (USD Million)
41. Germany Astaxanthin Market, By Application, 2020-2033 (USD Million)
42. France Astaxanthin Market, By Form, 2020-2033 (USD Million)
43. France Astaxanthin Market, By Source, 2020-2033 (USD Million)
44. France Astaxanthin Market, By Production Method, 2020-2033 (USD Million)
45. France Astaxanthin Market, By Application, 2020-2033 (USD Million)
46. U.K. Astaxanthin Market, By Form, 2020-2033 (USD Million)
47. U.K. Astaxanthin Market, By Source, 2020-2033 (USD Million)
48. U.K. Astaxanthin Market, By Production Method, 2020-2033 (USD Million)
49. U.K. Astaxanthin Market, By Application, 2020-2033 (USD Million)
50. Italy Astaxanthin Market, By Form, 2020-2033 (USD Million)
51. Italy Astaxanthin Market, By Source, 2020-2033 (USD Million)
52. Italy Astaxanthin Market, By Production Method, 2020-2033 (USD Million)
53. Italy Astaxanthin Market, By Application, 2020-2033 (USD Million)
54. Spain Astaxanthin Market, By Form, 2020-2033 (USD Million)
55. Spain Astaxanthin Market, By Source, 2020-2033 (USD Million)
56. Spain Astaxanthin Market, By Production Method, 2020-2033 (USD Million)
57. Spain Astaxanthin Market, By Application, 2020-2033 (USD Million)
58. Asia Pacific Astaxanthin Market, By Form, 2020-2033 (USD Million)
59. Asia Pacific Astaxanthin Market, By Source, 2020-2033 (USD Million)
60. Asia Pacific Astaxanthin Market, By Production Method, 2020-2033 (USD Million)
61. Asia Pacific Astaxanthin Market, By Application, 2020-2033 (USD Million)
62. Japan Astaxanthin Market, By Form, 2020-2033 (USD Million)
63. Japan Astaxanthin Market, By Source, 2020-2033 (USD Million)
64. Japan Astaxanthin Market, By Production Method, 2020-2033 (USD Million)
65. Japan Astaxanthin Market, By Application, 2020-2033 (USD Million)
66. China Astaxanthin Market, By Form, 2020-2033 (USD Million)
67. China Astaxanthin Market, By Source, 2020-2033 (USD Million)
68. China Astaxanthin Market, By Production Method, 2020-2033 (USD Million)
69. China Astaxanthin Market, By Application, 2020-2033 (USD Million)
70. India Astaxanthin Market, By Form, 2020-2033 (USD Million)
71. India Astaxanthin Market, By Source, 2020-2033 (USD Million)
72. India Astaxanthin Market, By Production Method, 2020-2033 (USD Million)
73. India Astaxanthin Market, By Application, 2020-2033 (USD Million)
74. South America Astaxanthin Market, By Form, 2020-2033 (USD Million)
75. South America Astaxanthin Market, By Source, 2020-2033 (USD Million)
76. South America Astaxanthin Market, By Production Method, 2020-2033 (USD Million)
77. South America Astaxanthin Market, By Application, 2020-2033 (USD Million)
78. Brazil Astaxanthin Market, By Form, 2020-2033 (USD Million)
79. Brazil Astaxanthin Market, By Source, 2020-2033 (USD Million)
80. Brazil Astaxanthin Market, By Production Method, 2020-2033 (USD Million)
81. BrazilAstaxanthin Market, By Application, 2020-2033 (USD Million)
82. Middle East and Africa Astaxanthin Market, By Form, 2020-2033 (USD Million)
83. Middle East and Africa Astaxanthin Market, By Source, 2020-2033 (USD Million)
84. Middle East and Africa Astaxanthin Market, By Production Method, 2020-2033 (USD Million)
85. Middle East and Africa Astaxanthin Market, By Application, 2020-2033 (USD Million)
86. UAE Astaxanthin Market, By Form, 2020-2033 (USD Million)
87. UAE Astaxanthin Market, By Source, 2020-2033 (USD Million)
88. UAE Astaxanthin Market, By Production Method, 2020-2033 (USD Million)
89. UAE Astaxanthin Market, By Application, 2020-2033 (USD Million)
90. South Africa Astaxanthin Market, By Form, 2020-2033 (USD Million)
91. South Africa Astaxanthin Market, By Source, 2020-2033 (USD Million)
92. South Africa Astaxanthin Market, By Production Method, 2020-2033 (USD Million)
93. South Africa Astaxanthin Market, By Application, 2020-2033 (USD Million)
List of Figures
1. Global Astaxanthin Market Segmentation
2. Astaxanthin Market: Research Methodology
3. Market Size Estimation Methodology: Bottom-Up Approach
4. Market Size Estimation Methodology: Top-Down Approach
5. Data Triangulation
6. Porter’s Five Forces Analysis
7. Value Chain Analysis
8. Global Astaxanthin Market Attractiveness Analysis by Form
9. Global Astaxanthin Market Attractiveness Analysis by Source
10. Global Astaxanthin Market Attractiveness Analysis by Production Method
11. Global Astaxanthin Market Attractiveness Analysis by Application
12. Global Astaxanthin Market Attractiveness Analysis by Region
13. Global Astaxanthin Market: Dynamics
14. Global Astaxanthin Market Share by Form (2023 & 2033)
15. Global Astaxanthin Market Share by Source (2023 & 2033)
16. Global Astaxanthin Market Share by Production Method (2023 & 2033)
17. Global Astaxanthin Market Share by Application (2023 & 2033)
18. Global Astaxanthin Market Share by Regions (2023 & 2033)
19. Global Astaxanthin Market Share by Company (2023)
This study forecasts revenue at global, regional, and country levels from 2020 to 2033. The Brainy Insights has segmented the global astaxanthin market based on below mentioned segments:
Global Astaxanthin Market by Form:
Global Astaxanthin Market by Source:
Global Astaxanthin Market by Production Method:
Global Astaxanthin Market by Application:
Global Astaxanthin Market by Region:
Research has its special purpose to undertake marketing efficiently. In this competitive scenario, businesses need information across all industry verticals; the information about customer wants, market demand, competition, industry trends, distribution channels etc. This information needs to be updated regularly because businesses operate in a dynamic environment. Our organization, The Brainy Insights incorporates scientific and systematic research procedures in order to get proper market insights and industry analysis for overall business success. The analysis consists of studying the market from a miniscule level wherein we implement statistical tools which helps us in examining the data with accuracy and precision.
Our research reports feature both; quantitative and qualitative aspects for any market. Qualitative information for any market research process are fundamental because they reveal the customer needs and wants, usage and consumption for any product/service related to a specific industry. This in turn aids the marketers/investors in knowing certain perceptions of the customers. Qualitative research can enlighten about the different product concepts and designs along with unique service offering that in turn, helps define marketing problems and generate opportunities. On the other hand, quantitative research engages with the data collection process through interviews, e-mail interactions, surveys and pilot studies. Quantitative aspects for the market research are useful to validate the hypotheses generated during qualitative research method, explore empirical patterns in the data with the help of statistical tools, and finally make the market estimations.
The Brainy Insights offers comprehensive research and analysis, based on a wide assortment of factual insights gained through interviews with CXOs and global experts and secondary data from reliable sources. Our analysts and industry specialist assume vital roles in building up statistical tools and analysis models, which are used to analyse the data and arrive at accurate insights with exceedingly informative research discoveries. The data provided by our organization have proven precious to a diverse range of companies, facilitating them to address issues such as determining which products/services are the most appealing, whether or not customers use the product in the manner anticipated, the purchasing intentions of the market and many others.
Our research methodology encompasses an idyllic combination of primary and secondary initiatives. Key phases involved in this process are listed below:

The phase involves the gathering and collecting of market data and its related information with the help of different sources & research procedures.

The data procurement stage involves in data gathering and collecting through various data sources.
This stage involves in extensive research. These data sources includes:
Purchased Database: Purchased databases play a crucial role in estimating the market sizes irrespective of the domain. Our purchased database includes:
Primary Research: The Brainy Insights interacts with leading companies and experts of the concerned domain to develop the analyst team’s market understanding and expertise. It improves and substantiates every single data presented in the market reports. Primary research mainly involves in telephonic interviews, E-mail interactions and face-to-face interviews with the raw material providers, manufacturers/producers, distributors, & independent consultants. The interviews that we conduct provides valuable data on market size and industry growth trends prevailing in the market. Our organization also conducts surveys with the various industry experts in order to gain overall insights of the industry/market. For instance, in healthcare industry we conduct surveys with the pharmacists, doctors, surgeons and nurses in order to gain insights and key information of a medical product/device/equipment which the customers are going to usage. Surveys are conducted in the form of questionnaire designed by our own analyst team. Surveys plays an important role in primary research because surveys helps us to identify the key target audiences of the market. Additionally, surveys helps to identify the key target audience engaged with the market. Our survey team conducts the survey by targeting the key audience, thus gaining insights from them. Based on the perspectives of the customers, this information is utilized to formulate market strategies. Moreover, market surveys helps us to understand the current competitive situation of the industry. To be precise, our survey process typically involve with the 360 analysis of the market. This analytical process begins by identifying the prospective customers for a product or service related to the market/industry to obtain data on how a product/service could fit into customers’ lives.

Secondary Research: The secondary data sources includes information published by the on-profit organizations such as World bank, WHO, company fillings, investor presentations, annual reports, national government documents, statistical databases, blogs, articles, white papers and others. From the annual report, we analyse a company’s revenue to understand the key segment and market share of that organization in a particular region. We analyse the company websites and adopt the product mapping technique which is important for deriving the segment revenue. In the product mapping method, we select and categorize the products offered by the companies catering to domain specific market, deduce the product revenue for each of the companies so as to get overall estimation of the market size. We also source data and analyses trends based on information received from supply side and demand side intermediaries in the value chain. The supply side denotes the data gathered from supplier, distributor, wholesaler and the demand side illustrates the data gathered from the end customers for respective market domain.

The supply side for a domain specific market is analysed by:
The demand side for the market is estimated through:
In-house Library: Apart from these third-party sources, we have our in-house library of qualitative and quantitative information. Our in-house database includes market data for various industry and domains. These data are updated on regular basis as per the changing market scenario. Our library includes, historic databases, internal audit reports and archives.
Sometimes there are instances where there is no metadata or raw data available for any domain specific market. For those cases, we use our expertise to forecast and estimate the market size in order to generate comprehensive data sets. Our analyst team adopt a robust research technique in order to produce the estimates:
Data Synthesis: This stage involves the analysis & mapping of all the information obtained from the previous step. It also involves in scrutinizing the data for any discrepancy observed while data gathering related to the market. The data is collected with consideration to the heterogeneity of sources. Robust scientific techniques are in place for synthesizing disparate data sets and provide the essential contextual information that can orient market strategies. The Brainy Insights has extensive experience in data synthesis where the data passes through various stages:


Market Deduction & Formulation: The final stage comprises of assigning data points at appropriate market spaces so as to deduce feasible conclusions. Analyst perspective & subject matter expert based holistic form of market sizing coupled with industry analysis also plays a crucial role in this stage.
This stage involves in finalization of the market size and numbers that we have collected from data integration step. With data interpolation, it is made sure that there is no gap in the market data. Successful trend analysis is done by our analysts using extrapolation techniques, which provide the best possible forecasts for the market.
Data Validation & Market Feedback: Validation is the most important step in the process. Validation & re-validation via an intricately designed process helps us finalize data-points to be used for final calculations.

The Brainy Insights interacts with leading companies and experts of the concerned domain to develop the analyst team’s market understanding and expertise. It improves and substantiates every single data presented in the market reports. The data validation interview and discussion panels are typically composed of the most experienced industry members. The participants include, however, are not limited to:
Moreover, we always validate our data and findings through primary respondents from all the major regions we are working on.


Free Customization
Fortune 500 Clients
Free Yearly Update On Purchase Of Multi/Corporate License
Companies Served Till Date