- +1-315-215-1633
- sales@thebrainyinsights.com

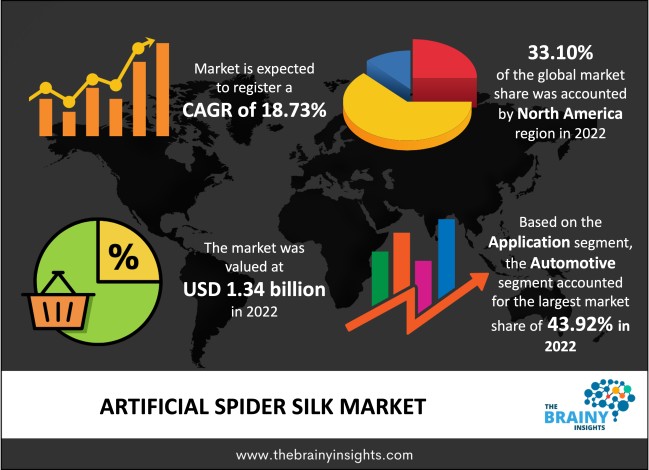
The global artificial spider silk market was valued at USD 1.34 billion in 2022 and grew at a CAGR of 18.73% from 2023 to 2032. The market is expected to reach USD 7.45 billion by 2032. The growth of artificial spider silks in the textile, automotive, and defence industries can be attributed to their numerous benefits over conventional materials. In expansion, the growing need for artificial spider silks in healthcare fabric manufacturing is propelling the growth in the market.
Artificial spider silk has some pretty remarkable qualities. It is one of the most durable substances in nature, tougher than Kevlar and stronger than steel. It can be stretched numerous times beyond its breaking point. Materials scientists have been somewhat obsessed with simulating spider silk in the lab for decades. Although not nearly as strong as the strongest spider silk, the fibres are robust. More importantly, they can be manufactured at room temperature without chemical solvents. As a result, if they can be mass-produced, they will have the edge over other synthetic fibres like nylon, whose spinning calls for extraordinarily high temperatures. As the substance is biocompatible, it might be used for things like stitching inside the human body. Additionally, the artificial spider silk could be altered in various fascinating ways. Without harsh chemicals, the artificial spider silk protein NT2RepCT may be synthesized and spun into fibres.
Get an overview of this study by requesting a free sample
Increasing use of artificial spider silk- Although its usage as a bioactive material in medication delivery and tissue regeneration are relatively new ideas, artificial spider silk is being investigated as an eco-friendly material that could revolutionize textiles, engineering, and aircraft production. Due to its characteristics, artificial silk can be utilized to create surgical sutures, artificial ligaments, and cell scaffolds for tissue repair. Manufacturers are now developing synthetic spider silk that has the same properties as natural spider silk, but can be used to replace the cellular matrix that human cells produce, speed up the development of new cells, and release antibiotics over time. Since ancient times, spider silk has been the most potent natural fibre in medical applications. It is known for its high vitamin K concentration and antibacterial qualities. These materials may represent the most comfortable and durable body armour and future parachute materials for military personnel. The material was created to be lighter than regular Kevlar, providing the wearer with more flexibility. In tests, the sticky substance absorbed the impact of being hit by bullets and halted them.
The fluctuating cost of raw materials- Raw materials for artificial spider silk manufacturers has recently increased by two to five per cent due to a substantial rise in crude oil costs. Raw material prices rise as demand rises, and the consequences reverberate throughout the supply chain. To safeguard their bottom lines, yarn and fibre manufacturers are making modifications while companies prepare to raise or have already raised prices.
Increasing research in technical textiles- Technical textiles are textile items and materials utilized for their technical functionality and performance. The potential of the global textile industry, which includes technical textiles as a significant component, still needs to be realized. Technical textile is one of the fastest-growing industries and an essential source of revenue. Medical textiles, agro textiles, protective textiles, geotextiles, and automotive materials are all examples of technical textiles. The global market for technical textiles has a strong consumption and export demand, which is a major draw for businesses. The concerned agency in different regions is implementing the following schemes to develop and advertise the handloom sector across regions.
The regions analyzed for the market include North America, Europe, South America, Asia Pacific, the Middle East, and Africa. North America emerged as the largest market for the global artificial spider silk market, with a 33.10% market revenue share in 2022.
North American region will account for the largest market share with revenue growth. Nations such as U.S. and Canada have a tremendous demand for artificial spider silk among different end-users, which will expand the market enormously. Also, multiple key players in these countries will promote the artificial spider silks market growth.
North America Region Artificial Spider Silk Market Share in 2022 - 33.10%
www.thebrainyinsights.com
Check the geographical analysis of this market by requesting a free sample
The technology segment is divided into genetically modified silkworms, genetically modified yeast formation, genetically modified Escherichia coli bacteria fermentation and others. The genetically modified Escherichia coli bacteria fermentation segment dominated the market, with a market share of around 31.92% in 2022. This technology helps to improve the quality of their product and provides highly dense artificial spider silk. Thus, many end-users demand artificial spider silk from genetically modified Escherichia coli bacteria fermentation.
The application segment is divided into healthcare, defence, textile, automotive and others. The automotive segment dominated the market, with a market share of around 43.92% in 2022. Artificial spider silk manufactures covers, airbags, seats, etc. The growth of the automobile industry has led to high demand for artificial spider silk.
The sales channel segment is divided into B2B and B2C. The B2B segment dominated the market, with a share of around 76.03% in 2022. Artificial spider silk is used in manufacturing different products for several applications. Business uses artificial spider silk for developing end-use products.
| Attribute | Description |
|---|---|
| Market Size | Revenue (USD Billion) |
| Market size value in 2022 | USD 1.34 Billion |
| Market size value in 2032 | USD 7.45 Billion |
| CAGR (2023 to 2032) | 18.73% |
| Historical data | 2019-2021 |
| Base Year | 2022 |
| Forecast | 2023-2032 |
| Regional Segments | The regions analyzed for the market are Asia Pacific, Europe, South America, North America, and Middle East & Africa. Furthermore, the regions are further analyzed at the country level. |
| Segments | Technology, Application and Sales Channel |
As per The Brainy Insights, the size of the artificial spider silk market was valued USD 1.34 billion in 2022 to USD 7.45 billion by 2032.
Global artificial spider silk market is growing at a CAGR of 18.73% during the forecast period 2023-2032.
North America region emerged as the largest market for the artificial spider silk.
The market's growth will be influenced by the growing use of artificial spider silk among different end-users.
The fluctuating cost of raw materials could hamper the market growth.
The increasing investment in automotive industry is providing huge opportunities to the market.
Key players are AM Silk GmbH, Kraig Biocraft Laboratories, Inc., Bolt Threads Inc., Spiber Inc., Inspidere BV, Warwick Mills, Inc., Seevix, EC Plaza, VF Corporation, Linder Spruhsysteme, Groupe Beaumanoir, Silvano Fashion Group., among others.
1. Introduction
1.1. Objectives of the Study
1.2. Market Definition
1.3. Research Scope
1.4. Currency
1.5. Key Target Audience
2. Research Methodology and Assumptions
3. Executive Summary
4. Premium Insights
4.1. Porter’s Five Forces Analysis
4.2. Value Chain Analysis
4.3. Top Investment Pockets
4.3.1. Market Attractiveness Analysis By Technology
4.3.2. Market Attractiveness Analysis By Application
4.3.3. Market Attractiveness Analysis By Sales Channel
4.3.4. Market Attractiveness Analysis By Region
4.4. Industry Trends
5. Market Dynamics
5.1. Market Evaluation
5.2. Drivers
5.2.1. Increasing uses of artificial spider silk in different applications
5.3. Restraints
5.3.1. Fluctuating cost of raw materials
5.4. Opportunities
5.4.1. Increasing investment in automotive industry
5.5. Challenges
5.5.1. Availability of substitutes
6. Global Artificial Spider Silk Market Analysis and Forecast, By Technology
6.1. Segment Overview
6.2. Genetically Modified Silkworm
6.3. Genetically Modified Yeast Formation
6.4. Genetically Modified Escherichia Coli Bacteria Fermentation
6.5. Others
7. Global Artificial Spider Silk Market Analysis and Forecast, By Application
7.1. Segment Overview
7.2. Healthcare
7.3. Defense
7.4. Textile
7.5. Automotive
7.6. Others
8. Global Artificial Spider Silk Market Analysis and Forecast, By Sales Channel
8.1. Segment Overview
8.2. B2B
8.3. B2C
9. Global Artificial Spider Silk Market Analysis and Forecast, By Regional Analysis
9.1. Segment Overview
9.2. North America
9.2.1. U.S.
9.2.2. Canada
9.2.3. Mexico
9.3. Europe
9.3.1. Germany
9.3.2. France
9.3.3. U.K.
9.3.4. Italy
9.3.5. Spain
9.4. Asia-Pacific
9.4.1. Japan
9.4.2. China
9.4.3. India
9.5. South America
9.5.1. Brazil
9.6. Middle East and Africa
9.6.1. UAE
9.6.2. South Africa
10. Global Artificial Spider Silk Market-Competitive Landscape
10.1. Overview
10.2. Market Share of Key Players in the Artificial Spider Silk Market
10.2.1. Global Company Market Share
10.2.2. North America Company Market Share
10.2.3. Europe Company Market Share
10.2.4. APAC Company Market Share
10.3. Competitive Situations and Trends
10.3.1. Product Launches and Developments
10.3.2. Partnerships, Collaborations, and Agreements
10.3.3. Mergers & Acquisitions
10.3.4. Expansions
11. Company Profiles
11.1. AM Silk GmbH
11.1.1. Business Overview
11.1.2. Company Snapshot
11.1.3. Company Market Share Analysis
11.1.4. Company Product Portfolio
11.1.5. Recent Developments
11.1.6. SWOT Analysis
11.2. Kraig Biocraft Laboratories, Inc.
11.2.1. Business Overview
11.2.2. Company Snapshot
11.2.3. Company Market Share Analysis
11.2.4. Company Product Portfolio
11.2.5. Recent Developments
11.2.6. SWOT Analysis
11.3. Bolt Threads Inc.
11.3.1. Business Overview
11.3.2. Company Snapshot
11.3.3. Company Market Share Analysis
11.3.4. Company Product Portfolio
11.3.5. Recent Developments
11.3.6. SWOT Analysis
11.4. Spiber Inc.
11.4.1. Business Overview
11.4.2. Company Snapshot
11.4.3. Company Market Share Analysis
11.4.4. Company Product Portfolio
11.4.5. Recent Developments
11.4.6. SWOT Analysis
11.5. Inspidere BV
11.5.1. Business Overview
11.5.2. Company Snapshot
11.5.3. Company Market Share Analysis
11.5.4. Company Product Portfolio
11.5.5. Recent Developments
11.5.6. SWOT Analysis
11.6. Warwick Mills, Inc.
11.6.1. Business Overview
11.6.2. Company Snapshot
11.6.3. Company Market Share Analysis
11.6.4. Company Product Portfolio
11.6.5. Recent Developments
11.6.6. SWOT Analysis
11.7. Seevix
11.7.1. Business Overview
11.7.2. Company Snapshot
11.7.3. Company Market Share Analysis
11.7.4. Company Product Portfolio
11.7.5. Recent Developments
11.7.6. SWOT Analysis
11.8. EC Plaza
1.1.1. Business Overview
1.1.2. Company Snapshot
1.1.3. Company Market Share Analysis
1.1.4. Company Product Portfolio
1.1.5. Recent Developments
1.1.6. SWOT Analysis
11.9. VF Corporation
11.9.1. Business Overview
11.9.2. Company Snapshot
11.9.3. Company Market Share Analysis
11.9.4. Company Product Portfolio
11.9.5. Recent Developments
11.9.6. SWOT Analysis
11.10. Linder Spruhsysteme
11.10.1. Business Overview
11.10.2. Company Snapshot
11.10.3. Company Market Share Analysis
11.10.4. Company Product Portfolio
11.10.5. Recent Developments
11.10.6. SWOT Analysis
11.11. Groupe Beaumanoir
11.11.1. Business Overview
11.11.2. Company Snapshot
11.11.3. Company Market Share Analysis
11.11.4. Company Product Portfolio
11.11.5. Recent Developments
11.11.6. SWOT Analysis
11.12. Silvano Fashion Group.
11.12.1. Business Overview
11.12.2. Company Snapshot
11.12.3. Company Market Share Analysis
11.12.4. Company Product Portfolio
11.12.5. Recent Developments
11.12.6. SWOT Analysis
List of Table
1. Global Artificial Spider Silk Market, By Technology, 2019-2032 (USD Billion)
2. Global Genetically Modified Silkworm, Artificial Spider Silk Market, By Region, 2019-2032 (USD Billion)
3. Global Genetically Modified Yeast Formation, Artificial Spider Silk Market, By Region, 2019-2032 (USD Billion)
4. Global Genetically Modified Escherichia Coli Bacteria Fermentation, Artificial Spider Silk Market, By Region, 2019-2032 (USD Billion)
5. Global Others, Artificial Spider Silk Market, By Region, 2019-2032 (USD Billion)
6. Global Artificial Spider Silk Market, By Application, 2019-2032 (USD Billion)
7. Global Healthcare, Artificial Spider Silk Market, By Region, 2019-2032 (USD Billion)
8. Global Defense, Artificial Spider Silk Market, By Region, 2019-2032 (USD Billion)
9. Global Textile, Artificial Spider Silk Market, By Region, 2019-2032 (USD Billion)
10. Global Automotive Artificial Spider Silk Market, By Region, 2019-2032 (USD Billion)
11. Global Others, Artificial Spider Silk Market, By Region, 2019-2032 (USD Billion)
12. Global Artificial Spider Silk Market, By Sales Channel, 2019-2032 (USD Billion)
13. Global B2B, Artificial Spider Silk Market, By Region, 2019-2032 (USD Billion)
14. Global B2C, Artificial Spider Silk Market, By Region, 2019-2032 (USD Billion)
15. Global Artificial Spider Silk Market, By Region, 2019-2032 (USD Billion)
16. North America Artificial Spider Silk Market, By Technology, 2019-2032 (USD Billion)
17. North America Artificial Spider Silk Market, By Application, 2019-2032 (USD Billion)
18. North America Artificial Spider Silk Market, By Sales Channel, 2019-2032 (USD Billion)
19. U.S. Artificial Spider Silk Market, By Technology, 2019-2032 (USD Billion)
20. U.S. Artificial Spider Silk Market, By Application, 2019-2032 (USD Billion)
21. U.S. Artificial Spider Silk Market, By Sales Channel, 2019-2032 (USD Billion)
22. Canada Artificial Spider Silk Market, By Technology, 2019-2032 (USD Billion)
23. Canada Artificial Spider Silk Market, By Application, 2019-2032 (USD Billion)
24. Canada Artificial Spider Silk Market, By Sales Channel, 2019-2032 (USD Billion)
25. Mexico Artificial Spider Silk Market, By Technology, 2019-2032 (USD Billion)
26. Mexico Artificial Spider Silk Market, By Application, 2019-2032 (USD Billion)
27. Mexico Artificial Spider Silk Market, By Sales Channel, 2019-2032 (USD Billion)
28. Europe Artificial Spider Silk Market, By Technology, 2019-2032 (USD Billion)
29. Europe Artificial Spider Silk Market, By Application, 2019-2032 (USD Billion)
30. Europe Artificial Spider Silk Market, By Sales Channel, 2019-2032 (USD Billion)
31. Germany Artificial Spider Silk Market, By Technology, 2019-2032 (USD Billion)
32. Germany Artificial Spider Silk Market, By Application, 2019-2032 (USD Billion)
33. Germany Artificial Spider Silk Market, By Sales Channel, 2019-2032 (USD Billion)
34. France Artificial Spider Silk Market, By Technology, 2019-2032 (USD Billion)
35. France Artificial Spider Silk Market, By Application, 2019-2032 (USD Billion)
36. France Artificial Spider Silk Market, By Sales Channel, 2019-2032 (USD Billion)
37. U.K. Artificial Spider Silk Market, By Technology, 2019-2032 (USD Billion)
38. U.K. Artificial Spider Silk Market, By Application, 2019-2032 (USD Billion)
39. U.K. Artificial Spider Silk Market, By Sales Channel, 2019-2032 (USD Billion)
40. Italy Artificial Spider Silk Market, By Technology, 2019-2032 (USD Billion)
41. Italy Artificial Spider Silk Market, By Application, 2019-2032 (USD Billion)
42. Italy Artificial Spider Silk Market, By Sales Channel, 2019-2032 (USD Billion)
43. Spain Artificial Spider Silk Market, By Technology, 2019-2032 (USD Billion)
44. Spain Artificial Spider Silk Market, By Application, 2019-2032 (USD Billion)
45. Spain Artificial Spider Silk Market, By Sales Channel, 2019-2032 (USD Billion)
46. Asia Pacific Artificial Spider Silk Market, By Technology, 2019-2032 (USD Billion)
47. Asia Pacific Artificial Spider Silk Market, By Application, 2019-2032 (USD Billion)
48. Asia Pacific Artificial Spider Silk Market, By Sales Channel, 2019-2032 (USD Billion)
49. Japan Artificial Spider Silk Market, By Technology, 2019-2032 (USD Billion)
50. Japan Artificial Spider Silk Market, By Application, 2019-2032 (USD Billion)
51. Japan Artificial Spider Silk Market, By Sales Channel, 2019-2032 (USD Billion)
52. China Artificial Spider Silk Market, By Technology, 2019-2032 (USD Billion)
53. China Artificial Spider Silk Market, By Application, 2019-2032 (USD Billion)
54. China Artificial Spider Silk Market, By Sales Channel, 2019-2032 (USD Billion)
55. India Artificial Spider Silk Market, By Technology, 2019-2032 (USD Billion)
56. India Artificial Spider Silk Market, By Application, 2019-2032 (USD Billion)
57. India Artificial Spider Silk Market, By Sales Channel, 2019-2032 (USD Billion)
58. South America Artificial Spider Silk Market, By Technology, 2019-2032 (USD Billion)
59. South America Artificial Spider Silk Market, By Application, 2019-2032 (USD Billion)
60. South America Artificial Spider Silk Market, By Sales Channel, 2019-2032 (USD Billion)
61. Brazil Artificial Spider Silk Market, By Technology, 2019-2032 (USD Billion)
62. Brazil Artificial Spider Silk Market, By Application, 2019-2032 (USD Billion)
63. Brazil Artificial Spider Silk Market, By Sales Channel, 2019-2032 (USD Billion)
64. Middle East and Africa Artificial Spider Silk Market, By Technology, 2019-2032 (USD Billion)
65. Middle East and Africa Artificial Spider Silk Market, By Application, 2019-2032 (USD Billion)
66. Middle East and Africa Artificial Spider Silk Market, By Sales Channel, 2019-2032 (USD Billion)
67. UAE Artificial Spider Silk Market, By Technology, 2019-2032 (USD Billion)
68. UAE Artificial Spider Silk Market, By Application, 2019-2032 (USD Billion)
69. UAE Artificial Spider Silk Market, By Sales Channel, 2019-2032 (USD Billion)
70. South Africa Artificial Spider Silk Market, By Technology, 2019-2032 (USD Billion)
71. South Africa Artificial Spider Silk Market, By Application, 2019-2032 (USD Billion)
72. South Africa Artificial Spider Silk Market, By Sales Channel, 2019-2032 (USD Billion)
List of Figures
1. Global Artificial Spider Silk Market Segmentation
2. Artificial Spider Silk Market: Research Methodology
3. Market Size Estimation Methodology: Bottom-Up Approach
4. Market Size Estimation Methodology: Top-Down Approach
5. Data Triangulation
6. Porter’s Five Forces Analysis
7. Value Chain Analysis
8. Global Artificial Spider Silk Market Attractiveness Analysis By Technology
9. Global Artificial Spider Silk Market Attractiveness Analysis By Application
10. Global Artificial Spider Silk Market Attractiveness Analysis By Sales Channel
11. Global Artificial Spider Silk Market Attractiveness Analysis By Region
12. Global Artificial Spider Silk Market: Dynamics
13. Global Artificial Spider Silk Market Share By Technology (2022 & 2032)
14. Global Artificial Spider Silk Market Share by Application (2022 & 2032)
15. Global Artificial Spider Silk Market Share by Sales Channel (2022 & 2032)
16. Global Artificial Spider Silk Market Share by Regions (2022 & 2032)
17. Global Artificial Spider Silk Market Share by Company (2022)
This study forecasts revenue at global, regional, and country levels from 2019 to 2032. The Brainy Insights has segmented the global artificial spider silk market based on below mentioned segments:
Global Artificial Spider Silk Market by Technology:
Global Artificial Spider Silk Market by Application:
Global Artificial Spider Silk Market by Sales Channel:
Global Artificial Spider Silk Market by Region:
Research has its special purpose to undertake marketing efficiently. In this competitive scenario, businesses need information across all industry verticals; the information about customer wants, market demand, competition, industry trends, distribution channels etc. This information needs to be updated regularly because businesses operate in a dynamic environment. Our organization, The Brainy Insights incorporates scientific and systematic research procedures in order to get proper market insights and industry analysis for overall business success. The analysis consists of studying the market from a miniscule level wherein we implement statistical tools which helps us in examining the data with accuracy and precision.
Our research reports feature both; quantitative and qualitative aspects for any market. Qualitative information for any market research process are fundamental because they reveal the customer needs and wants, usage and consumption for any product/service related to a specific industry. This in turn aids the marketers/investors in knowing certain perceptions of the customers. Qualitative research can enlighten about the different product concepts and designs along with unique service offering that in turn, helps define marketing problems and generate opportunities. On the other hand, quantitative research engages with the data collection process through interviews, e-mail interactions, surveys and pilot studies. Quantitative aspects for the market research are useful to validate the hypotheses generated during qualitative research method, explore empirical patterns in the data with the help of statistical tools, and finally make the market estimations.
The Brainy Insights offers comprehensive research and analysis, based on a wide assortment of factual insights gained through interviews with CXOs and global experts and secondary data from reliable sources. Our analysts and industry specialist assume vital roles in building up statistical tools and analysis models, which are used to analyse the data and arrive at accurate insights with exceedingly informative research discoveries. The data provided by our organization have proven precious to a diverse range of companies, facilitating them to address issues such as determining which products/services are the most appealing, whether or not customers use the product in the manner anticipated, the purchasing intentions of the market and many others.
Our research methodology encompasses an idyllic combination of primary and secondary initiatives. Key phases involved in this process are listed below:

The phase involves the gathering and collecting of market data and its related information with the help of different sources & research procedures.

The data procurement stage involves in data gathering and collecting through various data sources.
This stage involves in extensive research. These data sources includes:
Purchased Database: Purchased databases play a crucial role in estimating the market sizes irrespective of the domain. Our purchased database includes:
Primary Research: The Brainy Insights interacts with leading companies and experts of the concerned domain to develop the analyst team’s market understanding and expertise. It improves and substantiates every single data presented in the market reports. Primary research mainly involves in telephonic interviews, E-mail interactions and face-to-face interviews with the raw material providers, manufacturers/producers, distributors, & independent consultants. The interviews that we conduct provides valuable data on market size and industry growth trends prevailing in the market. Our organization also conducts surveys with the various industry experts in order to gain overall insights of the industry/market. For instance, in healthcare industry we conduct surveys with the pharmacists, doctors, surgeons and nurses in order to gain insights and key information of a medical product/device/equipment which the customers are going to usage. Surveys are conducted in the form of questionnaire designed by our own analyst team. Surveys plays an important role in primary research because surveys helps us to identify the key target audiences of the market. Additionally, surveys helps to identify the key target audience engaged with the market. Our survey team conducts the survey by targeting the key audience, thus gaining insights from them. Based on the perspectives of the customers, this information is utilized to formulate market strategies. Moreover, market surveys helps us to understand the current competitive situation of the industry. To be precise, our survey process typically involve with the 360 analysis of the market. This analytical process begins by identifying the prospective customers for a product or service related to the market/industry to obtain data on how a product/service could fit into customers’ lives.

Secondary Research: The secondary data sources includes information published by the on-profit organizations such as World bank, WHO, company fillings, investor presentations, annual reports, national government documents, statistical databases, blogs, articles, white papers and others. From the annual report, we analyse a company’s revenue to understand the key segment and market share of that organization in a particular region. We analyse the company websites and adopt the product mapping technique which is important for deriving the segment revenue. In the product mapping method, we select and categorize the products offered by the companies catering to domain specific market, deduce the product revenue for each of the companies so as to get overall estimation of the market size. We also source data and analyses trends based on information received from supply side and demand side intermediaries in the value chain. The supply side denotes the data gathered from supplier, distributor, wholesaler and the demand side illustrates the data gathered from the end customers for respective market domain.

The supply side for a domain specific market is analysed by:
The demand side for the market is estimated through:
In-house Library: Apart from these third-party sources, we have our in-house library of qualitative and quantitative information. Our in-house database includes market data for various industry and domains. These data are updated on regular basis as per the changing market scenario. Our library includes, historic databases, internal audit reports and archives.
Sometimes there are instances where there is no metadata or raw data available for any domain specific market. For those cases, we use our expertise to forecast and estimate the market size in order to generate comprehensive data sets. Our analyst team adopt a robust research technique in order to produce the estimates:
Data Synthesis: This stage involves the analysis & mapping of all the information obtained from the previous step. It also involves in scrutinizing the data for any discrepancy observed while data gathering related to the market. The data is collected with consideration to the heterogeneity of sources. Robust scientific techniques are in place for synthesizing disparate data sets and provide the essential contextual information that can orient market strategies. The Brainy Insights has extensive experience in data synthesis where the data passes through various stages:


Market Deduction & Formulation: The final stage comprises of assigning data points at appropriate market spaces so as to deduce feasible conclusions. Analyst perspective & subject matter expert based holistic form of market sizing coupled with industry analysis also plays a crucial role in this stage.
This stage involves in finalization of the market size and numbers that we have collected from data integration step. With data interpolation, it is made sure that there is no gap in the market data. Successful trend analysis is done by our analysts using extrapolation techniques, which provide the best possible forecasts for the market.
Data Validation & Market Feedback: Validation is the most important step in the process. Validation & re-validation via an intricately designed process helps us finalize data-points to be used for final calculations.

The Brainy Insights interacts with leading companies and experts of the concerned domain to develop the analyst team’s market understanding and expertise. It improves and substantiates every single data presented in the market reports. The data validation interview and discussion panels are typically composed of the most experienced industry members. The participants include, however, are not limited to:
Moreover, we always validate our data and findings through primary respondents from all the major regions we are working on.


Free Customization
Fortune 500 Clients
Free Yearly Update On Purchase Of Multi/Corporate License
Companies Served Till Date