- +1-315-215-1633
- sales@thebrainyinsights.com

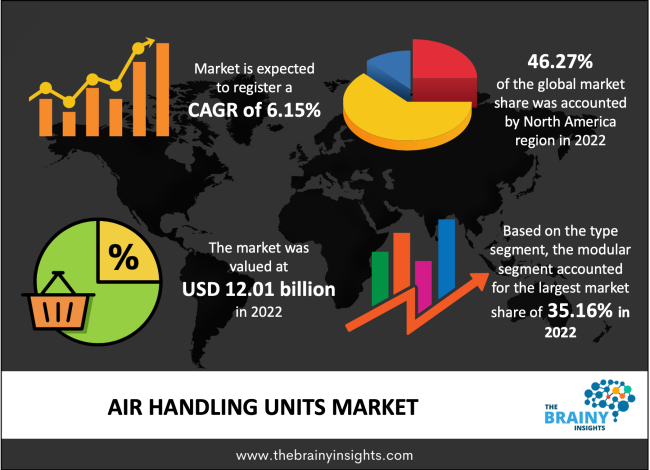
The global air handling units market was valued at USD 12.02 billion in 2022, increasing at a CAGR of 6.15% from 2022 to 2030 and anticipated to reach USD 19.37 Billion by 2030. Asia Pacific is expected to grow the fastest during the forecast period. Further, the risen power demand from non-commercial & commercial sectors, population growth, and economic development in developing nations are anticipated to drive market growth over the forecast period. Moreover, the outbreak of COVID-19 has negatively affected the growth of the worldwide air handling units market due to the presence of lockdowns in different countries.
The air handling unit (AHU), also known as the air handler, is a central air conditioning appliance that controls the air moving throughout the HVAC system. The air handling unit is a large metal box that conditions the air, which aids in creating a perfect atmosphere. An air handling unit is one of the essential equipment in an HVAC (heating, ventilation, and air-conditioning) system, especially in large-scale buildings, for providing both cooling and heating for numerous zones. An automatic control system that allows remote management of air handling units used for enhancing the air quality and quality of life in crowded areas like hotels, hospitals, business centres, malls, educational institutions, banks, public institutions, theatres, cultural centres, airports, etc., has also become an integral part of the air handling units. It mainly consists of numerous heating and cooling coils, air supply and exhaust ventilators, air filter chambers, sound attenuators, and dampers. The housing that contains all the other components of an air handling unit is usually made of metal, and some are painted to prevent corrosion. The air handling unit is usually a large metal box that links to the ductwork that channels drilled air throughout a building and returns it to the air handling unit.
Get an overview of this study by requesting a free sample
For instance, in 2021, Trane Technologies PLC Company established a new operations base in Nevada (Las Vegas). The firm aims to partner with local engineers, local contractors, facility directors and commercial building owners to deliver HVAC and energy management services, systems and aftermarket parts solutions.
The increasing demand for energy-efficient products: The effective growth in demand for energy-efficient products due to the rising population, economic development, and technological developments are driving the market growth. Further, the significant upsurge in awareness about the effect of pollution on human health is propelling the market growth. Moreover, the rise in commercial buildings, residential buildings, and industries has also developed the demand for air-handling units. Additionally, the demand for reducing energy consumption and operating prices are also helping drive market growth over the upcoming years.
The fluctuating raw material prices: The fluctuating raw material costs worldwide are restraining market growth factors. Also, the stringent regulations over air quality in air conditioning systems hamper the market growth. Moreover, the extensive investments needed for establishing production plants are restraining market growth. Additionally, the rising uses of heat exchangers in applications like hydraulics, marine & mining, power generation, spas & swimming pools, and mobile power plants create vast market demand. Further, alloys, metals, polypropylene, and fiber-reinforced polymers construct air handling systems. The OEMs' ability to source high-quality raw materials and manage the supply schedules imposed by suppliers is hampering the market growth.
The increasing advances in manufacturing technologies: The evolution of monitoring systems and intelligent technology is an opportunity for market growth. Further, the increase in urbanization and population globally is the driving factor of the market growth. Moreover, the rising population, which is anticipated to positively influence residential and commercial constructions, will drive market growth over the forecast period. Additionally, the increasing demand for improved reliability in heat exchangers and operations in spacecraft, aeronautics, and oil drilling is a significant factor in the market growth.
The regions analyzed for the market include Europe, South America, Asia Pacific, North America, the Middle East, and Africa. North America emerged as the largest global air handling units market, with a 46.27% market revenue share in 2022. North America dominates the air handling units market due to the increasing promotional activities from the government to raise the adoption of energy-efficient air conditioning systems to reduce energy consumption. Further, rapidly expanding construction activity in emerging economies, the rapidly growing industrial sector and the increasing demand for thermal comfort are expected to drive market growth in this region. Additionally, Asia Pacific is expected to grow the fastest during the forecast period due to the rising construction activity across the industrial, residential, and commercial sectors. Also, the increasing concern for air quality and the rising number of infrastructure projects propel market growth in this region. Further, the growing number of infrastructure projects in emerging countries such as Japan, India, China, and Brazil are driving factors of the market growth in this region over the forecast period. Additionally, the integration of IoT systems like remote control, sensors, and mobile apps has enabled users to control easily, monitor, and interact with HVAC systems, which is expected to propel the market growth during the forecast period.
North America Region Air Handling Units Market Share in 2022 - 46.27%
www.thebrainyinsights.com
Check the geographical analysis of this market by requesting a free sample
The capacity segment is divided into up to 5,000 m³/hr., 5,000 m³/hr. to 15,000 m³/hr., 15,000 m³/hr. to 30,000 m³/hr., 30,000 m³/hr. to 50,000 m³/hr., and above 50,000 m³/hr. In 2022, up to 5,000 m³/hr. The segment dominated the market, accounting for around 31.16% of global revenue. This growth is attributed to the increasing awareness of the impacts of environmental pollution on human health.
The working principle segment is divided into blow through and draw through. In 2022, the blow-through segment dominated the market, accounting for around 57.19% of global revenue. This growth is attributed to the increased competition for worldwide handling units. Also, the blow-through manufacturers use a cold air (inlet) CFM, while draw-through units use a hot air (outlet) CFM.
The type segment is divided into packaged, modular, custom, and DX integrated. In 2022, the modular segment dominated the market, accounting for around 35.16% of global revenue. This growth is attributed to the growing demand for cold chains. Further, by 2030, the packaged segment will likely dominate the market due to the increasing demand for packaged systems across various industries, such as medical, healthcare, and food processing. Packaged air handling units are typical in smaller buildings & commercial applications, especially rooftop units. Packaged units typically contain filters, fans, coils, and dampers in a single casing. However, custom air handling units are available in nearly any configuration a user might require. They usually have the highest quality construction and are most commonly utilized in institutional or industrial applications with very close control, high flow rates, and harsh conditions.
The end-user segment is divided into healthcare, residential, industrial, and commercial. In 2022, the commercial segment dominated the market, accounting for around 34.15% of global revenue. This growth is attributed to the increasing penetration of air conditioners and strong growth in the construction industry. Further, by 2030, the industrial segment will likely dominate the market due to the rising industrialization globally.
| Attribute | Description |
|---|---|
| Market Size | Revenue (USD Billion) |
| Market size value in 2022 | USD 12.02 Billion |
| Market size value in 2030 | USD 19.37 Billion |
| CAGR (2022 to 2030) | 6.15% |
| Historical data | 2019-2020 |
| Base Year | 2021 |
| Forecast | 2022-2030 |
| Segments | Key Segments are capacity, working principle, type, end-user, and regions |
| Regional Segments | The key regions are North America, South America, Europe, Asia Pacific, and Middle East & Africa. |
As per The Brainy Insights, the size of the air handling units market was valued at USD 12.02 billion in 2022 to USD 19.37 billion by 2030.
Global air handling units market is growing at a CAGR of 6.15% during the forecast period 2022-2030.
North America region emerged as the largest market for the air handling units.
Key players are Carrier, Trane, GEA Group, Johnson Controls, Flakt Woods, Novenco, Systemair, Ciat Group, Trox, Airedale International, Lennox, Sabiana, VTS Group, Wolf, Euroclima, and among others.
1. Introduction
1.1. Objectives of the Study
1.2. Market Definition
1.3. Research Scope
1.4. Currency
1.5. Key Target Audience
2. Research Methodology and Assumptions
3. Executive Summary
4. Premium Insights
4.1. Porter’s Five Forces Analysis
4.2. Value Chain Analysis
4.3. Top Investment Pockets
4.3.1. Market Attractiveness Analysis By Capacity
4.3.2. Market Attractiveness Analysis By Working Principle
4.3.3. Market Attractiveness Analysis By Type
4.3.4. Market Attractiveness Analysis By End-User
4.3.5. Market Attractiveness Analysis By Region
4.4. Industry Trends
5. Market Dynamics
5.1. Market Evaluation
5.2. Drivers
5.2.1. The growing manufacturing of new automobiles
5.2.2. The rising data centres
5.2.3. The rapidly growing hospitality sector across the globe
5.2.4. The increasing demand for energy-efficient products
5.3. Restraints
5.3.1. The fluctuating raw material prices
5.3.2. The lack of awareness about the benefits of HVAC systems
5.4. Opportunities
5.4.1. The integration of innovative technologies such as IoT (Internet of Things) and sensors
5.4.2. The increasing advances in manufacturing technologies
1. Global Air Handling Units Market Analysis and Forecast, By Capacity
1.1. Segment Overview
1.2. Up to 5,000 m³/hr.
1.3. 5,000 m³/hr. to 15,000 m³/hr.
1.4. 15,000 m³/hr. to 30,000 m³/hr.
1.5. 30,000 m³/hr. to 50,000 m³/hr.
1.6. Above 50,000 m³/hr.
2. Global Air Handling Units Market Analysis and Forecast, By Working Principle
2.1. Segment Overview
2.2. Blow Through
2.3. Draw Through
3. Global Air Handling Units Market Analysis and Forecast, By Type
3.1. Segment Overview
3.2. Packaged
3.3. Modular
3.4. Custom
3.5. DX Integrated
4. Global Air Handling Units Market Analysis and Forecast, By End-User
5.5. Segment Overview
5.6. Healthcare
5.7. Residential
5.8. Industrial
5.9. Commercial
5. Global Air Handling Units Market Analysis and Forecast, By Regional Analysis
5.1. Segment Overview
5.2. North America
5.2.1. U.S.
5.2.2. Canada
5.2.3. Mexico
5.3. Europe
5.3.1. Germany
5.3.2. France
5.3.3. U.K.
5.3.4. Italy
5.3.5. Spain
5.4. Asia-Pacific
5.4.1. Japan
5.4.2. China
5.4.3. India
5.5. South America
5.5.1. Brazil
5.6. Middle East and Africa
5.6.1. UAE
5.6.2. South Africa
6. Global Air Handling Units Market-Competitive Landscape
6.1. Overview
6.2. Market Share of Key Players in Global Air Handling Units Market
6.2.1. Global Company Market Share
6.2.2. North America Company Market Share
6.2.3. Europe Company Market Share
6.2.4. APAC Company Market Share
6.3. Competitive Situations and Trends
6.3.1. Product Launches and Developments
6.3.2. Partnerships, Collaborations, and Agreements
6.3.3. Mergers & Acquisitions
6.3.4. Expansions
7. Company Profiles
7.1. Carrier
7.1.1. Business Overview
7.1.2. Company Snapshot
7.1.3. Company Market Share Analysis
7.1.4. Company Product Portfolio
7.1.5. Recent Developments
7.1.6. SWOT Analysis
7.2. Trane
7.2.1. Business Overview
7.2.2. Company Snapshot
7.2.3. Company Market Share Analysis
7.2.4. Company Product Portfolio
7.2.5. Recent Developments
7.2.6. SWOT Analysis
7.3. GEA Group
7.3.1. Business Overview
7.3.2. Company Snapshot
7.3.3. Company Market Share Analysis
7.3.4. Company Product Portfolio
7.3.5. Recent Developments
7.3.6. SWOT Analysis
7.4. Johnson Controls
7.4.1. Business Overview
7.4.2. Company Snapshot
7.4.3. Company Market Share Analysis
7.4.4. Company Product Portfolio
7.4.5. Recent Developments
7.4.6. SWOT Analysis
7.5. Flakt Woods
7.5.1. Business Overview
7.5.2. Company Snapshot
7.5.3. Company Market Share Analysis
7.5.4. Company Product Portfolio
7.5.5. Recent Developments
7.5.6. SWOT Analysis
7.6. Novenco
7.6.1. Business Overview
7.6.2. Company Snapshot
7.6.3. Company Market Share Analysis
7.6.4. Company Product Portfolio
7.6.5. Recent Developments
7.6.6. SWOT Analysis
7.7. Systemair
7.7.1. Business Overview
7.7.2. Company Snapshot
7.7.3. Company Market Share Analysis
7.7.4. Company Product Portfolio
7.7.5. Recent Developments
7.7.6. SWOT Analysis
7.8. Ciat Group
7.8.1. Business Overview
7.8.2. Company Snapshot
7.8.3. Company Market Share Analysis
7.8.4. Company Product Portfolio
7.8.5. Recent Developments
7.8.6. SWOT Analysis
7.9. Trox
7.9.1. Business Overview
7.9.2. Company Snapshot
7.9.3. Company Market Share Analysis
7.9.4. Company Product Portfolio
7.9.5. Recent Developments
7.9.6. SWOT Analysis
7.10. Airedale International
7.10.1. Business Overview
7.10.2. Company Snapshot
7.10.3. Company Market Share Analysis
7.10.4. Company Product Portfolio
7.10.5. Recent Developments
7.10.6. SWOT Analysis
7.11. Lennox
7.11.1. Business Overview
7.11.2. Company Snapshot
7.11.3. Company Market Share Analysis
7.11.4. Company Product Portfolio
7.11.5. Recent Developments
7.11.6. SWOT Analysis
7.12. Sabiana
7.12.1. Business Overview
7.12.2. Company Snapshot
7.12.3. Company Market Share Analysis
7.12.4. Company Product Portfolio
7.12.5. Recent Developments
7.12.6. SWOT Analysis
7.13. VTS Group
7.13.1. Business Overview
7.13.2. Company Snapshot
7.13.3. Company Market Share Analysis
7.13.4. Company Product Portfolio
7.13.5. Recent Developments
7.13.6. SWOT Analysis
7.14. Wolf
7.14.1. Business Overview
7.14.2. Company Snapshot
7.14.3. Company Market Share Analysis
7.14.4. Company Product Portfolio
7.14.5. Recent Developments
7.14.6. SWOT Analysis
7.15. Euroclima
7.15.1. Business Overview
7.15.2. Company Snapshot
7.15.3. Company Market Share Analysis
7.15.4. Company Product Portfolio
7.15.5. Recent Developments
7.15.6. SWOT Analysis
List of Table
1. Global Air Handling Units Market, By Capacity, 2019-2030 (USD Billion)
2. Global Up to 5,000 m³/hr., Air Handling Units Market, By Region, 2019-2030 (USD Billion)
3. Global 5,000 m³/hr. to 15,000 m³/hr, Air Handling Units Market, By Region, 2019-2030 (USD Billion)
4. Global 15,000 m³/hr. to 30,000 m³/hr., Air Handling Units Market, By Region, 2019-2030 (USD Billion)
5. Global 30,000 m³/hr. to 50,000 m³/hr., Air Handling Units Market, By Region, 2019-2030 (USD Billion)
6. Global Above 50,000 m³/hr., Air Handling Units Market, By Region, 2019-2030 (USD Billion)
7. Global Air Handling Units Market, By Working Principle, 2019-2030 (USD Billion)
8. Global Blow Through, Air Handling Units Market, By Region, 2019-2030 (USD Billion)
9. Global Draw Through, Air Handling Units Market, By Region, 2019-2030 (USD Billion)
10. Global Air Handling Units Market, By Type, 2019-2030 (USD Billion)
11. Global Packaged, Air Handling Units Market, By Region, 2019-2030 (USD Billion)
12. Global Modular, Air Handling Units Market, By Region, 2019-2030 (USD Billion)
13. Global Custom, Air Handling Units Market, By Region, 2019-2030 (USD Billion)
14. Global DX Integrated, Air Handling Units Market, By Region, 2019-2030 (USD Billion)
15. Global Air Handling Units Market, By End-User, 2019-2030 (USD Billion)
16. Global Healthcare, Air Handling Units Market, By Region, 2019-2030 (USD Billion)
17. Global Residential, Air Handling Units Market, By Region, 2019-2030 (USD Billion)
18. Global Industrial, Air Handling Units Market, By Region, 2019-2030 (USD Billion)
19. Global Commercial, Air Handling Units Market, By Region, 2019-2030 (USD Billion)
20. North America Air Handling Units Market, By Capacity, 2019-2030 (USD Billion)
21. North America Air Handling Units Market, By Working Principle, 2019-2030 (USD Billion)
22. North America Air Handling Units Market, By Type, 2019-2030 (USD Billion)
23. North America Air Handling Units Market, By End-User, 2019-2030 (USD Billion)
24. U.S. Air Handling Units Market, By Capacity, 2019-2030 (USD Billion)
25. U.S. Air Handling Units Market, By Working Principle, 2019-2030 (USD Billion)
26. U.S. Air Handling Units Market, By Type, 2019-2030 (USD Billion)
27. U.S. Air Handling Units Market, By End-User, 2019-2030 (USD Billion)
28. Canada Air Handling Units Market, By Capacity, 2019-2030 (USD Billion)
29. Canada Air Handling Units Market, By Working Principle, 2019-2030 (USD Billion)
30. Canada Air Handling Units Market, By Type, 2019-2030 (USD Billion)
31. Canada Air Handling Units Market, By End-User, 2019-2030 (USD Billion)
32. Mexico Air Handling Units Market, By Capacity, 2019-2030 (USD Billion)
33. Mexico Air Handling Units Market, By Working Principle, 2019-2030 (USD Billion)
34. Mexico Air Handling Units Market, By Type, 2019-2030 (USD Billion)
35. Mexico Air Handling Units Market, By End-User, 2019-2030 (USD Billion)
36. Europe Air Handling Units Market, By Capacity, 2019-2030 (USD Billion)
37. Europe Air Handling Units Market, By Working Principle, 2019-2030 (USD Billion)
38. Europe Air Handling Units Market, By Type, 2019-2030 (USD Billion)
39. Europe Air Handling Units Market, By End-User, 2019-2030 (USD Billion)
40. Germany Air Handling Units Market, By Capacity, 2019-2030 (USD Billion)
41. Germany Air Handling Units Market, By Working Principle, 2019-2030 (USD Billion)
42. Germany Air Handling Units Market, By Type, 2019-2030 (USD Billion)
43. Germany Air Handling Units Market, By End-User, 2019-2030 (USD Billion)
44. France Air Handling Units Market, By Capacity, 2019-2030 (USD Billion)
45. France Air Handling Units Market, By Working Principle, 2019-2030 (USD Billion)
46. France Air Handling Units Market, By Type, 2019-2030 (USD Billion)
47. France Air Handling Units Market, By End-User, 2019-2030 (USD Billion)
48. U.K. Air Handling Units Market, By Capacity, 2019-2030 (USD Billion)
49. U.K. Air Handling Units Market, By Working Principle, 2019-2030 (USD Billion)
50. U.K. Air Handling Units Market, By Type, 2019-2030 (USD Billion)
51. U.K. Air Handling Units Market, By End-User, 2019-2030 (USD Billion)
52. Italy Air Handling Units Market, By Capacity, 2019-2030 (USD Billion)
53. Italy Air Handling Units Market, By Working Principle, 2019-2030 (USD Billion)
54. Italy Air Handling Units Market, By Type, 2019-2030 (USD Billion)
55. Italy Air Handling Units Market, By End-User, 2019-2030 (USD Billion)
56. Spain Air Handling Units Market, By Capacity, 2019-2030 (USD Billion)
57. Spain Air Handling Units Market, By Working Principle, 2019-2030 (USD Billion)
58. Spain Air Handling Units Market, By Type, 2019-2030 (USD Billion)
59. Spain Air Handling Units Market, By End-User, 2019-2030 (USD Billion)
60. Asia Pacific Air Handling Units Market, By Capacity, 2019-2030 (USD Billion)
61. Asia Pacific Air Handling Units Market, By Working Principle, 2019-2030 (USD Billion)
62. Asia Pacific Air Handling Units Market, By Type, 2019-2030 (USD Billion)
63. Asia Pacific Air Handling Units Market, By End-User, 2019-2030 (USD Billion)
64. Japan Air Handling Units Market, By Capacity, 2019-2030 (USD Billion)
65. Japan Air Handling Units Market, By Working Principle, 2019-2030 (USD Billion)
66. Japan Air Handling Units Market, By Type, 2019-2030 (USD Billion)
67. Japan Air Handling Units Market, By End-User, 2019-2030 (USD Billion)
68. China Air Handling Units Market, By Capacity, 2019-2030 (USD Billion)
69. China Air Handling Units Market, By Working Principle, 2019-2030 (USD Billion)
70. China Air Handling Units Market, By Type, 2019-2030 (USD Billion)
71. China Air Handling Units Market, By End-User, 2019-2030 (USD Billion)
72. India Air Handling Units Market, By Capacity, 2019-2030 (USD Billion)
73. India Air Handling Units Market, By Working Principle, 2019-2030 (USD Billion)
74. India Air Handling Units Market, By Type, 2019-2030 (USD Billion)
75. India Air Handling Units Market, By End-User, 2019-2030 (USD Billion)
76. South America Air Handling Units Market, By Capacity, 2019-2030 (USD Billion)
77. South America Air Handling Units Market, By Working Principle, 2019-2030 (USD Billion)
78. South America Air Handling Units Market, By Type, 2019-2030 (USD Billion)
79. South America Air Handling Units Market, By End-User, 2019-2030 (USD Billion)
80. Brazil Air Handling Units Market, By Capacity, 2019-2030 (USD Billion)
81. Brazil Air Handling Units Market, By Working Principle, 2019-2030 (USD Billion)
82. Brazil Air Handling Units Market, By Type, 2019-2030 (USD Billion)
83. Brazil Air Handling Units Market, By End-User, 2019-2030 (USD Billion)
84. Middle East and Africa Air Handling Units Market, By Capacity, 2019-2030 (USD Billion)
85. Middle East and Africa Air Handling Units Market, By Working Principle, 2019-2030 (USD Billion)
86. Middle East and Africa Air Handling Units Market, By Type, 2019-2030 (USD Billion)
87. Middle East and Africa Air Handling Units Market, By End-User, 2019-2030 (USD Billion)
88. UAE Air Handling Units Market, By Capacity, 2019-2030 (USD Billion)
89. UAE Air Handling Units Market, By Working Principle, 2019-2030 (USD Billion)
90. UAE Air Handling Units Market, By Type, 2019-2030 (USD Billion)
91. UAE Air Handling Units Market, By End-User, 2019-2030 (USD Billion)
92. South Africa Air Handling Units Market, By Capacity, 2019-2030 (USD Billion)
93. South Africa Air Handling Units Market, By Working Principle, 2019-2030 (USD Billion)
94. South Africa Air Handling Units Market, By Type, 2019-2030 (USD Billion)
95. South Africa Air Handling Units Market, By End-User, 2019-2030 (USD Billion)
List of Figures
1. Global Air Handling Units Market Segmentation
2. Global Air Handling Units Market: Research Methodology
3. Market Size Estimation Methodology: Bottom-Up Approach
4. Market Size Estimation Methodology: Top-Down Approach
5. Data Triangulation
6. Porter’s Five Forces Analysis
7. Value Chain Analysis
8. Global Air Handling Units Market Attractiveness Analysis By Capacity
9. Global Air Handling Units Market Attractiveness Analysis By Working Principle
10. Global Air Handling Units Market Attractiveness Analysis By Type
11. Global Air Handling Units Market Attractiveness Analysis By End-User
12. Global Air Handling Units Market Attractiveness Analysis By Region
13. Global Air Handling Units Market: Dynamics
14. Global Air Handling Units Market Share By Capacity (2022 & 2030)
15. Global Air Handling Units Market Share By Working Principle (2022 & 2030)
16. Global Air Handling Units Market Share By Type (2022 & 2030)
17. Global Air Handling Units Market Share By End-User (2022 & 2030)
18. Global Air Handling Units Market Share By Regions (2022 & 2030)
19. Global Air Handling Units Market Share By Company (2021)
This study forecasts revenue at global, regional, and country levels from 2019 to 2030. The Brainy Insights has segmented the global air handling units based on below mentioned segments:
Global Air Handling Units Market by Capacity:
Global Air Handling Units Market by Working Principle:
Global Air Handling Units Market by Type:
Global Air Handling Units Market by End-User:
Global Air Handling Units by Region:
Research has its special purpose to undertake marketing efficiently. In this competitive scenario, businesses need information across all industry verticals; the information about customer wants, market demand, competition, industry trends, distribution channels etc. This information needs to be updated regularly because businesses operate in a dynamic environment. Our organization, The Brainy Insights incorporates scientific and systematic research procedures in order to get proper market insights and industry analysis for overall business success. The analysis consists of studying the market from a miniscule level wherein we implement statistical tools which helps us in examining the data with accuracy and precision.
Our research reports feature both; quantitative and qualitative aspects for any market. Qualitative information for any market research process are fundamental because they reveal the customer needs and wants, usage and consumption for any product/service related to a specific industry. This in turn aids the marketers/investors in knowing certain perceptions of the customers. Qualitative research can enlighten about the different product concepts and designs along with unique service offering that in turn, helps define marketing problems and generate opportunities. On the other hand, quantitative research engages with the data collection process through interviews, e-mail interactions, surveys and pilot studies. Quantitative aspects for the market research are useful to validate the hypotheses generated during qualitative research method, explore empirical patterns in the data with the help of statistical tools, and finally make the market estimations.
The Brainy Insights offers comprehensive research and analysis, based on a wide assortment of factual insights gained through interviews with CXOs and global experts and secondary data from reliable sources. Our analysts and industry specialist assume vital roles in building up statistical tools and analysis models, which are used to analyse the data and arrive at accurate insights with exceedingly informative research discoveries. The data provided by our organization have proven precious to a diverse range of companies, facilitating them to address issues such as determining which products/services are the most appealing, whether or not customers use the product in the manner anticipated, the purchasing intentions of the market and many others.
Our research methodology encompasses an idyllic combination of primary and secondary initiatives. Key phases involved in this process are listed below:

The phase involves the gathering and collecting of market data and its related information with the help of different sources & research procedures.

The data procurement stage involves in data gathering and collecting through various data sources.
This stage involves in extensive research. These data sources includes:
Purchased Database: Purchased databases play a crucial role in estimating the market sizes irrespective of the domain. Our purchased database includes:
Primary Research: The Brainy Insights interacts with leading companies and experts of the concerned domain to develop the analyst team’s market understanding and expertise. It improves and substantiates every single data presented in the market reports. Primary research mainly involves in telephonic interviews, E-mail interactions and face-to-face interviews with the raw material providers, manufacturers/producers, distributors, & independent consultants. The interviews that we conduct provides valuable data on market size and industry growth trends prevailing in the market. Our organization also conducts surveys with the various industry experts in order to gain overall insights of the industry/market. For instance, in healthcare industry we conduct surveys with the pharmacists, doctors, surgeons and nurses in order to gain insights and key information of a medical product/device/equipment which the customers are going to usage. Surveys are conducted in the form of questionnaire designed by our own analyst team. Surveys plays an important role in primary research because surveys helps us to identify the key target audiences of the market. Additionally, surveys helps to identify the key target audience engaged with the market. Our survey team conducts the survey by targeting the key audience, thus gaining insights from them. Based on the perspectives of the customers, this information is utilized to formulate market strategies. Moreover, market surveys helps us to understand the current competitive situation of the industry. To be precise, our survey process typically involve with the 360 analysis of the market. This analytical process begins by identifying the prospective customers for a product or service related to the market/industry to obtain data on how a product/service could fit into customers’ lives.

Secondary Research: The secondary data sources includes information published by the on-profit organizations such as World bank, WHO, company fillings, investor presentations, annual reports, national government documents, statistical databases, blogs, articles, white papers and others. From the annual report, we analyse a company’s revenue to understand the key segment and market share of that organization in a particular region. We analyse the company websites and adopt the product mapping technique which is important for deriving the segment revenue. In the product mapping method, we select and categorize the products offered by the companies catering to domain specific market, deduce the product revenue for each of the companies so as to get overall estimation of the market size. We also source data and analyses trends based on information received from supply side and demand side intermediaries in the value chain. The supply side denotes the data gathered from supplier, distributor, wholesaler and the demand side illustrates the data gathered from the end customers for respective market domain.

The supply side for a domain specific market is analysed by:
The demand side for the market is estimated through:
In-house Library: Apart from these third-party sources, we have our in-house library of qualitative and quantitative information. Our in-house database includes market data for various industry and domains. These data are updated on regular basis as per the changing market scenario. Our library includes, historic databases, internal audit reports and archives.
Sometimes there are instances where there is no metadata or raw data available for any domain specific market. For those cases, we use our expertise to forecast and estimate the market size in order to generate comprehensive data sets. Our analyst team adopt a robust research technique in order to produce the estimates:
Data Synthesis: This stage involves the analysis & mapping of all the information obtained from the previous step. It also involves in scrutinizing the data for any discrepancy observed while data gathering related to the market. The data is collected with consideration to the heterogeneity of sources. Robust scientific techniques are in place for synthesizing disparate data sets and provide the essential contextual information that can orient market strategies. The Brainy Insights has extensive experience in data synthesis where the data passes through various stages:


Market Deduction & Formulation: The final stage comprises of assigning data points at appropriate market spaces so as to deduce feasible conclusions. Analyst perspective & subject matter expert based holistic form of market sizing coupled with industry analysis also plays a crucial role in this stage.
This stage involves in finalization of the market size and numbers that we have collected from data integration step. With data interpolation, it is made sure that there is no gap in the market data. Successful trend analysis is done by our analysts using extrapolation techniques, which provide the best possible forecasts for the market.
Data Validation & Market Feedback: Validation is the most important step in the process. Validation & re-validation via an intricately designed process helps us finalize data-points to be used for final calculations.

The Brainy Insights interacts with leading companies and experts of the concerned domain to develop the analyst team’s market understanding and expertise. It improves and substantiates every single data presented in the market reports. The data validation interview and discussion panels are typically composed of the most experienced industry members. The participants include, however, are not limited to:
Moreover, we always validate our data and findings through primary respondents from all the major regions we are working on.


Free Customization
Fortune 500 Clients
Free Yearly Update On Purchase Of Multi/Corporate License
Companies Served Till Date