- +1-315-215-1633
- sales@thebrainyinsights.com

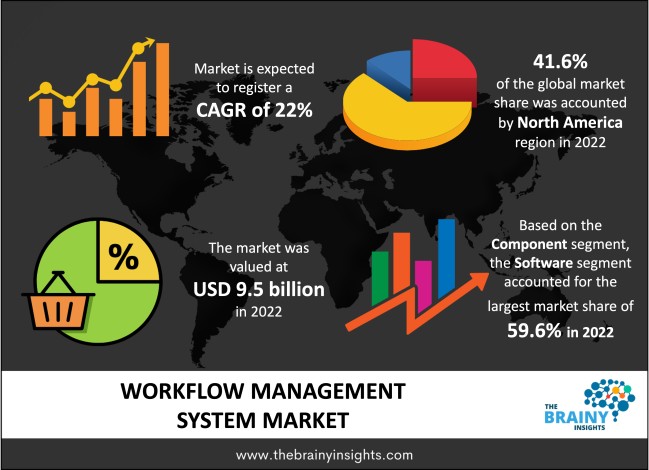
The global workflow management system market is expected to reach USD 69.3 billion by 2032, at a CAGR of 22% during the forecast period 2023 to 2032. Asia Pacific is expected to grow the fastest during the forecast period.
Workforce management (WFM) is a set of tools and processes that allow a company to monitor and centralize data for human resource use. It contains a variety of performance-based software and technologies designed to improve the efficiency of corporate management, front-line supervisors, managers, and workers throughout the company. It can handle various tasks, including HR administration, labour forecasting and scheduling, and workforce analysis. It can also generate customized workflows that boost productivity and improve decision-making efficiency. As a result, it is widely used in various industries, including financial services, banking and insurance (BFSI), transportation and logistics, healthcare, retail, information technology (IT), and telecommunications. One of the important reasons driving market expansion is the growing requirement for automation across sectors and the increasing acceptance of cloud-based solutions. With a growing emphasis on workforce optimization, firms are heavily utilizing WFM solutions to manage time and reduce task duplication. Furthermore, cloud-based solutions reduce the need for physical hardware, increasing the use of these solutions in businesses. The platform saves overall operational expenses and improves infrastructure scalability by giving access to numerous endpoints. Furthermore, increased smartphone adoption and the prevalent Bring-Your-Own-Devices (BYOD) trend positively impact market growth.
Get an overview of this study by requesting a free sample
Rapid investment due to rising usage of workflow management- Organizational demand for workflow software drives rapid Investment in developing more efficient software. Artificial intelligence and emerging technologies, such as computer vision, cognitive automation, and machine learning, are becoming increasingly popular. This convergence of technology results in automation capabilities that significantly increase customer business value and competitive advantages. In June 2021, Ericsson's Mobility study estimated 580 million 5G subscriptions by the end of 2021; by 2026, there might be 3.5 billion 5G subscriptions, driving the expansion of IoT devices. North America is predicted to have the most significant proportion of 5G subscriptions of any area, totalling 84% in 2026.
High cost- The high implementation costs and difficulty integrating new and legacy systems through workflows are projected to hamper industry expansion. Employees need more awareness to challenge the workflow management system market over the forecast period.
Rising demand for workflow software- Organizational demand for workflow software drives rapid Investment in developing more sophisticated and efficient software. According to the Pulse and Workato State of Automation Report 2021, 64% of business leaders at enterprise firms aim to create automation that focuses on improving employee experience over the next two years.
Privacy concerns- Workflow automation can expose users' data. As a result, the automation security process is crucial. RPA bots frequently work with sensitive data, transferring it from one system to another. If data is not protected, it can be exploited, costing firms millions of dollars.
The regions analyzed for the market include North America, Europe, South America, Asia Pacific, the Middle East, and Africa. North America emerged as the largest global workflow management system market, with a 41.6% market revenue share in 2022.
North America dominates the workflow management system market with a 41.6% market revenue share in 2022. The growing number of technology startups in North America and the widespread usage of ERP, CRM, and cloud services are likely to fuel the growth of the regional workflow management systems market throughout the forecast period. Furthermore, investors in the United States and Canada are offering to fund startups producing workflow management software and services. Governments and other enterprises are incorporating these solutions into their operations because they allow the timely delivery of essential content to consumers while providing high security. For example, in July 2019, Monday.com, a workflow management platform provider based in New York and Tel Aviv, raised USD 150 million in Series D funding.
Asia Pacific is expected to witness the fastest growth during the forecast period. As competition in the Chinese market has increased, different industries have improved workflow through digital transformation. Dongfeng Nissan, for example, launched a digital transformation to boost productivity and accelerate the launch of a new vehicle line. The organization initiated its digital transformation strategy to promote better data utilization, intending to improve existing workflows, streamline internal business operations, and increase overall efficiency. The organization used UiPath robotic process automation (RPA) software as part of the program to automate repetitive digital processes.
North America Region Workflow Management System Market Share in 2022 - 41.6%
www.thebrainyinsights.com
Check the geographical analysis of this market by requesting a free sample
The component segment is divided into service and software. The software segment dominated the market, with a share of around 59.6% in 2022. Workflow management software's capacity to eliminate iterative work processes, which diminish productivity, and modify traditional workflows bodes well for the segment's growth. Workflow management software has the potential to automate procedures and aid in decision-making. Workflow is the efficient flow of information and tasks through a business process. Workflow management software may often examine and improve operations at each stage as part of attempts to adequately balance the burden for attaining short-term goals and redefining sections of workflow processes in the long run.
The vertical segment is divided into transportation, BFSI, IoT, healthcare, retail, and others. The IoT segment dominated the market, with a market share of around 37.9% in 2022. The expanding applications and business models and lowering device costs are driving IoT adoption. As a result, the number of connected devices is increasing (connected cars, machines, meters, wearable, and consumer electronics). The rapid implementation of Industry 4.0 rules in the manufacturing sector resulted in a new generation of process automation. Workflow automation is gradually replacing traditional SOPs. Owing to the rising use of mobility and BYOD rules, everything in the world is now connected to networks, from sensors and machinery in manufacturing environments to cars and kitchen devices.
The deployment segment is divided into on-premise and cloud. The cloud segment dominated the market, with a share of around 56.8% in 2022. The rising use of mobile devices and developments in information-sharing technology can be linked to the expansion of the cloud segment. Big enterprises with many locations often prefer to work on the same database and choose cloud-based servers. Cloud applications are more accessible to deploy than traditional software since they do not require any upfront installation and have fewer integration requirements. The service provider's cloud apps are regularly updated, patched with the most stable version, and supported with ongoing technical assistance.
| Attribute | Description |
|---|---|
| Market Size | Revenue (USD Billion) |
| Market size value in 2022 | USD 9.5 billion |
| Market size value in 2032 | USD 69.3 billion |
| CAGR (2023 to 2032) | 22% |
| Historical data | 2019-2021 |
| Base Year | 2022 |
| Forecast | 2023-2032 |
| Regional Segments | North America, Asia Pacific, Europe, Latin America, Middle East and Africa |
| Segments | Component, Vertical, Deployment |
As per The Brainy Insights, the size of the workflow management system market was valued at USD 9.5 billion in 2022 to USD 69.3 billion by 2032.
The global workflow management system market is growing at a CAGR of 22% during the forecast period 2023-2032.
North America emerged as the largest workflow management system market.
1. Introduction
1.1. Objectives of the Study
1.2. Market Definition
1.3. Research Scope
1.4. Currency
1.5. Key Target Audience
2. Research Methodology and Assumptions
3. Executive Summary
4. Premium Insights
4.1. Porter’s Five Forces Analysis
4.2. Value Chain Analysis
4.3. Top Investment Pockets
4.3.1. Market Attractiveness Analysis by Component
4.3.2. Market Attractiveness Analysis by Vertical
4.3.3. Market Attractiveness Analysis by Deployment
4.3.4. Market Attractiveness Analysis by Region
4.4. Industry Trends
5. Market Dynamics
5.1. Market Evaluation
5.2. Drivers
5.2.1. Rapid investment due to rising usage of workflow management
5.3. Restraints
5.3.1. High cost
5.4. Opportunities
5.4.1. Rising demand for workflow software
5.5. Challenges
5.5.1. Privacy concerns
6. Global Workflow Management System Market Analysis and Forecast, By Component
6.1. Segment Overview
6.2. Service
6.3. Software
7. Global Workflow Management System Market Analysis and Forecast, By Vertical
7.1. Segment Overview
7.2. Transportation
7.3. BFSI
7.4. IoT
7.5. Healthcare
7.6. Retail
7.7. Others
8. Global Workflow Management System Market Analysis and Forecast, By Deployment
8.1. Segment Overview
8.2. On-Premise
8.3. Cloud
9. Global Workflow Management System Market Analysis and Forecast, By Regional Analysis
9.1. Segment Overview
9.2. North America
9.2.1. U.S.
9.2.2. Canada
9.2.3. Mexico
9.3. Europe
9.3.1. Germany
9.3.2. France
9.3.3. U.K.
9.3.4. Italy
9.3.5. Spain
9.4. Asia-Pacific
9.4.1. Japan
9.4.2. China
9.4.3. India
9.5. South America
9.5.1. Brazil
9.6. Middle East and Africa
9.6.1. UAE
9.6.2. South Africa
10. Global Workflow Management System Market-Competitive Landscape
10.1. Overview
10.2. Market Share of Key Players in Global Workflow Management System Market
10.2.1. Global Company Market Share
10.2.2. North America Company Market Share
10.2.3. Europe Company Market Share
10.2.4. APAC Company Market Share
10.3. Competitive Situations and Trends
10.3.1. Product Launches and Developments
10.3.2. Partnerships, Collaborations, and Agreements
10.3.3. Mergers & Acquisitions
10.3.4. Expansions
11. Company Profiles
11.1. Appian
11.1.1. Business Overview
11.1.2. Company Snapshot
11.1.3. Company Market Share Analysis
11.1.4. Company Product Portfolio
11.1.5. Recent Developments
11.1.6. SWOT Analysis
11.2. Bizagi
11.2.1. Business Overview
11.2.2. Company Snapshot
11.2.3. Company Market Share Analysis
11.2.4. Company Product Portfolio
11.2.5. Recent Developments
11.2.6. SWOT Analysis
11.3. Newgen Component Technologies Limited
11.3.1. Business Overview
11.3.2. Company Snapshot
11.3.3. Company Market Share Analysis
11.3.4. Company Product Portfolio
11.3.5. Recent Developments
11.3.6. SWOT Analysis
11.4. Pegasystems Inc.
11.4.1. Business Overview
11.4.2. Company Snapshot
11.4.3. Company Market Share Analysis
11.4.4. Company Product Portfolio
11.4.5. Recent Developments
11.4.6. SWOT Analysis
11.5. International Business Machines Corporation
11.5.1. Business Overview
11.5.2. Company Snapshot
11.5.3. Company Market Share Analysis
11.5.4. Company Product Portfolio
11.5.5. Recent Developments
11.5.6. SWOT Analysis
11.6. Nintex UK Ltd.
11.6.1. Business Overview
11.6.2. Company Snapshot
11.6.3. Company Market Share Analysis
11.6.4. Company Product Portfolio
11.6.5. Recent Developments
11.6.6. SWOT Analysis
11.7. Oracle Corporation
11.7.1. Business Overview
11.7.2. Company Snapshot
11.7.3. Company Market Share Analysis
11.7.4. Company Product Portfolio
11.7.5. Recent Developments
11.7.6. SWOT Analysis
11.8. Xerox Corporation
11.8.1. Business Overview
11.8.2. Company Snapshotx`
11.8.3. Company Market Share Analysis
11.8.4. Company Product Portfolio
11.8.5. Recent Developments
11.8.6. SWOT Analysis
11.9. Software AG
11.9.1. Business Overview
11.9.2. Company Snapshot
11.9.3. Company Market Share Analysis
11.9.4. Company Product Portfolio
11.9.5. Recent Developments
11.9.6. SWOT Analysis
11.10. SourceCode Technology Holdings, Inc. (K2 Component Inc.)
11.10.1. Business Overview
11.10.2. Company Snapshot
11.10.3. Company Market Share Analysis
11.10.4. Company Product Portfolio
11.10.5. Recent Developments
11.10.6. SWOT Analysis
List of Table
1. Global Workflow Management System Market, By Component, 2019-2032 (USD Billion)
2. Global Service, Workflow Management System Market, By Region, 2019-2032 (USD Billion)
3. Global Software, Workflow Management System Market, By Region, 2019-2032 (USD Billion)
4. Global Workflow Management System Market, By Vertical, 2019-2032 (USD Billion)
5. Global Transportation, Workflow Management System Market, By Region, 2019-2032 (USD Billion)
6. Global BFSI, Workflow Management System Market, By Region, 2019-2032 (USD Billion)
7. Global IoT, Workflow Management System Market, By Region, 2019-2032 (USD Billion)
8. Global Healthcare, Workflow Management System Market, By Region, 2019-2032 (USD Billion)
9. Global Retail, Workflow Management System Market, By Region, 2019-2032 (USD Billion)
10. Global Others, Workflow Management System Market, By Region, 2019-2032 (USD Billion)
11. Global Workflow Management System Market, By Deployment, 2019-2032 (USD Billion)
12. Global On-Premise, Workflow Management System Market, By Region, 2019-2032 (USD Billion)
13. Global Cloud, Workflow Management System Market, By Region, 2019-2032 (USD Billion)
14. North America Workflow Management System Market, By Component, 2019-2032 (USD Billion)
15. North America Workflow Management System Market, By Vertical, 2019-2032 (USD Billion)
16. North America Workflow Management System Market, By Deployment, 2019-2032 (USD Billion)
17. U.S. Workflow Management System Market, By Component, 2019-2032 (USD Billion)
18. U.S. Workflow Management System Market, By Vertical, 2019-2032 (USD Billion)
19. U.S. Workflow Management System Market, By Deployment, 2019-2032 (USD Billion)
20. Canada Workflow Management System Market, By Component, 2019-2032 (USD Billion)
21. Canada Workflow Management System Market, By Vertical, 2019-2032 (USD Billion)
22. Canada Workflow Management System Market, By Deployment, 2019-2032 (USD Billion)
23. Mexico Workflow Management System Market, By Component, 2019-2032 (USD Billion)
24. Mexico Workflow Management System Market, By Vertical, 2019-2032 (USD Billion)
25. Mexico Workflow Management System Market, By Deployment, 2019-2032 (USD Billion)
26. Europe Workflow Management System Market, By Component, 2019-2032 (USD Billion)
27. Europe Workflow Management System Market, By Vertical, 2019-2032 (USD Billion)
28. Europe Workflow Management System Market, By Deployment, 2019-2032 (USD Billion)
29. Germany Workflow Management System Market, By Component, 2019-2032 (USD Billion)
30. Germany Workflow Management System Market, By Vertical, 2019-2032 (USD Billion)
31. Germany Workflow Management System Market, By Deployment, 2019-2032 (USD Billion)
32. France Workflow Management System Market, By Component, 2019-2032 (USD Billion)
33. France Workflow Management System Market, By Vertical, 2019-2032 (USD Billion)
34. France Workflow Management System Market, By Deployment, 2019-2032 (USD Billion)
35. U.K. Workflow Management System Market, By Component, 2019-2032 (USD Billion)
36. U.K. Workflow Management System Market, By Vertical, 2019-2032 (USD Billion)
37. U.K. Workflow Management System Market, By Deployment, 2019-2032 (USD Billion)
38. Italy Workflow Management System Market, By Component, 2019-2032 (USD Billion)
39. Italy Workflow Management System Market, By Vertical, 2019-2032 (USD Billion)
40. Italy Workflow Management System Market, By Deployment, 2019-2032 (USD Billion)
41. Spain Workflow Management System Market, By Component, 2019-2032 (USD Billion)
42. Spain Workflow Management System Market, By Vertical, 2019-2032 (USD Billion)
43. Spain Workflow Management System Market, By Deployment, 2019-2032 (USD Billion)
44. Asia Pacific Workflow Management System Market, By Component, 2019-2032 (USD Billion)
45. Asia Pacific Workflow Management System Market, By Vertical, 2019-2032 (USD Billion)
46. Asia Pacific Workflow Management System Market, By Deployment, 2019-2032 (USD Billion)
47. Japan Workflow Management System Market, By Component, 2019-2032 (USD Billion)
48. Japan Workflow Management System Market, By Vertical, 2019-2032 (USD Billion)
49. Japan Workflow Management System Market, By Deployment, 2019-2032 (USD Billion)
50. China Workflow Management System Market, By Component, 2019-2032 (USD Billion)
51. China Workflow Management System Market, By Vertical, 2019-2032 (USD Billion)
52. China Workflow Management System Market, By Deployment, 2019-2032 (USD Billion)
53. India Workflow Management System Market, By Component, 2019-2032 (USD Billion)
54. India Workflow Management System Market, By Vertical, 2019-2032 (USD Billion)
55. India Workflow Management System Market, By Deployment, 2019-2032 (USD Billion)
56. South America Workflow Management System Market, By Component, 2019-2032 (USD Billion)
57. South America Workflow Management System Market, By Vertical, 2019-2032 (USD Billion)
58. South America Workflow Management System Market, By Deployment, 2019-2032 (USD Billion)
59. Brazil Workflow Management System Market, By Component, 2019-2032 (USD Billion)
60. Brazil Workflow Management System Market, By Vertical, 2019-2032 (USD Billion)
61. Brazil Workflow Management System Market, By Deployment, 2019-2032 (USD Billion)
62. Middle East and Africa Workflow Management System Market, By Component, 2019-2032 (USD Billion)
63. Middle East and Africa Workflow Management System Market, By Vertical, 2019-2032 (USD Billion)
64. Middle East and Africa Workflow Management System Market, By Deployment, 2019-2032 (USD Billion)
65. UAE Workflow Management System Market, By Component, 2019-2032 (USD Billion)
66. UAE Workflow Management System Market, By Vertical, 2019-2032 (USD Billion)
67. UAE Workflow Management System Market, By Deployment, 2019-2032 (USD Billion)
68. South Africa Workflow Management System Market, By Component, 2019-2032 (USD Billion)
69. South Africa Workflow Management System Market, By Vertical, 2019-2032 (USD Billion)
70. South Africa Workflow Management System Market, By Deployment, 2019-2032 (USD Billion)
List of Figures
1. Global Workflow Management System Market Segmentation
2. Global Workflow Management System Market: Research Methodology
3. Market Size Estimation Methodology: Bottom-Up Approach
4. Market Size Estimation Methodology: Top-Down Approach
5. Data Triangulation
6. Porter’s Five Forces Analysis
7. Value Chain Analysis
8. Global Workflow Management System Market Attractiveness Analysis by Component
9. Global Workflow Management System Market Attractiveness Analysis by Vertical
10. Global Workflow Management System Market Attractiveness Analysis by Deployment
11. Global Workflow Management System Market Attractiveness Analysis by Region
12. Global Workflow Management System Market: Dynamics
13. Global Workflow Management System Market Share by Component (2023 & 2032)
14. Global Workflow Management System Market Share by Vertical (2023 & 2032)
15. Global Workflow Management System Market Share by Deployment (2023 & 2032)
16. Global Workflow Management System Market Share by Regions (2023 & 2032)
17. Global Workflow Management System Market Share by Company (2022)
This study forecasts global, regional, and country revenue from 2019 to 2032. The Brainy Insights has segmented the global workflow management system market based on the below-mentioned segments:
Global Workflow Management System Market By Component:
Global Workflow Management System Market By Vertical:
Global Workflow Management System Market By Deployment:
Global Workflow Management System Market By Region:
Research has its special purpose to undertake marketing efficiently. In this competitive scenario, businesses need information across all industry verticals; the information about customer wants, market demand, competition, industry trends, distribution channels etc. This information needs to be updated regularly because businesses operate in a dynamic environment. Our organization, The Brainy Insights incorporates scientific and systematic research procedures in order to get proper market insights and industry analysis for overall business success. The analysis consists of studying the market from a miniscule level wherein we implement statistical tools which helps us in examining the data with accuracy and precision.
Our research reports feature both; quantitative and qualitative aspects for any market. Qualitative information for any market research process are fundamental because they reveal the customer needs and wants, usage and consumption for any product/service related to a specific industry. This in turn aids the marketers/investors in knowing certain perceptions of the customers. Qualitative research can enlighten about the different product concepts and designs along with unique service offering that in turn, helps define marketing problems and generate opportunities. On the other hand, quantitative research engages with the data collection process through interviews, e-mail interactions, surveys and pilot studies. Quantitative aspects for the market research are useful to validate the hypotheses generated during qualitative research method, explore empirical patterns in the data with the help of statistical tools, and finally make the market estimations.
The Brainy Insights offers comprehensive research and analysis, based on a wide assortment of factual insights gained through interviews with CXOs and global experts and secondary data from reliable sources. Our analysts and industry specialist assume vital roles in building up statistical tools and analysis models, which are used to analyse the data and arrive at accurate insights with exceedingly informative research discoveries. The data provided by our organization have proven precious to a diverse range of companies, facilitating them to address issues such as determining which products/services are the most appealing, whether or not customers use the product in the manner anticipated, the purchasing intentions of the market and many others.
Our research methodology encompasses an idyllic combination of primary and secondary initiatives. Key phases involved in this process are listed below:

The phase involves the gathering and collecting of market data and its related information with the help of different sources & research procedures.

The data procurement stage involves in data gathering and collecting through various data sources.
This stage involves in extensive research. These data sources includes:
Purchased Database: Purchased databases play a crucial role in estimating the market sizes irrespective of the domain. Our purchased database includes:
Primary Research: The Brainy Insights interacts with leading companies and experts of the concerned domain to develop the analyst team’s market understanding and expertise. It improves and substantiates every single data presented in the market reports. Primary research mainly involves in telephonic interviews, E-mail interactions and face-to-face interviews with the raw material providers, manufacturers/producers, distributors, & independent consultants. The interviews that we conduct provides valuable data on market size and industry growth trends prevailing in the market. Our organization also conducts surveys with the various industry experts in order to gain overall insights of the industry/market. For instance, in healthcare industry we conduct surveys with the pharmacists, doctors, surgeons and nurses in order to gain insights and key information of a medical product/device/equipment which the customers are going to usage. Surveys are conducted in the form of questionnaire designed by our own analyst team. Surveys plays an important role in primary research because surveys helps us to identify the key target audiences of the market. Additionally, surveys helps to identify the key target audience engaged with the market. Our survey team conducts the survey by targeting the key audience, thus gaining insights from them. Based on the perspectives of the customers, this information is utilized to formulate market strategies. Moreover, market surveys helps us to understand the current competitive situation of the industry. To be precise, our survey process typically involve with the 360 analysis of the market. This analytical process begins by identifying the prospective customers for a product or service related to the market/industry to obtain data on how a product/service could fit into customers’ lives.

Secondary Research: The secondary data sources includes information published by the on-profit organizations such as World bank, WHO, company fillings, investor presentations, annual reports, national government documents, statistical databases, blogs, articles, white papers and others. From the annual report, we analyse a company’s revenue to understand the key segment and market share of that organization in a particular region. We analyse the company websites and adopt the product mapping technique which is important for deriving the segment revenue. In the product mapping method, we select and categorize the products offered by the companies catering to domain specific market, deduce the product revenue for each of the companies so as to get overall estimation of the market size. We also source data and analyses trends based on information received from supply side and demand side intermediaries in the value chain. The supply side denotes the data gathered from supplier, distributor, wholesaler and the demand side illustrates the data gathered from the end customers for respective market domain.

The supply side for a domain specific market is analysed by:
The demand side for the market is estimated through:
In-house Library: Apart from these third-party sources, we have our in-house library of qualitative and quantitative information. Our in-house database includes market data for various industry and domains. These data are updated on regular basis as per the changing market scenario. Our library includes, historic databases, internal audit reports and archives.
Sometimes there are instances where there is no metadata or raw data available for any domain specific market. For those cases, we use our expertise to forecast and estimate the market size in order to generate comprehensive data sets. Our analyst team adopt a robust research technique in order to produce the estimates:
Data Synthesis: This stage involves the analysis & mapping of all the information obtained from the previous step. It also involves in scrutinizing the data for any discrepancy observed while data gathering related to the market. The data is collected with consideration to the heterogeneity of sources. Robust scientific techniques are in place for synthesizing disparate data sets and provide the essential contextual information that can orient market strategies. The Brainy Insights has extensive experience in data synthesis where the data passes through various stages:


Market Deduction & Formulation: The final stage comprises of assigning data points at appropriate market spaces so as to deduce feasible conclusions. Analyst perspective & subject matter expert based holistic form of market sizing coupled with industry analysis also plays a crucial role in this stage.
This stage involves in finalization of the market size and numbers that we have collected from data integration step. With data interpolation, it is made sure that there is no gap in the market data. Successful trend analysis is done by our analysts using extrapolation techniques, which provide the best possible forecasts for the market.
Data Validation & Market Feedback: Validation is the most important step in the process. Validation & re-validation via an intricately designed process helps us finalize data-points to be used for final calculations.

The Brainy Insights interacts with leading companies and experts of the concerned domain to develop the analyst team’s market understanding and expertise. It improves and substantiates every single data presented in the market reports. The data validation interview and discussion panels are typically composed of the most experienced industry members. The participants include, however, are not limited to:
Moreover, we always validate our data and findings through primary respondents from all the major regions we are working on.


Free Customization
Fortune 500 Clients
Free Yearly Update On Purchase Of Multi/Corporate License
Companies Served Till Date