- +1-315-215-1633
- sales@thebrainyinsights.com

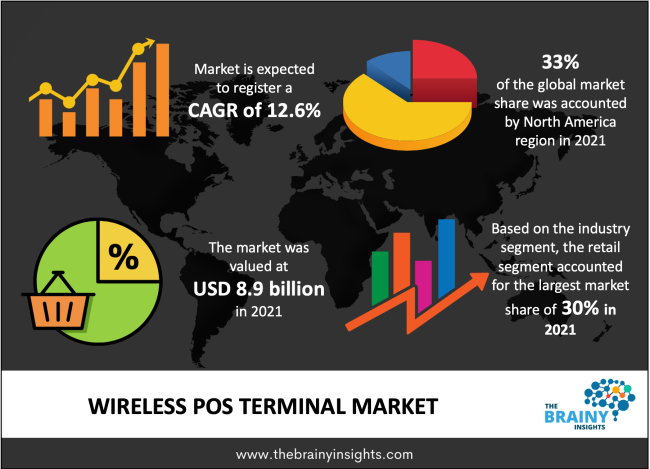
The global wireless POS terminal market is expected to reach USD 25.8 billion by 2030, at a CAGR of 12.6 during the forecast period 2022 to 2030. The market is anticipated to be driven by the increasing adopting mobile POS (mPOS) terminals to accept contactless payments directly through customers' smartphones. Mobile wireless POS terminals' rising popularity has opened up new opportunities for market expansion.
A wireless POS terminal is a digital device that allows businesses to conduct transactions in online mode. It can be performed using wireless devices like smartphones, laptops or tablets. It is very simple and easy to use. Customers can pay using credit and debit cards as the terminal wirelessly connects to the payment processor. This point-of-sale (POS) terminal hardware system allows processing of card payments at retail locations. It includes software that reads magnetic strips from credit and debit cards. Wireless POS terminals enable users to accept alternative payment methods; thus, it helps businesses collect more with this comfortable method. This is convenient for both parties, the seller and the buyer. This method uses 3G technologies to enable restaurants, retailers and others to make payments with its various payment options. This method is preferred in restaurants and locations with smaller seats because of its portability feature. It helps in capturing more sales.
Get an overview of this study by requesting a free sample
The growing demand for cashless and faster transactions drives the wireless POS terminal market growth. With the passing days, more retailers are adopting wireless terminals. As the E-commerce market is growing, people prefer to make payments online. The government's ongoing efforts to encourage a cashless economy are another factor driving market growth. Credit card and debit card usability is increasing daily, permitting wireless POS terminals. An increasing number of installations of MPOS systems is making it easier for service providers to complete any financial transaction, so this method is preferred nowadays.
There are many security issues associated with the wireless POS terminal industry. Many confidential data are at risk in case of any cyber-attack. A high cost of maintenance is required for the system to function. The devices needed for installing the wireless POS terminal are being adopted at a prolonged rate which is a major factor restraining the market growth. The cost of maintenance of this system is very high. It needs tight security as digital methods are always subject to spam. The transactions require reliable internet connectivity.
This method is easily accessible on mobiles and laptops and is cost-effective. The mobility nature capacity of the wireless POS terminal market is helping the need to evolve more. As this system discards transaction fraud and conducts secure online payments, the demand for wireless POS terminals for retail applications is growing. The more advanced processes like proper invoice systems, discount offers, inventory management systems, data backup, and customer database maintenance make this POS terminal method preferable to retailers with their more comfortable operating and transaction features, creating opportunities for the wireless POS terminal market to grow.
The software upgrade is costly, so adopting the system becomes complicated. A reliable internet connection is usually required while making any web-based payments. The businesses needed a security deposit in the form of monthly subscriptions to ensure digital protection protocols. These fees decrease the return on investment. There are many hardware issues involved in software-based payments. Customers who use credit and debit cards while buying their data on the card are at risk, as digital payments always carry some risk.
The global wireless POS terminal market has been segmented based on component, type, industry and regions.
The regions analyzed for the wireless POS terminal market include North America, Europe, South America, Asia Pacific, the Middle East, and Africa. North America emerged as the largest market for the global Wireless POS terminal market, with a 33% share of the market revenue in 2021.
North America Region Wireless POS Terminal Market Share in 2021 - 33%
www.thebrainyinsights.com
Check the geographical analysis of this market by requesting a free sample
The key players are now concentrating on implementing strategies such as adopting new applications, product innovations, mergers & acquisitions, joint ventures, alliances, and partnerships to improve their market position in the global wireless POS terminal market industry.
As per The Brainy Insights, the size of the Wireless POS Terminal market was valued at USD 8.9 billion in 2022 to USD 25.8 billion by 2030.
The global Wireless POS Terminal market is growing at a CAGR of 12.6% during the forecast period 2022-2030.
North America emerged as the largest market for Wireless POS terminals.
Key players in the Wireless POS Terminal market are Ingenico, Verifon, First Data, PAX Global technology, NCR Corporation, Diebold Nixdorf, BBPOS, Elavon, Castles Technology, and Winpos.
1. Introduction
1.1. Objectives of the Study
1.2. Market Definition
1.3. Research Scope
1.4. Currency
1.5. Key Target Audience
2. Research Methodology and Assumptions
3. Executive Summary
4. Premium Insights
4.1. Porter’s Five Forces Analysis
4.2. Value Chain Analysis
4.3. Top Investment Pockets
4.3.1. Market Attractiveness Analysis By Component
4.3.2. Market Attractiveness Analysis By Type
4.3.3. Market Attractiveness Analysis By Industry
4.3.4. Market Attractiveness Analysis By Region
4.4. Industry Trends
5. Market Dynamics
5.1. Market Evaluation
5.1.1. Drivers faster and cashless transactions
5.2. Restraints
5.2.1. Security issues and slow rate of adoption
5.3. Opportunities
5.3.1. Easily accessible method
5.4. Challenges
5.4.1. Expensive charges of maintenance
1. Global Wireless POS Terminal Market Analysis and Forecast, By Component
1.1. Segment Overview
1.2. Hardware
1.3. Software
2. Global Wireless POS Terminal Market Analysis and Forecast, By Type
2.1. Segment Overview
2.2. Portable Countertop & Pin Card
2.3. MPOS
2.4. Smart POS
2.5. Others
3. Global Wireless POS Terminal Market Analysis and Forecast, By Industry
3.1. Segment Overview
3.2. Retail
3.3. Healthcare
3.4. Hospitality
3.5. Others
4. Global Wireless POS Terminal Market Analysis and Forecast, By Regional Analysis
4.1. Segment Overview
4.2. North America
4.2.1. U.S.
4.2.2. Canada
4.2.3. Mexico
4.3. Europe
4.3.1. Germany
4.3.2. France
4.3.3. U.K.
4.3.4. Italy
4.3.5. Spain
4.4. Asia-Pacific
4.4.1. Japan
4.4.2. China
4.4.3. India
4.5. South America
4.5.1. Brazil
4.6. Middle East and Africa
4.6.1. UAE
4.6.2. South Africa
5. Global Wireless POS Terminal Market-Competitive Landscape
5.1. Overview
5.2. Market Share of Key Players in Global Wireless POS Terminal Market
5.2.1. Global Company Market Share
5.2.2. North America Company Market Share
5.2.3. Europe Company Market Share
5.2.4. APAC Company Market Share
5.3. Competitive Situations and Trends
5.3.1. Product Launches and Developments
5.3.2. Partnerships, Collaborations, and Agreements
5.3.3. Mergers & Acquisitions
5.3.4. Expansions
6. Company Profiles
6.1. Ingenico
6.1.1. Business Overview
6.1.2. Company Snapshot
6.1.3. Company Market Share Analysis
6.1.4. Company Product Portfolio
6.1.5. Recent Developments
6.1.6. SWOT Analysis
6.2. Verifon
6.2.1. Business Overview
6.2.2. Company Snapshot
6.2.3. Company Market Share Analysis
6.2.4. Company Product Portfolio
6.2.5. Recent Developments
6.2.6. SWOT Analysis
6.3. First Data
6.3.1. Business Overview
6.3.2. Company Snapshot
6.3.3. Company Market Share Analysis
6.3.4. Company Product Portfolio
6.3.5. Recent Developments
6.3.6. SWOT Analysis
6.4. PAX Global Technology
6.4.1. Business Overview
6.4.2. Company Snapshot
6.4.3. Company Market Share Analysis
6.4.4. Company Product Portfolio
6.4.5. Recent Developments
6.4.6. SWOT Analysis
6.5. NCR Corporation
6.5.1. Business Overview
6.5.2. Company Snapshot
6.5.3. Company Market Share Analysis
6.5.4. Company Product Portfolio
6.5.5. Recent Developments
6.5.6. SWOT Analysis
6.6. Diebold Nixdorf
6.6.1. Business Overview
6.6.2. Company Snapshot
6.6.3. Company Market Share Analysis
6.6.4. Company Product Portfolio
6.6.5. Recent Developments
6.6.6. SWOT Analysis
6.7. BBPOS
6.7.1. Business Overview
6.7.2. Company Snapshot
6.7.3. Company Market Share Analysis
6.7.4. Company Product Portfolio
6.7.5. Recent Developments
6.7.6. SWOT Analysis
6.8. Elavon
6.8.1. Business Overview
6.8.2. Company Snapshot
6.8.3. Company Market Share Analysis
6.8.4. Company Product Portfolio
6.8.5. Recent Developments
6.8.6. SWOT Analysis
6.9. Castles Technology
6.9.1. Business Overview
6.9.2. Company Snapshot
6.9.3. Company Market Share Analysis
6.9.4. Company Product Portfolio
6.9.5. Recent Developments
6.9.6. SWOT Analysis
6.10. Winpos
6.10.1. Business Overview
6.10.2. Company Snapshot
6.10.3. Company Market Share Analysis
6.10.4. Company Product Portfolio
6.10.5. Recent Developments
6.10.6. SWOT Analysis
List of Table
1. Global Wireless POS Terminal Market, By Component, 2019-2030 (USD Billion)
2. Global Hardware, Wireless POS Terminal Market, By Region, 2019-2030 (USD Billion)
3. Global Software, Wireless POS Terminal Market, By Region, 2019-2030 (USD Billion)
4. Global Wireless POS Terminal Market, By Type, 2019-2030 (USD Billion)
5. Global Portable Countertop & Pin Card, Wireless POS Terminal Market, By Region, 2019-2030 (USD Billion)
6. Global MPOS, Wireless POS Terminal Market, By Region, 2019-2030 (USD Billion)
7. Global Smart POS, Wireless POS Terminal Market, By Region, 2019-2030 (USD Billion)
8. Global Others, Wireless POS Terminal Market, By Region, 2019-2030 (USD Billion)
9. Global Wireless POS Terminal Market, By Industry, 2019-2030 (USD Billion)
10. Global Retail, Wireless POS Terminal Market, By Region, 2019-2030 (USD Billion)
11. Global Healthcare, Wireless POS Terminal Market, By Region, 2019-2030 (USD Billion)
12. Global Hospitality, Wireless POS Terminal Market, By Region, 2019-2030 (USD Billion)
13. Global Others, Wireless POS Terminal Market, By Region, 2019-2030 (USD Billion)
14. North America Wireless POS Terminal Market, By Component, 2019-2030 (USD Billion)
15. North America Wireless POS Terminal Market, By Type, 2019-2030 (USD Billion)
16. North America Wireless POS Terminal Market, By Industry, 2019-2030 (USD Billion)
17. U.S. Wireless POS Terminal Market, By Component, 2019-2030 (USD Billion)
18. U.S. Wireless POS Terminal Market, By Type, 2019-2030 (USD Billion)
19. U.S. Wireless POS Terminal Market, By Industry, 2019-2030 (USD Billion)
20. Canada Wireless POS Terminal Market, By Component, 2019-2030 (USD Billion)
21. Canada Wireless POS Terminal Market, By Type, 2019-2030 (USD Billion)
22. Canada Wireless POS Terminal Market, By Industry, 2019-2030 (USD Billion)
23. Mexico Wireless POS Terminal Market, By Component, 2019-2030 (USD Billion)
24. Mexico Wireless POS Terminal Market, By Type, 2019-2030 (USD Billion)
25. Mexico Wireless POS Terminal Market, By Industry, 2019-2030 (USD Billion)
26. Europe Wireless POS Terminal Market, By Component, 2019-2030 (USD Billion)
27. Europe Wireless POS Terminal Market, By Type, 2019-2030 (USD Billion)
28. Europe Wireless POS Terminal Market, By Industry, 2019-2030 (USD Billion)
29. Germany Wireless POS Terminal Market, By Component, 2019-2030 (USD Billion)
30. Germany Wireless POS Terminal Market, By Type, 2019-2030 (USD Billion)
31. Germany Wireless POS Terminal Market, By Industry, 2019-2030 (USD Billion)
32. France Wireless POS Terminal Market, By Component, 2019-2030 (USD Billion)
33. France Wireless POS Terminal Market, By Type, 2019-2030 (USD Billion)
34. France Wireless POS Terminal Market, By Industry, 2019-2030 (USD Billion)
35. U.K. Wireless POS Terminal Market, By Component, 2019-2030 (USD Billion)
36. U.K. Wireless POS Terminal Market, By Type, 2019-2030 (USD Billion)
37. U.K. Wireless POS Terminal Market, By Industry, 2019-2030 (USD Billion)
38. Italy Wireless POS Terminal Market, By Component, 2019-2030 (USD Billion)
39. Italy Wireless POS Terminal Market, By Type, 2019-2030 (USD Billion)
40. Italy Wireless POS Terminal Market, By Industry, 2019-2030 (USD Billion)
41. Spain Wireless POS Terminal Market, By Component, 2019-2030 (USD Billion)
42. Spain Wireless POS Terminal Market, By Type, 2019-2030 (USD Billion)
43. Spain Wireless POS Terminal Market, By Industry, 2019-2030 (USD Billion)
44. Asia Pacific Wireless POS Terminal Market, By Component, 2019-2030 (USD Billion)
45. Asia Pacific Wireless POS Terminal Market, By Type, 2019-2030 (USD Billion)
46. Asia Pacific Wireless POS Terminal Market, By Industry, 2019-2030 (USD Billion)
47. Japan Wireless POS Terminal Market, By Component, 2019-2030 (USD Billion)
48. Japan Wireless POS Terminal Market, By Type, 2019-2030 (USD Billion)
49. Japan Wireless POS Terminal Market, By Industry, 2019-2030 (USD Billion)
50. China Wireless POS Terminal Market, By Component, 2019-2030 (USD Billion)
51. China Wireless POS Terminal Market, By Type, 2019-2030 (USD Billion)
52. China Wireless POS Terminal Market, By Industry, 2019-2030 (USD Billion)
53. India Wireless POS Terminal Market, By Component, 2019-2030 (USD Billion)
54. India Wireless POS Terminal Market, By Type, 2019-2030 (USD Billion)
55. India Wireless POS Terminal Market, By Industry, 2019-2030 (USD Billion)
56. South America Wireless POS Terminal Market, By Component, 2019-2030 (USD Billion)
57. South America Wireless POS Terminal Market, By Type, 2019-2030 (USD Billion)
58. South America Wireless POS Terminal Market, By Industry, 2019-2030 (USD Billion)
59. Brazil Wireless POS Terminal Market, By Component, 2019-2030 (USD Billion)
60. Brazil Wireless POS Terminal Market, By Type, 2019-2030 (USD Billion)
61. Brazil Wireless POS Terminal Market, By Industry, 2019-2030 (USD Billion)
62. Middle East and Africa Wireless POS Terminal Market, By Component, 2019-2030 (USD Billion)
63. Middle East and Africa Wireless POS Terminal Market, By Type, 2019-2030 (USD Billion)
64. Middle East and Africa Wireless POS Terminal Market, By Industry, 2019-2030 (USD Billion)
65. UAE Wireless POS Terminal Market, By Component, 2019-2030 (USD Billion)
66. UAE Wireless POS Terminal Market, By Type, 2019-2030 (USD Billion)
67. UAE Wireless POS Terminal Market, By Industry, 2019-2030 (USD Billion)
68. South Africa Wireless POS Terminal Market, By Component, 2019-2030 (USD Billion)
69. South Africa Wireless POS Terminal Market, By Type, 2019-2030 (USD Billion)
70. South Africa Wireless POS Terminal Market, By Industry, 2019-2030 (USD Billion)
List of Figures
1. Global Wireless POS Terminal Market Segmentation
2. Global Wireless POS Terminal Market: Research Methodology
3. Market Size Estimation Methodology: Bottom-Up Approach
4. Market Size Estimation Methodology: Top-Down Approach
5. Data Triangulation
6. Porter’s Five Forces Analysis
7. Value Chain Analysis
8. Global Wireless POS Terminal Market Attractiveness Analysis By Component
9. Global Wireless POS Terminal Market Attractiveness Analysis By Type
10. Global Wireless POS Terminal Market Attractiveness Analysis By Industry
11. Global Wireless POS Terminal Market Attractiveness Analysis By Region
12. Global Wireless POS Terminal Market: Dynamics
13. Global Wireless POS Terminal Market Share By Component (2022 & 2030)
14. Global Wireless POS Terminal Market Share By Type (2022 & 2030)
15. Global Wireless POS Terminal Market Share By Industry (2022 & 2030)
16. Global Wireless POS Terminal Market Share By Regions (2022 & 2030)
17. Global Wireless POS Terminal Market Share By Company (2021)
This study forecasts global, regional, and country revenue from 2019 to 2030. Brainy Insights has segmented the global wireless POS terminal market based on the below-mentioned segments:
Global Wireless POS Terminal Market by Component:
Global Wireless POS Terminal Market by Type:
Global Wireless POS Terminal Market by Industry:
Global Wireless POS Terminal Market by Region:
Research has its special purpose to undertake marketing efficiently. In this competitive scenario, businesses need information across all industry verticals; the information about customer wants, market demand, competition, industry trends, distribution channels etc. This information needs to be updated regularly because businesses operate in a dynamic environment. Our organization, The Brainy Insights incorporates scientific and systematic research procedures in order to get proper market insights and industry analysis for overall business success. The analysis consists of studying the market from a miniscule level wherein we implement statistical tools which helps us in examining the data with accuracy and precision.
Our research reports feature both; quantitative and qualitative aspects for any market. Qualitative information for any market research process are fundamental because they reveal the customer needs and wants, usage and consumption for any product/service related to a specific industry. This in turn aids the marketers/investors in knowing certain perceptions of the customers. Qualitative research can enlighten about the different product concepts and designs along with unique service offering that in turn, helps define marketing problems and generate opportunities. On the other hand, quantitative research engages with the data collection process through interviews, e-mail interactions, surveys and pilot studies. Quantitative aspects for the market research are useful to validate the hypotheses generated during qualitative research method, explore empirical patterns in the data with the help of statistical tools, and finally make the market estimations.
The Brainy Insights offers comprehensive research and analysis, based on a wide assortment of factual insights gained through interviews with CXOs and global experts and secondary data from reliable sources. Our analysts and industry specialist assume vital roles in building up statistical tools and analysis models, which are used to analyse the data and arrive at accurate insights with exceedingly informative research discoveries. The data provided by our organization have proven precious to a diverse range of companies, facilitating them to address issues such as determining which products/services are the most appealing, whether or not customers use the product in the manner anticipated, the purchasing intentions of the market and many others.
Our research methodology encompasses an idyllic combination of primary and secondary initiatives. Key phases involved in this process are listed below:

The phase involves the gathering and collecting of market data and its related information with the help of different sources & research procedures.

The data procurement stage involves in data gathering and collecting through various data sources.
This stage involves in extensive research. These data sources includes:
Purchased Database: Purchased databases play a crucial role in estimating the market sizes irrespective of the domain. Our purchased database includes:
Primary Research: The Brainy Insights interacts with leading companies and experts of the concerned domain to develop the analyst team’s market understanding and expertise. It improves and substantiates every single data presented in the market reports. Primary research mainly involves in telephonic interviews, E-mail interactions and face-to-face interviews with the raw material providers, manufacturers/producers, distributors, & independent consultants. The interviews that we conduct provides valuable data on market size and industry growth trends prevailing in the market. Our organization also conducts surveys with the various industry experts in order to gain overall insights of the industry/market. For instance, in healthcare industry we conduct surveys with the pharmacists, doctors, surgeons and nurses in order to gain insights and key information of a medical product/device/equipment which the customers are going to usage. Surveys are conducted in the form of questionnaire designed by our own analyst team. Surveys plays an important role in primary research because surveys helps us to identify the key target audiences of the market. Additionally, surveys helps to identify the key target audience engaged with the market. Our survey team conducts the survey by targeting the key audience, thus gaining insights from them. Based on the perspectives of the customers, this information is utilized to formulate market strategies. Moreover, market surveys helps us to understand the current competitive situation of the industry. To be precise, our survey process typically involve with the 360 analysis of the market. This analytical process begins by identifying the prospective customers for a product or service related to the market/industry to obtain data on how a product/service could fit into customers’ lives.

Secondary Research: The secondary data sources includes information published by the on-profit organizations such as World bank, WHO, company fillings, investor presentations, annual reports, national government documents, statistical databases, blogs, articles, white papers and others. From the annual report, we analyse a company’s revenue to understand the key segment and market share of that organization in a particular region. We analyse the company websites and adopt the product mapping technique which is important for deriving the segment revenue. In the product mapping method, we select and categorize the products offered by the companies catering to domain specific market, deduce the product revenue for each of the companies so as to get overall estimation of the market size. We also source data and analyses trends based on information received from supply side and demand side intermediaries in the value chain. The supply side denotes the data gathered from supplier, distributor, wholesaler and the demand side illustrates the data gathered from the end customers for respective market domain.

The supply side for a domain specific market is analysed by:
The demand side for the market is estimated through:
In-house Library: Apart from these third-party sources, we have our in-house library of qualitative and quantitative information. Our in-house database includes market data for various industry and domains. These data are updated on regular basis as per the changing market scenario. Our library includes, historic databases, internal audit reports and archives.
Sometimes there are instances where there is no metadata or raw data available for any domain specific market. For those cases, we use our expertise to forecast and estimate the market size in order to generate comprehensive data sets. Our analyst team adopt a robust research technique in order to produce the estimates:
Data Synthesis: This stage involves the analysis & mapping of all the information obtained from the previous step. It also involves in scrutinizing the data for any discrepancy observed while data gathering related to the market. The data is collected with consideration to the heterogeneity of sources. Robust scientific techniques are in place for synthesizing disparate data sets and provide the essential contextual information that can orient market strategies. The Brainy Insights has extensive experience in data synthesis where the data passes through various stages:


Market Deduction & Formulation: The final stage comprises of assigning data points at appropriate market spaces so as to deduce feasible conclusions. Analyst perspective & subject matter expert based holistic form of market sizing coupled with industry analysis also plays a crucial role in this stage.
This stage involves in finalization of the market size and numbers that we have collected from data integration step. With data interpolation, it is made sure that there is no gap in the market data. Successful trend analysis is done by our analysts using extrapolation techniques, which provide the best possible forecasts for the market.
Data Validation & Market Feedback: Validation is the most important step in the process. Validation & re-validation via an intricately designed process helps us finalize data-points to be used for final calculations.

The Brainy Insights interacts with leading companies and experts of the concerned domain to develop the analyst team’s market understanding and expertise. It improves and substantiates every single data presented in the market reports. The data validation interview and discussion panels are typically composed of the most experienced industry members. The participants include, however, are not limited to:
Moreover, we always validate our data and findings through primary respondents from all the major regions we are working on.


Free Customization
Fortune 500 Clients
Free Yearly Update On Purchase Of Multi/Corporate License
Companies Served Till Date