- +1-315-215-1633
- sales@thebrainyinsights.com

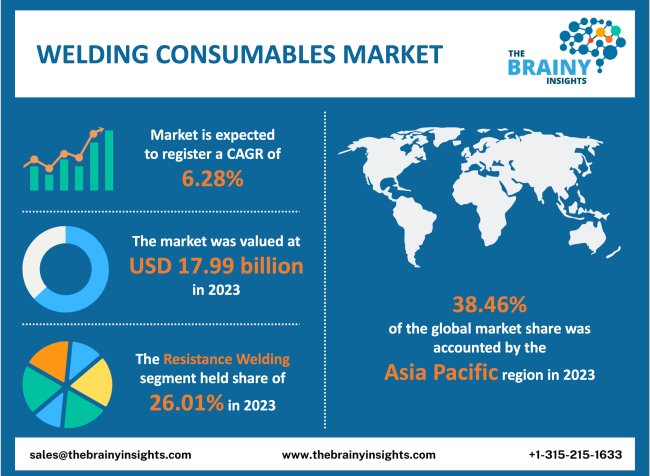
The global welding consumables market was valued at USD 17.99 billion in 2023 and growing at a CAGR of 6.28% from 2023 to 2031. The market is expected to reach USD 29.29 billion by 2031. Europe is expected to increase the fastest during the forecast period.
Metals used as flux and fillers during the welding process are referred to as welding consumables. While flux stops the oxidation of hot metals in this process, filler metals are melted to forge a solid connection between the two metals. Aluminium, rutile, nickel, copper, and ilmenite are basic materials used to manufacture welding consumables. These consumables make welding more affordable, help protect the molten weld from airborne pollutants, and stop the weld pool from becoming porous. They are, therefore, widely used in the building, aerospace, automotive, shipbuilding, and energy industries. Thermoplastics and metals are joined by welding during the coalescence procedure. Due to its effectiveness and affordability, it is frequently chosen anytime joints are needed. To stop the hot metals from oxidizing in the weld pool, flux is usually employed to create a gas shield. To create a solid joint and shield the molten weld from atmospheric containments, filler metals and flux are known as welding consumables when they melt when connecting two metals. Stick electrodes, flux-cored wires, SAW wires & fluxes, and other consumables are examples of the various varieties available. Many end-use sectors use welding, including building and construction, automotive and transportation, maritime, power generation, and oil and gas. Different end-use sectors' use of steel worldwide significantly impacts the welding industry's growth. During the welding process, consumables like stick electrodes, solid wires, SAW wires, flux-cored wires, and fluxes are used. However, flux is wasted during welding and does not make up the final component.
Get an overview of this study by requesting a free sample
Increasing usage of welding consumables in the automotive and construction sector- The fabrication of lightweight, high-quality vehicle parts in the automotive industry uses welding consumables. The sales of cars have increased due to advancements in their safety features and changing car designs, which has fueled the expansion of the welding consumables industry. Additionally, the launch of several housing and development projects has boosted the construction sector in developing nations like China, India, and South Africa. Industrialization, urbanization, technical improvements, and increased foreign direct investments (FDI) are a few more drivers promoting market expansion. The global market for welding consumables is anticipated to increase over the forecast period due to the high growth of the construction and automotive industries. One of the critical procedures in the building and automotive industries is welding, which can take many forms, including laser beam welding, resistance welding, arc welding, ultrasonic welding, and friction welding. Metals are permanently joined using these welding techniques. Additionally, welding in servicing and repairing vehicles has increased the need for welding supplies. Consumables for welding have become more popular due to industrialization and rising urbanization. So, during the projected period, the market expansion is anticipated to be fueled by the rapidly expanding construction and automotive industries.
Lack of product adoption in emerging economies- Over the projected period, the expansion of the global welding consumables market is anticipated to be constrained by the less adoption of innovative welding technologies. The market growth is expected to be somewhat constrained by the slow acceptance of modern welding techniques in developing nations like China and India. One more is the price sensitivity issue impeding market expansion in these nations. Due to their expensive cost, emerging economies have not adopted these advanced welding techniques as widely as industrialized nations. Examples include electron beams and laser beams.
The regions analyzed for the market include North America, Europe, South America, Asia Pacific, the Middle East, and Africa. Asia Pacific emerged as the highest market for the global welding consumables market, with a 38.46% share of the market revenue in 2023. This resulted from construction activities fueled by the expansion of the residential, commercial, and industrial sectors led by the continued prosperity of the region's economies, which increased the need for welding supplies. Due to the rapid expansion of the automotive industry and the region's high level of automobile manufacturing, the market for welding consumables in the Asia Pacific region has contributed to the growth. The presence of fast-developing economies like China, India, Indonesia, and Japan is anticipated to be advantageous for the region.
Asia Pacific Region Welding Consumables Market Share in 2023 - 38.46%
www.thebrainyinsights.com
Check the geographical analysis of this market by requesting a free sample
The technology segment is divided into resistance welding, laser beam welding, arc welding, oxy-fuel welding, and others. The resistance welding segment had the highest market share of 26.01% in 2023 in the welding consumables market. The automotive industry's increasing usage of resistance welding technology for various operations, including spot welding, projection welding, and seam welding, has contributed to boosting segmental growth.
However, one of the main drivers propelling the arc welding segment growth is the leading market participants' ongoing developments in arc welding technology, such as robotic arc welding. The method allows for the flexible welding of metals in various thicknesses. Market expansion is anticipated to be fueled by the expanding use of the technology across numerous applications.
The type segment is divided into solid wires, saw wires and fluxes, stick electrodes, flux-cored wires, and others. The stick electrodes segment had the highest market share of 24.75% in 2023 in the welding consumables market. Due to their capacity to boost welding strength, high corrosion resistance & tensile strength, stick electrodes are increasingly in demand for the welding of various components.
However, the weld pool reacts with saw wires and fluxes to produce high-quality metals with the desired characteristics. This encourages the use of the material in applications, including post-weld heat treatment, pressure vessels, offshore drilling platform construction, and exploration platforms. The development of the applications' expanding use of saw wires and fluxes is anticipated to encourage the market's expansion.
| Attribute | Description |
|---|---|
| Market Size | Revenue (USD Billion) |
| Market size value in 2023 | USD 17.99 Billion |
| Market size value in 2031 | USD 29.29 Billion |
| CAGR (2023 to 2031) | 6.28% |
| Historical data | 2019-2021 |
| Base Year | 2022 |
| Forecast | 2023-2031 |
| Segments | Technology, Type |
| Regional Segments | The regions analyzed for the market are Europe, Asia Pacific, North America, South America, and Middle East & Africa. |
As per The Brainy Insights, the size of the welding consumables market was valued USD 17.99 billion in 2023 & USD 29.29 billion by 2031.
Global welding consumables market is growing at a CAGR of 6.28% during the forecast period 2023-2031.
Asia Pacific region emerged as the largest market for the welding consumables.
Lack of product adoption in emerging economies could hamper the market growth.
The market's growth will be influenced by the increasing usage of welding consumables in automotive and construction sector.
1. Introduction
1.1. Objective of the Study
1.2. Market Definition
1.3. Research Scope
1.4. Currency
1.5. Key Target Audience
2. Research Methodology and Assumptions
3. Executive Summary
4. Premium Insights
4.1. Porter’s Five Forces Analysis
4.2. Value Chain Analysis
4.3. Top Investment Pockets
4.3.1. Market Attractiveness Analysis By Technology
4.3.2. Market Attractiveness Analysis By Type
4.3.3. Market Attractiveness Analysis By Region
4.4. Industry Trends
5. Market Dynamics
5.1. Market Evaluation
5.2. Drivers
5.2.1. Increasing usage of welding consumables in automotive and construction sector
5.3. Restraints
5.3.1. Lack of product adoption in emerging economies
6. Global Welding Consumables Market Analysis and Forecast, By Technology
6.1. Segment Overview
6.2. Resistance Welding
6.3. Laser Beam Welding
6.4. Arc Welding
6.5. Oxy-Fuel Welding
6.6. Others
7. Global Welding Consumables Market Analysis and Forecast, By Type
7.1. Segment Overview
7.2. Solid Wires
7.3. Saw Wires and Fluxes
7.4. Stick Electrodes
7.5. Flux-Cored Wires
7.6. Others
8. Global Welding Consumables Market Analysis and Forecast, By Regional Analysis
8.1. Segment Overview
8.2. North America
8.2.1. U.S.
8.2.2. Canada
8.2.3. Mexico
8.3. Europe
8.3.1. Germany
8.3.2. France
8.3.3. U.K.
8.3.4. Italy
8.3.5. Spain
8.4. Asia-Pacific
8.4.1. Japan
8.4.2. China
8.4.3. India
8.5. South America
8.5.1. Brazil
8.6. Middle East and Africa
8.6.1. UAE
8.6.2. South Africa
9. Global Welding Consumables Market-Competitive Landscape
9.1. Overview
9.2. Market Share of Key Players in the Welding Consumables Market
9.2.1. Global Company Market Share
9.2.2. North America Company Market Share
9.2.3. Europe Company Market Share
9.2.4. APAC Company Market Share
9.3. Competitive Situations and Trends
9.3.1. Product Launches and Developments
9.3.2. Partnerships, Collaborations, and Agreements
9.3.3. Mergers & Acquisitions
9.3.4. Expansions
10. Company Profiles
10.1. Arcon Welding Equipment
10.1.1. Business Overview
10.1.2. Company Snapshot
10.1.3. Company Market Share Analysis
10.1.4. Company Product Portfolio
10.1.5. Recent Developments
10.1.6. SWOT Analysis
10.2. Kemppi Oy
10.2.1. Business Overview
10.2.2. Company Snapshot
10.2.3. Company Market Share Analysis
10.2.4. Company Product Portfolio
10.2.5. Recent Developments
10.2.6. SWOT Analysis
10.3. Tianjin Bridge Welding Materials Co., Ltd.
10.3.1. Business Overview
10.3.2. Company Snapshot
10.3.3. Company Market Share Analysis
10.3.4. Company Product Portfolio
10.3.5. Recent Developments
10.3.6. SWOT Analysis
10.4. Fronius International GmbH
10.4.1. Business Overview
10.4.2. Company Snapshot
10.4.3. Company Market Share Analysis
10.4.4. Company Product Portfolio
10.4.5. Recent Developments
10.4.6. SWOT Analysis
10.5. Denyo Co., Ltd.
10.5.1. Business Overview
10.5.2. Company Snapshot
10.5.3. Company Market Share Analysis
10.5.4. Company Product Portfolio
10.5.5. Recent Developments
10.5.6. SWOT Analysis
10.6. Illinois Tool Works Inc.
10.6.1. Business Overview
10.6.2. Company Snapshot
10.6.3. Company Market Share Analysis
10.6.4. Company Product Portfolio
10.6.5. Recent Developments
10.6.6. SWOT Analysis
10.7. Voestalpine AG
10.7.1. Business Overview
10.7.2. Company Snapshot
10.7.3. Company Market Share Analysis
10.7.4. Company Product Portfolio
10.7.5. Recent Developments
10.7.6. SWOT Analysis
10.8. The Lincoln Electric Company
10.8.1. Business Overview
10.8.2. Company Snapshot
10.8.3. Company Market Share Analysis
10.8.4. Company Product Portfolio
10.8.5. Recent Developments
10.8.6. SWOT Analysis
10.9. Hyundai Welding Co., Ltd.
10.9.1. Business Overview
10.9.2. Company Snapshot
10.9.3. Company Market Share Analysis
10.9.4. Company Product Portfolio
10.9.5. Recent Developments
10.9.6. SWOT Analysis
10.10. Colfax Corporation
10.10.1. Business Overview
10.10.2. Company Snapshot
10.10.3. Company Market Share Analysis
10.10.4. Company Product Portfolio
10.10.5. Recent Developments
10.10.6. SWOT Analysis
10.11. Obara Corporation
10.11.1. Business Overview
10.11.2. Company Snapshot
10.11.3. Company Market Share Analysis
10.11.4. Company Product Portfolio
10.11.5. Recent Developments
10.11.6. SWOT Analysis
10.12. Air Liquide
10.12.1. Business Overview
10.12.2. Company Snapshot
10.12.3. Company Market Share Analysis
10.12.4. Company Product Portfolio
10.12.5. Recent Developments
10.12.6. SWOT Analysis
10.13. Panasonic Corporation
10.13.1. Business Overview
10.13.2. Company Snapshot
10.13.3. Company Market Share Analysis
10.13.4. Company Product Portfolio
10.13.5. Recent Developments
10.13.6. SWOT Analysis
List of Table
1. Global Welding Consumables Market, By Technology, 2019-2031 (USD Billion)
2. Global Resistance Welding, Welding Consumables Market, By Region, 2019-2031 (USD Billion)
3. Global Laser Beam Welding, Welding Consumables Market, By Region, 2019-2031 (USD Billion)
4. Global Arc Welding, Welding Consumables Market, By Region, 2019-2031 (USD Billion)
5. Global Oxy-Fuel Welding, Welding Consumables Market, By Region, 2019-2031 (USD Billion)
6. Global Others, Welding Consumables Market, By Region, 2019-2031 (USD Billion)
7. Global Welding Consumables Market, By Type, 2019-2031 (USD Billion)
8. Global Solid Wires, Welding Consumables Market, By Region, 2019-2031 (USD Billion)
9. Global Saw Wires and Fluxes, Welding Consumables Market, By Region, 2019-2031 (USD Billion)
10. Global Stick Electrodes, Welding Consumables Market, By Region, 2019-2031 (USD Billion)
11. Global Flux-Cored Wires, Welding Consumables Market, By Region, 2019-2031 (USD Billion)
12. Global Others, Welding Consumables Market, By Region, 2019-2031 (USD Billion)
13. Global Welding Consumables Market, By Region, 2019-2031 (USD Billion)
14. North America Welding Consumables Market, By Technology, 2019-2031 (USD Billion)
15. North America Welding Consumables Market, By Type, 2019-2031 (USD Billion)
16. U.S. Welding Consumables Market, By Technology, 2019-2031 (USD Billion)
17. U.S. Welding Consumables Market, By Type, 2019-2031 (USD Billion)
18. Canada Welding Consumables Market, By Technology, 2019-2031 (USD Billion)
19. Canada Welding Consumables Market, By Type, 2019-2031 (USD Billion)
20. Mexico Welding Consumables Market, By Technology, 2019-2031 (USD Billion)
21. Mexico Welding Consumables Market, By Type, 2019-2031 (USD Billion)
22. Europe Welding Consumables Market, By Technology, 2019-2031 (USD Billion)
23. Europe Welding Consumables Market, By Type, 2019-2031 (USD Billion)
24. Germany Welding Consumables Market, By Technology, 2019-2031 (USD Billion)
25. Germany Welding Consumables Market, By Type, 2019-2031 (USD Billion)
26. France Welding Consumables Market, By Technology, 2019-2031 (USD Billion)
27. France Welding Consumables Market, By Type, 2019-2031 (USD Billion)
28. U.K. Welding Consumables Market, By Technology, 2019-2031 (USD Billion)
29. U.K. Welding Consumables Market, By Type, 2019-2031 (USD Billion)
30. Italy Welding Consumables Market, By Technology, 2019-2031 (USD Billion)
31. Italy Welding Consumables Market, By Type, 2019-2031 (USD Billion)
32. Spain Welding Consumables Market, By Technology, 2019-2031 (USD Billion)
33. Spain Welding Consumables Market, By Type, 2019-2031 (USD Billion)
34. Asia Pacific Welding Consumables Market, By Technology, 2019-2031 (USD Billion)
35. Asia Pacific Welding Consumables Market, By Type, 2019-2031 (USD Billion)
36. Japan Welding Consumables Market, By Technology, 2019-2031 (USD Billion)
37. Japan Welding Consumables Market, By Type, 2019-2031 (USD Billion)
38. China Welding Consumables Market, By Technology, 2019-2031 (USD Billion)
39. China Welding Consumables Market, By Type, 2019-2031 (USD Billion)
40. India Welding Consumables Market, By Technology, 2019-2031 (USD Billion)
41. India Welding Consumables Market, By Type, 2019-2031 (USD Billion)
42. South America Welding Consumables Market, By Technology, 2019-2031 (USD Billion)
43. South America Welding Consumables Market, By Type, 2019-2031 (USD Billion)
44. Brazil Welding Consumables Market, By Technology, 2019-2031 (USD Billion)
45. Brazil Welding Consumables Market, By Type, 2019-2031 (USD Billion)
46. Middle East and Africa Welding Consumables Market, By Technology, 2019-2031 (USD Billion)
47. Middle East and Africa Welding Consumables Market, By Type, 2019-2031 (USD Billion)
48. UAE Welding Consumables Market, By Technology, 2019-2031 (USD Billion)
49. UAE Welding Consumables Market, By Type, 2019-2031 (USD Billion)
50. South Africa Welding Consumables Market, By Technology, 2019-2031 (USD Billion)
51. South Africa Welding Consumables Market, By Type, 2019-2031 (USD Billion)
List of Figures
1. Global Welding Consumables Market Segmentation
2. Welding Consumables Market: Research Methodology
3. Market Size Estimation Methodology: Bottom-Up Approach
4. Market Size Estimation Methodology: Top-Down Approach
5. Data Triangulation
6. Porter’s Five Forces Analysis
7. Value Chain Analysis
8. Global Welding Consumables Market Attractiveness Analysis By Technology
9. Global Welding Consumables Market Attractiveness Analysis By Type
10. Global Welding Consumables Market Attractiveness Analysis By Region
11. Global Welding Consumables Market: Dynamics
12. Global Welding Consumables Market Share by Technology (2023 & 2031)
13. Global Welding Consumables Market Share by Type (2023 & 2031)
14. Global Welding Consumables Market Share by Regions (2023 & 2031)
15. Global Welding Consumables Market Share by Company (2022)
This study forecasts revenue at global, regional, and country levels from 2019 to 2031. The Brainy Insights has segmented the global welding consumables market based on below mentioned segments:
Global Welding Consumables Market by Technology:
Global Welding Consumables Market by Type:
Global Welding Consumables Market by Region:
Research has its special purpose to undertake marketing efficiently. In this competitive scenario, businesses need information across all industry verticals; the information about customer wants, market demand, competition, industry trends, distribution channels etc. This information needs to be updated regularly because businesses operate in a dynamic environment. Our organization, The Brainy Insights incorporates scientific and systematic research procedures in order to get proper market insights and industry analysis for overall business success. The analysis consists of studying the market from a miniscule level wherein we implement statistical tools which helps us in examining the data with accuracy and precision.
Our research reports feature both; quantitative and qualitative aspects for any market. Qualitative information for any market research process are fundamental because they reveal the customer needs and wants, usage and consumption for any product/service related to a specific industry. This in turn aids the marketers/investors in knowing certain perceptions of the customers. Qualitative research can enlighten about the different product concepts and designs along with unique service offering that in turn, helps define marketing problems and generate opportunities. On the other hand, quantitative research engages with the data collection process through interviews, e-mail interactions, surveys and pilot studies. Quantitative aspects for the market research are useful to validate the hypotheses generated during qualitative research method, explore empirical patterns in the data with the help of statistical tools, and finally make the market estimations.
The Brainy Insights offers comprehensive research and analysis, based on a wide assortment of factual insights gained through interviews with CXOs and global experts and secondary data from reliable sources. Our analysts and industry specialist assume vital roles in building up statistical tools and analysis models, which are used to analyse the data and arrive at accurate insights with exceedingly informative research discoveries. The data provided by our organization have proven precious to a diverse range of companies, facilitating them to address issues such as determining which products/services are the most appealing, whether or not customers use the product in the manner anticipated, the purchasing intentions of the market and many others.
Our research methodology encompasses an idyllic combination of primary and secondary initiatives. Key phases involved in this process are listed below:

The phase involves the gathering and collecting of market data and its related information with the help of different sources & research procedures.

The data procurement stage involves in data gathering and collecting through various data sources.
This stage involves in extensive research. These data sources includes:
Purchased Database: Purchased databases play a crucial role in estimating the market sizes irrespective of the domain. Our purchased database includes:
Primary Research: The Brainy Insights interacts with leading companies and experts of the concerned domain to develop the analyst team’s market understanding and expertise. It improves and substantiates every single data presented in the market reports. Primary research mainly involves in telephonic interviews, E-mail interactions and face-to-face interviews with the raw material providers, manufacturers/producers, distributors, & independent consultants. The interviews that we conduct provides valuable data on market size and industry growth trends prevailing in the market. Our organization also conducts surveys with the various industry experts in order to gain overall insights of the industry/market. For instance, in healthcare industry we conduct surveys with the pharmacists, doctors, surgeons and nurses in order to gain insights and key information of a medical product/device/equipment which the customers are going to usage. Surveys are conducted in the form of questionnaire designed by our own analyst team. Surveys plays an important role in primary research because surveys helps us to identify the key target audiences of the market. Additionally, surveys helps to identify the key target audience engaged with the market. Our survey team conducts the survey by targeting the key audience, thus gaining insights from them. Based on the perspectives of the customers, this information is utilized to formulate market strategies. Moreover, market surveys helps us to understand the current competitive situation of the industry. To be precise, our survey process typically involve with the 360 analysis of the market. This analytical process begins by identifying the prospective customers for a product or service related to the market/industry to obtain data on how a product/service could fit into customers’ lives.

Secondary Research: The secondary data sources includes information published by the on-profit organizations such as World bank, WHO, company fillings, investor presentations, annual reports, national government documents, statistical databases, blogs, articles, white papers and others. From the annual report, we analyse a company’s revenue to understand the key segment and market share of that organization in a particular region. We analyse the company websites and adopt the product mapping technique which is important for deriving the segment revenue. In the product mapping method, we select and categorize the products offered by the companies catering to domain specific market, deduce the product revenue for each of the companies so as to get overall estimation of the market size. We also source data and analyses trends based on information received from supply side and demand side intermediaries in the value chain. The supply side denotes the data gathered from supplier, distributor, wholesaler and the demand side illustrates the data gathered from the end customers for respective market domain.

The supply side for a domain specific market is analysed by:
The demand side for the market is estimated through:
In-house Library: Apart from these third-party sources, we have our in-house library of qualitative and quantitative information. Our in-house database includes market data for various industry and domains. These data are updated on regular basis as per the changing market scenario. Our library includes, historic databases, internal audit reports and archives.
Sometimes there are instances where there is no metadata or raw data available for any domain specific market. For those cases, we use our expertise to forecast and estimate the market size in order to generate comprehensive data sets. Our analyst team adopt a robust research technique in order to produce the estimates:
Data Synthesis: This stage involves the analysis & mapping of all the information obtained from the previous step. It also involves in scrutinizing the data for any discrepancy observed while data gathering related to the market. The data is collected with consideration to the heterogeneity of sources. Robust scientific techniques are in place for synthesizing disparate data sets and provide the essential contextual information that can orient market strategies. The Brainy Insights has extensive experience in data synthesis where the data passes through various stages:


Market Deduction & Formulation: The final stage comprises of assigning data points at appropriate market spaces so as to deduce feasible conclusions. Analyst perspective & subject matter expert based holistic form of market sizing coupled with industry analysis also plays a crucial role in this stage.
This stage involves in finalization of the market size and numbers that we have collected from data integration step. With data interpolation, it is made sure that there is no gap in the market data. Successful trend analysis is done by our analysts using extrapolation techniques, which provide the best possible forecasts for the market.
Data Validation & Market Feedback: Validation is the most important step in the process. Validation & re-validation via an intricately designed process helps us finalize data-points to be used for final calculations.

The Brainy Insights interacts with leading companies and experts of the concerned domain to develop the analyst team’s market understanding and expertise. It improves and substantiates every single data presented in the market reports. The data validation interview and discussion panels are typically composed of the most experienced industry members. The participants include, however, are not limited to:
Moreover, we always validate our data and findings through primary respondents from all the major regions we are working on.


Free Customization
Fortune 500 Clients
Free Yearly Update On Purchase Of Multi/Corporate License
Companies Served Till Date