- +1-315-215-1633
- sales@thebrainyinsights.com

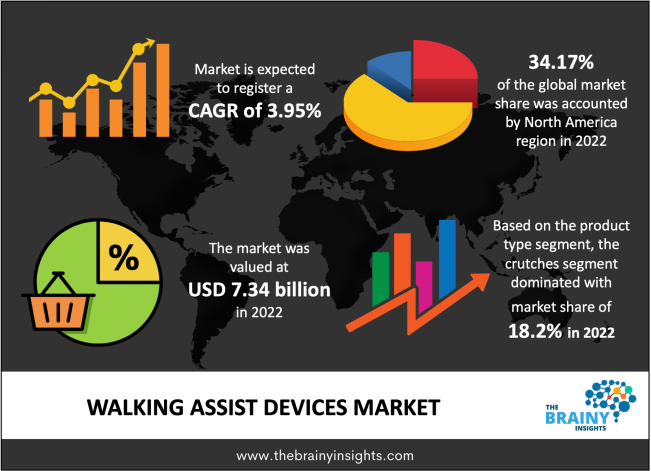
The global walking assist devices market was valued at USD 7.34 billion in 2022 and growing at a CAGR of 3.95% from 2022 to 2030. The market is expected to reach USD 9.96 billion by 2030. The global market is expected to witness expansion in the future, as there is a rise in the number of steps taken by governments of different nations to provide the availability of walking assist devices to a vast consumer base and increasing cases of Debilitating Neurological Diseases & Injuries. Additionally, the increasing technical advances & product leasing are anticipated to push the market's growth. Regardless, the cost of walking assist devices is high. Walking assist allows a person to walk effortlessly. For multiple people who become exhausted or have discomfort while walking without a device, therefore, utilizing a cane or walker can usually help them to walk further. It helps in the positive outcome of an overall increase in activity.
Assistive devices are external devices designed, made, or adapted to assist a person in executing a particular task. Numerous people with disabilities rely on assistive devices to take out daily activities and experience actively and productively in society. Walking assist devices are wearable devices that help a person's mobility. The need for walking assist devices is rapidly increasing with a broad spectrum of potential users, including the elderly and others with mobility challenges. While walking assist technologies have recently progressed remarkably the mechanical designs of walking assist devices do not sufficiently reflect the complexness of human joint articulations; most notable is the knee, which plays an essential role in human mobility. The knee joint, for humans, is a 3-D joint and is often oversimplified during walking assist design techniques. Usually modeled as a single degree of freedom joint, kinetic and kinematic incompatibilities work at the user-device interface. It limits the user's natural motion, causes pain, and lowers the device's efficiency. However, in many low-income and middle-income countries, only 4–15% of people need assistive devices and related technologies. In these countries, production is low, and often of limited quality, there is exceptionally few trained personnel, and costs may be unreasonable.
Get an overview of this study by requesting a free sample
In June 2022, CAN Mobilities created the world’s smartest walking cane to facilitate movement through data. The CAN Go an ultra-comfortable, sturdy, and sleekly designed cane hewn from aircraft-grade aluminum and sporting a non-stick, non-slip, and soft grip for enhanced safety.
In 2022, Cionic presented bionic clothes to help patients with walking problems driven by neurological disorders like Parkinson's disease, multiple sclerosis, and cerebral palsy.
Provide Maximum Support- The most important advantage a senior can avail of by using walkers is that these devices deliver maximum support to the user, particularly those with a front wheel. Without front wheels are usually taken for walking. Walkers with wheels support are now enabled with breaks, furnishing users with better help. These walking assistive devices are perfect for elders for walking long distances.
Light Weighted Devices- Doctors often advise the light weighted assistive devices walkers for older adults. Their light weight makes them more desirable among elders for additional support to perform their daily movements. Top manufacturers make these devices, particularly for aged people lacking the physical strength to move heavy mobility aids. The walkers for senior citizens in India are comfortable in moving around and making them more famous among elders.
Well-Designed Products- Walkers are usually made of unique designs in different sizes and shapes. The devices are equipped with several layers, allowing people to carry their stuff wherever they want. However, these layers cannot handle the capacity of heavy things; one can easily take the little necessary things which are required in daily routine.
High Cost of Walking Assist Devices- The most common restraining factor for people is the cost. Except for canes and crutches, walking assist devices can get relatively costly. Depending on the conditions and needs, a quality rollator and manual wheelchair cost approximately $160 to $450. Walking assist devices come with a medical-grade, self-propelling, or specialized manual wheelchair. Scooters and power wheelchairs cost thousands of dollars. However, insurance will not cover the affordable or easy-to-transport options regarding power wheelchairs and scooters.
The Investments in Robotic System Invention- High investments in robotic system invention and increasing healthcare spending are impacting the world market's development for walking assistance systems. Expanding direct-to-consumer marketing awareness and electronic commerce sales contribute to market trends for walking assistance devices. The demand for walking assistance equipment is thriving due to rapid technological progress in healthcare industries. Additionally, the walking assist devices market is predicted to increase over the future years due to most neurodegenerative diseases.
The regions analyzed for the market include North America, Europe, South America, Asia Pacific, the Middle East, and Africa. North America emerged as the largest market for the global walking assist devices market, with a 34.17% share of the market revenue in 2022.
North America is anticipated to hold a substantial market share due to the rise in the aged population, completely designed healthcare sectors, technological advances in the region and top players, and private organizations delivering various supporting services for the advantage of physically disabled people. As per the Centers for Diseases Control and Prevention, in the United States, 25% of the population, in which is 56.4 million adults, are suffering from arthritis, which is a significant reason for work impairment. The massive cases of arthritis in the United States push the walking assist devices market.
North America Region Walking Assist Devices Market Share in 2022 - 34.17%
www.thebrainyinsights.com
Check the geographical analysis of this market by requesting a free sample
The product type segment is divided into wheelchairs, canes, crutches, walker, gait belts & lift vests, and power scooters. The crutches segment dominated the market, with a market share of around 18.2% in 2022. Crutches balance a person's weight and stability while walking by decreasing the weight-bearing impact on the handicapped leg. Crutches, like canes, provide stability when walking and give a support aid in rising from a chair. The elder usually uses crutches in pairs; in medical crutches, a patient or a person can put their weight from their legs to their upper body part. In addition, 35% of people with osteoarthritis cannot carry out their major day-to-day tasks, and 75% of individuals with the disorder have mobility limitations. Thus, it is projected that additional crutch inventions and the advancement in arthritis prevalence will lead to segment growth.
The distribution channel segment is divided into offline, and online. The online segment dominated the market, with a market share of around 55.4% in 2030. The increasing importance of customers for the online platform. Market need is expected to rise during the projection period due to the enormous influence of prominent players on various online portals and sites for walking assistance devices, like mobility scooters and assistive devices, and the large quantity of available walking assistance device choices with significant discounts.
| Attribute | Description |
|---|---|
| Market Size | Revenue (USD Billion) |
| Market size value in 2022 | USD 7.34 Billion |
| Market size value in 2030 | USD 9.96 Billion |
| CAGR (2022 to 2030) | 3.95% |
| Historical data | 2019-2020 |
| Base Year | 2021 |
| Forecast | 2022-2030 |
| Segments | Product Type, Distribution Channel |
| Regional Segments | The regions analyzed for the market are North America, Asia Pacific, Europe, South America, and Middle East & Africa. Furthermore, the regions are further analyzed at the country level. |
As per The Brainy Insights, the size of the walking assist devices market was valued at USD 7.34 billion in 2022 to USD 9.96 billion by 2030.
Global walking assist devices market is growing at a CAGR of 3.95% during the forecast period 2022-2030.
The global walking assist devices market has been segmented based on product type, distribution channel, and regions. The crutches segment led the market in 2022. The online segment led the market in 2030.
North America region emerged as the largest market for the walking assist devices market.
1. Introduction
1.1. Objectives of the Study
1.2. Market Definition
1.3. Research Scope
1.4. Currency
1.5. Key Target Audience
2. Research Methodology and Assumptions
3. Executive Summary
4. Premium Insights
4.1. Porter’s Five Forces Analysis
4.2. Value Chain Analysis
4.3. Top Investment Pockets
4.3.1. Market Attractiveness Analysis by Product Type
4.3.2. Market Attractiveness Analysis by Distribution Channel
4.3.3. Market Attractiveness Analysis by Region
4.4. Industry Trends
5. Market Dynamics
5.1. Market Evaluation
5.2. Drivers
5.2.1. Provide Maximum Support
5.2.2. Light Weighted Devices
5.2.3. Well-Designed Products
5.3. Restraints
5.3.1. High Cost of Walking Assist Devices
5.4. Opportunities
5.4.1. The Investments in Robotic System Invention
6. Global Walking Assist Devices Market Analysis and Forecast, By Product Type:
6.1. Segment Overview
6.2. Wheelchairs
6.3. Canes
6.4. Crutches
6.5. Walker
6.6. Gait Belts & Lift Vests
6.7. Power Scooters
7. Global Walking Assist Devices Market Analysis and Forecast, By Distribution Channel
7.1. Segment Overview
7.2. Offline
7.3. Online
8. Global Walking Assist Devices Market Analysis and Forecast, By Regional Analysis
8.1. Segment Overview
8.2. North America
8.2.1. U.S.
8.2.2. Canada
8.2.3. Mexico
8.3. Europe
8.3.1. Germany
8.3.2. France
8.3.3. U.K.
8.3.4. Italy
8.3.5. Spain
8.4. Asia-Pacific
8.4.1. Japan
8.4.2. China
8.4.3. India
8.5. South America
8.5.1. Brazil
8.6. Middle East and Africa
8.6.1. UAE
8.6.2. South Africa
9. Global Walking Assist Devices Market-Competitive Landscape
9.1. Overview
9.2. Market Share of Key Players in the Walking Assist Devices Market
9.2.1. Global Company Market Share
9.2.2. North America Company Market Share
9.2.3. Europe Company Market Share
9.2.4. APAC Company Market Share
9.3. Competitive Situations and Trends
9.3.1. Product Launches and Developments
9.3.2. Partnerships, Collaborations, and Agreements
9.3.3. Mergers & Acquisitions
9.3.4. Expansions
10. Company Profiles
10.1. Benmor Medical
10.1.1. Business Overview
10.1.2. Company Snapshot
10.1.3. Company Market Share Analysis
10.1.4. Company Product Portfolio
10.1.5. Recent Developments
10.1.6. SWOT Analysis
10.2. Briggs Healthcare.
10.2.1. Business Overview
10.2.2. Company Snapshot
10.2.3. Company Market Share Analysis
10.2.4. Company Product Portfolio
10.2.5. Recent Developments
10.2.6. SWOT Analysis
10.3. Carex Health Brands
10.3.1. Business Overview
10.3.2. Company Snapshot
10.3.3. Company Market Share Analysis
10.3.4. Company Product Portfolio
10.3.5. Recent Developments
10.3.6. SWOT Analysis
10.4. Drive medical design
10.4.1. Business Overview
10.4.2. Company Snapshot
10.4.3. Company Market Share Analysis
10.4.4. Company Product Portfolio
10.4.5. Recent Developments
10.4.6. SWOT Analysis
10.5. Eurovema AB.
10.5.1. Business Overview
10.5.2. Company Snapshot
10.5.3. Company Market Share Analysis
10.5.4. Company Product Portfolio
10.5.5. Recent Developments
10.5.6. SWOT Analysis
10.6. GF Health Products Inc
10.6.1. Business Overview
10.6.2. Company Snapshot
10.6.3. Company Market Share Analysis
10.6.4. Company Product Portfolio
10.6.5. Recent Developments
10.6.6. SWOT Analysis
10.7. Honda Motor Co. Ltd
10.7.1. Business Overview
10.7.2. Company Snapshot
10.7.3. Company Market Share Analysis
10.7.4. Company Product Portfolio
10.7.5. Recent Developments
10.7.6. SWOT Analysis
10.8. HUMAN CARE
10.8.1. Business Overview
10.8.2. Company Snapshot
10.8.3. Company Market Share Analysis
10.8.4. Company Product Portfolio
10.8.5. Recent Developments
10.8.6. SWOT Analysis
10.9. Invacare Corporation
10.9.1. Business Overview
10.9.2. Company Snapshot
10.9.3. Company Market Share Analysis
10.9.4. Company Product Portfolio
10.9.5. Recent Developments
10.9.6. SWOT Analysis
10.10. Medline Industries Karman
10.10.1. Business Overview
10.10.2. Company Snapshot
10.10.3. Company Market Share Analysis
10.10.4. Company Product Portfolio
10.10.5. Recent Developments
10.10.6. SWOT Analysis
10.11. Ossenberg Gmbh
10.11.1. Business Overview
10.11.2. Company Snapshot
10.11.3. Company Market Share Analysis
10.11.4. Company Product Portfolio
10.11.5. Recent Developments
10.11.6. SWOT Analysis
10.12. TOPRO
10.12.1. Business Overview
10.12.2. Company Snapshot
10.12.3. Company Market Share Analysis
10.12.4. Company Product Portfolio
10.12.5. Recent Developments
10.12.6. SWOT Analysis
List of Table
1. Global Walking Assist Devices Market, By Product Type, 2019-2030 (USD Billion)
2. Global Wheelchairs Walking Assist Devices Market, By Region, 2019-2030 (USD Billion)
3. Global Canes Walking Assist Devices Market, By Region, 2019-2030 (USD Billion)
4. Global Crutches Walking Assist Devices Market, By Region, 2019-2030 (USD Billion)
5. Global Walker Walking Assist Devices Market, By Region, 2019-2030 (USD Billion)
6. Global Gait Belts & Lift Vests Walking Assist Devices Market, By Region, 2019-2030 (USD Billion)
7. Global Power Scooters Walking Assist Devices Market, By Region, 2019-2030 (USD Billion)
8. Global Walking Assist Devices Market, By Distribution Channel, 2019-2030 (USD Billion)
9. Global Offline Walking Assist Devices Market, By Region, 2019-2030 (USD Billion)
10. Global Online Walking Assist Devices Market, By Region, 2019-2030 (USD Billion)
11. North America Walking Assist Devices Market, By Product Type, 2019-2030 (USD Billion)
12. North America Walking Assist Devices Market, By Distribution Channel, 2019-2030 (USD Billion)
13. U.S. Walking Assist Devices Market, By Product Type, 2019-2030 (USD Billion)
14. U.S. Walking Assist Devices Market, By Distribution Channel, 2019-2030 (USD Billion)
15. Canada Walking Assist Devices Market, By Product Type, 2019-2030 (USD Billion)
16. Canada Walking Assist Devices Market, By Distribution Channel, 2019-2030 (USD Billion)
17. Mexico Walking Assist Devices Market, By Product Type, 2019-2030 (USD Billion)
18. Mexico Walking Assist Devices Market, By Distribution Channel, 2019-2030 (USD Billion)
19. Europe Walking Assist Devices Market, By Product Type, 2019-2030 (USD Billion)
20. Europe Walking Assist Devices Market, By Distribution Channel, 2019-2030 (USD Billion)
21. Germany Walking Assist Devices Market, By Product Type, 2019-2030 (USD Billion)
22. Germany Walking Assist Devices Market, By Distribution Channel, 2019-2030 (USD Billion)
23. France Walking Assist Devices Market, By Product Type 2019-2030 (USD Billion)
24. France Walking Assist Devices Market, By Distribution Channel, 2019-2030 (USD Billion)
25. U.K. Walking Assist Devices Market, By Product Type, 2019-2030 (USD Billion)
26. U.K. Walking Assist Devices Market, By Distribution Channel, 2019-2030 (USD Billion)
27. Italy Walking Assist Devices Market, By Product Type, 2019-2030 (USD Billion)
28. Italy Walking Assist Devices Market, By Distribution Channel, 2019-2030 (USD Billion)
29. Spain Walking Assist Devices Market, By Product Type, 2019-2030 (USD Billion)
30. Spain Walking Assist Devices Market, By Distribution Channel, 2019-2030 (USD Billion)
31. Asia Pacific Walking Assist Devices Market, By Product Type, 2019-2030 (USD Billion)
32. Asia Pacific Walking Assist Devices Market, By Distribution Channel, 2019-2030 (USD Billion)
33. Japan Walking Assist Devices Market, By Product Type, 2019-2030 (USD Billion)
34. Japan Walking Assist Devices Market, By Distribution Channel, 2019-2030 (USD Billion)
35. China Walking Assist Devices Market, By Product Type 2019-2030 (USD Billion)
36. China Walking Assist Devices Market, By Distribution Channel, 2019-2030 (USD Billion)
37. India Walking Assist Devices Market, By Product Type 2019-2030 (USD Billion)
38. India Walking Assist Devices Market, By Distribution Channel, 2019-2030 (USD Billion)
39. South America Walking Assist Devices Market, By Product Type, 2019-2030 (USD Billion)
40. South America Walking Assist Devices Market, By Distribution Channel, 2019-2030 (USD Billion)
41. Brazil Walking Assist Devices Market, By Product Type 2019-2030 (USD Billion)
42. Brazil Walking Assist Devices Market, By Distribution Channel, 2019-2030 (USD Billion)
43. Middle East and Africa Walking Assist Devices Market, By Product Type, 2019-2030 (USD Billion)
44. Middle East and Africa Walking Assist Devices Market, By Distribution Channel, 2019-2030 (USD Billion)
45. UAE Walking Assist Devices Market, By Product Type, 2019-2030 (USD Billion)
46. UAE Walking Assist Devices Market, By Distribution Channel, 2019-2030 (USD Billion)
47. South Africa Walking Assist Devices Market, By Product Type 2019-2030 (USD Billion)
48. South Africa Walking Assist Devices Market, By Distribution Channel, 2019-2030 (USD Billion)
List of Figures
1. Global Walking Assist Devices Market Segmentation
2. Walking Assist Devices Market: Research Methodology
3. Market Size Estimation Methodology: Bottom-Up Approach
4. Market Size Estimation Methodology: Top-Down Approach
5. Data Triangulation
6. Porter’s Five Forces Analysis
7. Value Chain Analysis
8. Global Walking Assist Devices Market Attractiveness Analysis by Product Type
9. Global Walking Assist Devices Market Attractiveness Analysis by Distribution Channel
10. Global Walking Assist Devices Market Attractiveness Analysis by Region
11. Global Walking Assist Devices Market: Dynamics
12. Global Walking Assist Devices Market Share by Product Type (2022 & 2030)
13. Global Walking Assist Devices Market Share by Distribution Channel (2022 & 2030)
14. Global Walking Assist Devices Market Share by Regions (2022 & 2030)
15. Global Walking Assist Devices Market Share by Company (2021)
This study forecasts revenue at global, regional, and country levels from 2019 to 2030. The Brainy Insights has segmented the global walking assist devices market based on below mentioned segments:
Global Walking Assist Devices Market Product Type:
Global Walking Assist Devices Market Distribution Channel:
Global Walking Assist Devices Market by Region:
Research has its special purpose to undertake marketing efficiently. In this competitive scenario, businesses need information across all industry verticals; the information about customer wants, market demand, competition, industry trends, distribution channels etc. This information needs to be updated regularly because businesses operate in a dynamic environment. Our organization, The Brainy Insights incorporates scientific and systematic research procedures in order to get proper market insights and industry analysis for overall business success. The analysis consists of studying the market from a miniscule level wherein we implement statistical tools which helps us in examining the data with accuracy and precision.
Our research reports feature both; quantitative and qualitative aspects for any market. Qualitative information for any market research process are fundamental because they reveal the customer needs and wants, usage and consumption for any product/service related to a specific industry. This in turn aids the marketers/investors in knowing certain perceptions of the customers. Qualitative research can enlighten about the different product concepts and designs along with unique service offering that in turn, helps define marketing problems and generate opportunities. On the other hand, quantitative research engages with the data collection process through interviews, e-mail interactions, surveys and pilot studies. Quantitative aspects for the market research are useful to validate the hypotheses generated during qualitative research method, explore empirical patterns in the data with the help of statistical tools, and finally make the market estimations.
The Brainy Insights offers comprehensive research and analysis, based on a wide assortment of factual insights gained through interviews with CXOs and global experts and secondary data from reliable sources. Our analysts and industry specialist assume vital roles in building up statistical tools and analysis models, which are used to analyse the data and arrive at accurate insights with exceedingly informative research discoveries. The data provided by our organization have proven precious to a diverse range of companies, facilitating them to address issues such as determining which products/services are the most appealing, whether or not customers use the product in the manner anticipated, the purchasing intentions of the market and many others.
Our research methodology encompasses an idyllic combination of primary and secondary initiatives. Key phases involved in this process are listed below:

The phase involves the gathering and collecting of market data and its related information with the help of different sources & research procedures.

The data procurement stage involves in data gathering and collecting through various data sources.
This stage involves in extensive research. These data sources includes:
Purchased Database: Purchased databases play a crucial role in estimating the market sizes irrespective of the domain. Our purchased database includes:
Primary Research: The Brainy Insights interacts with leading companies and experts of the concerned domain to develop the analyst team’s market understanding and expertise. It improves and substantiates every single data presented in the market reports. Primary research mainly involves in telephonic interviews, E-mail interactions and face-to-face interviews with the raw material providers, manufacturers/producers, distributors, & independent consultants. The interviews that we conduct provides valuable data on market size and industry growth trends prevailing in the market. Our organization also conducts surveys with the various industry experts in order to gain overall insights of the industry/market. For instance, in healthcare industry we conduct surveys with the pharmacists, doctors, surgeons and nurses in order to gain insights and key information of a medical product/device/equipment which the customers are going to usage. Surveys are conducted in the form of questionnaire designed by our own analyst team. Surveys plays an important role in primary research because surveys helps us to identify the key target audiences of the market. Additionally, surveys helps to identify the key target audience engaged with the market. Our survey team conducts the survey by targeting the key audience, thus gaining insights from them. Based on the perspectives of the customers, this information is utilized to formulate market strategies. Moreover, market surveys helps us to understand the current competitive situation of the industry. To be precise, our survey process typically involve with the 360 analysis of the market. This analytical process begins by identifying the prospective customers for a product or service related to the market/industry to obtain data on how a product/service could fit into customers’ lives.

Secondary Research: The secondary data sources includes information published by the on-profit organizations such as World bank, WHO, company fillings, investor presentations, annual reports, national government documents, statistical databases, blogs, articles, white papers and others. From the annual report, we analyse a company’s revenue to understand the key segment and market share of that organization in a particular region. We analyse the company websites and adopt the product mapping technique which is important for deriving the segment revenue. In the product mapping method, we select and categorize the products offered by the companies catering to domain specific market, deduce the product revenue for each of the companies so as to get overall estimation of the market size. We also source data and analyses trends based on information received from supply side and demand side intermediaries in the value chain. The supply side denotes the data gathered from supplier, distributor, wholesaler and the demand side illustrates the data gathered from the end customers for respective market domain.

The supply side for a domain specific market is analysed by:
The demand side for the market is estimated through:
In-house Library: Apart from these third-party sources, we have our in-house library of qualitative and quantitative information. Our in-house database includes market data for various industry and domains. These data are updated on regular basis as per the changing market scenario. Our library includes, historic databases, internal audit reports and archives.
Sometimes there are instances where there is no metadata or raw data available for any domain specific market. For those cases, we use our expertise to forecast and estimate the market size in order to generate comprehensive data sets. Our analyst team adopt a robust research technique in order to produce the estimates:
Data Synthesis: This stage involves the analysis & mapping of all the information obtained from the previous step. It also involves in scrutinizing the data for any discrepancy observed while data gathering related to the market. The data is collected with consideration to the heterogeneity of sources. Robust scientific techniques are in place for synthesizing disparate data sets and provide the essential contextual information that can orient market strategies. The Brainy Insights has extensive experience in data synthesis where the data passes through various stages:


Market Deduction & Formulation: The final stage comprises of assigning data points at appropriate market spaces so as to deduce feasible conclusions. Analyst perspective & subject matter expert based holistic form of market sizing coupled with industry analysis also plays a crucial role in this stage.
This stage involves in finalization of the market size and numbers that we have collected from data integration step. With data interpolation, it is made sure that there is no gap in the market data. Successful trend analysis is done by our analysts using extrapolation techniques, which provide the best possible forecasts for the market.
Data Validation & Market Feedback: Validation is the most important step in the process. Validation & re-validation via an intricately designed process helps us finalize data-points to be used for final calculations.

The Brainy Insights interacts with leading companies and experts of the concerned domain to develop the analyst team’s market understanding and expertise. It improves and substantiates every single data presented in the market reports. The data validation interview and discussion panels are typically composed of the most experienced industry members. The participants include, however, are not limited to:
Moreover, we always validate our data and findings through primary respondents from all the major regions we are working on.


Free Customization
Fortune 500 Clients
Free Yearly Update On Purchase Of Multi/Corporate License
Companies Served Till Date