- +1-315-215-1633
- sales@thebrainyinsights.com

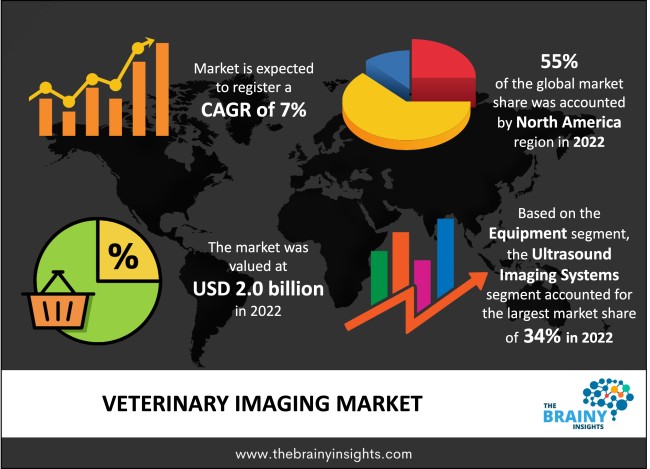
The global veterinary imaging market was valued at USD 2.0 billion in 2022, growing at a CAGR of 7% from 2023 to 2032. The market is expected to reach USD 3.93 billion by 2032. In recent years, there has been an increase in the adoption of companion and livestock animals. This is likely one of the primary drivers of the studied market's growth.
The technique and process of imaging an animal's body for clinical examination and medical intervention, as well as visual representation of the function of particular organs or tissues (physiology), is known as veterinary imaging. Veterinary imaging aims to expose internal structures that are buried beneath the skin and bones, as well as to diagnose and cure disease. Veterinary imaging also creates a database of normal anatomy and physiology, allowing abnormalities to be identified. Although medical imaging of excised organs and tissues is possible, such operations are normally classified as pathology rather than medical imaging. It is a branch of biological imaging that includes radiology, which employs imaging technologies such as X-ray radiography, magnetic resonance imaging, ultrasound, elastography, endoscopy, medical photography, tactile imaging, thermography, and nuclear medicine functional imaging techniques such as positron emission tomography (PET) and single-photon emission computed tomography (SPECT). The increased emphasis on animal health innovation, the rising need for timely diagnosis of chronic conditions, increased adoption of imaging technologies in veterinary orthopaedics, dentistry, and several other indications, and increased pet adoption and ownership rates have all contributed to increased demand for veterinary imaging. Furthermore, the increasing prevalence of zoonotic illnesses has increased the demand for effective diagnostic solutions, driving market expansion. Zoonotic infections are relatively widespread in the United States and around the world, according to statistics published in July 2021 by the National Centre for Emerging and Zoonotic Infectious Diseases (NCEZID) and the Centres for Disease Control and Prevention (CDC). According to researchers, animals are thought to transmit more than six out of ten known infections and three out of four developing infections in humans.
Get an overview of this study by requesting a free sample
In February 2022, Softneta's MedDream VET DICOM Viewer was added to Aycan Medical Systems' increasing offering of veterinary imaging. MedDream VET is an organic extension of Aycan's other solutions, built on the same DICOM standard.
In January 2022, ClariusMobile Health released its third-generation product line of high-performance, handheld wireless ultrasound scanners for veterinarians, which is 30% lighter, smaller, and pocket-sized. Because of their low cost and ease of use, handheld and tiny ultrasound equipment attract veterinary specialists.
In September 2021, Heska Corporation, a leading name in the pet care sector, announced the acquisition of Biotech Laboratories USA LL, intending to extend its product line and intellectual property to strengthen its market position.
Rising Popularity- Unlike MRIs, which require anaesthesia for animals, ultrasonography does not. The world of veterinary medicine is continually changing to satisfy the ever-increasing need for high-quality pet care. Butterfly Network, Inc., for example, debuted the new Butterfly iQ+ Vet on October 5th, 2021, bringing in the next significant transition in veterinary treatment. Sharper imagery, a new procedural guidance tool, and hardware upgrades make the solution's second iteration more powerful, adaptable, and easy to use.
High Cost- Veterinary imaging devices are quite expensive due to the numerous expensive components and innovative technology usage. This feature alone is projected to significantly impact the potential of the veterinary imaging market over the forecast period. Veterinary imaging firms invest in R&D to create more economical solutions to increase sales and earn money.
Technological Advancements- Technological advances have helped improve the quality of human life and the lives of animals that people care about. Veterinary medicine has come a long way, allowing doctors to make more accurate diagnoses and, ultimately, save animal lives. Regarding care, technology has also resulted in better outcomes for both pets and their owners. Veterinary clinics are continually being technologically improved. Modern veterinary medicine has included so many new technological breakthroughs that how pets are handled has changed. While MRIs are common among people, performing them on animals is far more complicated. As a result, ultrasonography has emerged as a potential option. The most contemporary technology enables the generation of four-dimensional images.
The regions analyzed for the market include North America, Europe, South America, Asia Pacific, the Middle East, and Africa. North America emerged as the largest global veterinary imaging market, with a 55% market revenue share in 2022.
Because of factors such as expanding pet adoption and rising per capita animal healthcare expenditure, the United States is likely to maintain its considerable market share. Furthermore, the increased occurrence of numerous animal diseases and injuries has been cited as a major factor driving market expansion. According to the North American Pet Health Insurance Association's (NAPHIA) 2021 data, the total number of pets insured in the United States by the end of 2020 was 3.1 million. This reflects the rising frequency of diagnostic exams of pets in hospitals around the country.
According to the American Pet Products Association's (APPA) 2021-2022 National Pet Owners Survey, around 70% of US households own a pet, equating to 90.5 million homes, including 45.3 million cats and 69 million dogs. According to the same source, there are 6.2 million homes in the United States with small animals. The country's high pet ownership rate is one of the primary elements driving the market's growth.
According to the American Pet Products Association's (APPA) 2021-2022 National Pet Owners Survey, an annual regular dog visit costs USD 242, while it costs USD 178 for cats in the country. Because imaging costs are insured in the country, it benefits the market under consideration. In the United States, spending on pets is rising. According to the American Pet Products Association Inc., USD 99 billion will be spent on pets in the United States in 2020.
North America Region Veterinary Imaging Market Share in 2022 - 55%
www.thebrainyinsights.com
Check the geographical analysis of this market by requesting a free sample
The equipment segment is divided into radiography (X-ray) systems, ultrasound imaging systems, computed tomography imaging systems, magnetic resonance imaging systems, video endoscopy imaging systems, and others. The ultrasound imaging systems segment dominated the market, with a market share of around 34% in 2022. Ultrasound devices are predicted to account for a sizable portion of the global veterinary imaging market. Ultrasound machines are simple to operate and give veterinarians the information they need to make swift decisions and diagnose animals faster than other equipment. As a result, vets prefer veterinary imaging the most. As a result, this category is predicted to expand during the forecast period. These devices are suitable for use in ambulances, emergency rooms, and point-of-care assessments. In addition, they give a faster reaction and immediate diagnosis than traditional ultrasound equipment, which is immobile, cumbersome, and expensive. As a result, the ultrasound scanner segment is predicted to develop in the market under consideration.
The application segment is divided into orthopaedics and traumatology, oncology, cardiology, neurology, and others. The orthopaedics and traumatology segment dominated the market, with a market share of around 40% in 2022. Orthopaedics and traumatology are clinical and experimental fields that deal with dogs and cats. It focuses on fracture treatment, joint luxation, congenital diseases, degenerative illness, and limb deformity, among other things. Several retrospective studies have been conducted to determine the prevalence of bone fracture in companion animals. A study conducted between 2013 and 2016 found that around 1,780 out of 106,286 dogs (1.67%) and 255 out of 22,258 cats (1.13%) had a bone fracture.
| Attribute | Description |
|---|---|
| Market Size | Revenue (USD Billion) |
| Market size value in 2022 | USD 2.0 Billion |
| Market size value in 2032 | USD 3.93 Billion |
| CAGR (2023 to 2032) | 7% |
| Historical data | 2019-2021 |
| Base Year | 2022 |
| Forecast | 2023-2032 |
| Region | The regions analyzed for the market are Asia Pacific, Europe, South America, North America, and Middle East & Africa. Furthermore, the regions are further analyzed at the country level. |
| Segments | Equipment, Application |
As per The Brainy Insights, the size of the veterinary imaging market was valued at USD 2.0 billion in 2022 to USD 3.93 billion by 2032.
The global veterinary imaging market is growing at a CAGR of 7% during the forecast period 2023-2032.
North America emerged as the largest veterinary imaging market.
1. Introduction
1.1. Objectives of the Study
1.2. Market Definition
1.3. Research Scope
1.4. Currency
1.5. Key Target Audience
2. Research Methodology and Assumptions
3. Executive Summary
4. Premium Insights
4.1. Porter’s Five Forces Analysis
4.2. Value Chain Analysis
4.3. Top Investment Pockets
4.3.1. Market Attractiveness Analysis by Equipment
4.3.2. Market Attractiveness Analysis by Application
4.3.3. Market Attractiveness Analysis by Region
4.4. Industry Trends
5. Market Dynamics
5.1. Market Evaluation
5.2. Drivers
5.2.1. Rising popularity
5.3. Restraints
5.3.1. Need good experience
5.4. Opportunities
5.4.1. Technological advancements
5.5. Challenges
5.5.1. High cost
6. Global Veterinary Imaging Market Analysis and Forecast, By Equipment
6.1. Segment Overview
6.2. Radiography (X-ray) Systems
6.3. Ultrasound Imaging Systems
6.4. Computed Tomography Imaging Systems
6.5. Magnetic Resonance Imaging Systems
6.6. Video Endoscopy Imaging Systems
6.7. Others
7. Global Veterinary Imaging Market Analysis and Forecast, By Application
7.1. Segment Overview
7.2. Orthopaedics & Traumatology
7.3. Oncology
7.4. Cardiology
7.5. Neurology
7.6. Others
8. Global Veterinary Imaging Market Analysis and Forecast, By Regional Analysis
8.1. Segment Overview
8.2. North America
8.2.1. U.S.
8.2.2. Canada
8.2.3. Mexico
8.3. Europe
8.3.1. Germany
8.3.2. France
8.3.3. U.K.
8.3.4. Italy
8.3.5. Spain
8.4. Asia-Pacific
8.4.1. Japan
8.4.2. China
8.4.3. India
8.5. South America
8.5.1. Brazil
8.6. Middle East and Africa
8.6.1. UAE
8.6.2. South Africa
9. Global Veterinary Imaging Market-Competitive Landscape
9.1. Overview
9.2. Market Share of Key Players in Global Veterinary Imaging Market
9.2.1. Global Company Market Share
9.2.2. North America Company Market Share
9.2.3. Europe Company Market Share
9.2.4. APAC Company Market Share
9.3. Competitive Situations and Trends
9.3.1. Product Launches and Developments
9.3.2. Partnerships, Collaborations, and Agreements
9.3.3. Mergers & Acquisitions
9.3.4. Expansions
10. Company Profiles
10.1. IDEXX Laboratories, Inc.
10.1.1. Business Overview
10.1.2. Company Snapshot
10.1.3. Company Market Share Analysis
10.1.4. Company Product Portfolio
10.1.5. Recent Developments
10.1.6. SWOT Analysis
10.2. ESAOTE SPA
10.2.1. Business Overview
10.2.2. Company Snapshot
10.2.3. Company Market Share Analysis
10.2.4. Company Product Portfolio
10.2.5. Recent Developments
10.2.6. SWOT Analysis
10.3. SOUND
10.3.1. Business Overview
10.3.2. Company Snapshot
10.3.3. Company Market Share Analysis
10.3.4. Company Product Portfolio
10.3.5. Recent Developments
10.3.6. SWOT Analysis
10.4. General Electric Company
10.4.1. Business Overview
10.4.2. Company Snapshot
10.4.3. Company Market Share Analysis
10.4.4. Company Product Portfolio
10.4.5. Recent Developments
10.4.6. SWOT Analysis
10.5. Universal Medical Systems, Inc.
10.5.1. Business Overview
10.5.2. Company Snapshot
10.5.3. Company Market Share Analysis
10.5.4. Company Product Portfolio
10.5.5. Recent Developments
10.5.6. SWOT Analysis
10.6. FUJIFILM Holdings America Corporation
10.6.1. Business Overview
10.6.2. Company Snapshot
10.6.3. Company Market Share Analysis
10.6.4. Company Product Portfolio
10.6.5. Recent Developments
10.6.6. SWOT Analysis
10.7. Hallmarq Veterinary Imaging Ltd.
10.7.1. Business Overview
10.7.2. Company Snapshot
10.7.3. Company Market Share Analysis
10.7.4. Company Product Portfolio
10.7.5. Recent Developments
10.7.6. SWOT Analysis
10.8. VetZ GmbH
10.8.1. Business Overview
10.8.2. Company Snapshot
10.8.3. Company Market Share Analysis
10.8.4. Company Product Portfolio
10.8.5. Recent Developments
10.8.6. SWOT Analysis
10.9. Shenzhen Mindray Animal Medical Technology Co., LTD.
10.9.1. Business Overview
10.9.2. Company Snapshot
10.9.3. Company Market Share Analysis
10.9.4. Company Product Portfolio
10.9.5. Recent Developments
10.9.6. SWOT Analysis
10.10. Heska Corporation
10.10.1. Business Overview
10.10.2. Company Snapshot
10.10.3. Company Market Share Analysis
10.10.4. Company Product Portfolio
10.10.5. Recent Developments
10.10.6. SWOT Analysis
List of Table
1. Global Veterinary Imaging Market, By Equipment, 2019-2032 (USD Billion)
2. Global Radiography (X-ray) Systems, Veterinary Imaging Market, By Region, 2019-2032 (USD Billion)
3. Global Ultrasound Imaging Systems, Veterinary Imaging Market, By Region, 2019-2032 (USD Billion)
4. Global Computed Tomography Imaging Systems, Veterinary Imaging Market, By Region, 2019-2032 (USD Billion)
5. Global Magnetic Resonance Imaging Systems, Veterinary Imaging Market, By Region, 2019-2032 (USD Billion)
6. Global Video Endoscopy Imaging Systems, Veterinary Imaging Market, By Region, 2019-2032 (USD Billion)
7. Global Others, Veterinary Imaging Market, By Region, 2019-2032 (USD Billion)
8. Global Veterinary Imaging Market, By Application, 2019-2032 (USD Billion)
9. Global Orthopaedics & Traumatology, Veterinary Imaging Market, By Region, 2019-2032 (USD Billion)
10. Global Oncology, Veterinary Imaging Market, By Region, 2019-2032 (USD Billion)
11. Global Cardiology, Veterinary Imaging Market, By Region, 2019-2032 (USD Billion)
12. Global Neurology, Veterinary Imaging Market, By Region, 2019-2032 (USD Billion)
13. Global Others, Veterinary Imaging Market, By Region, 2019-2032 (USD Billion)
14. North America Veterinary Imaging Market, By Equipment, 2019-2032 (USD Billion)
15. North America Veterinary Imaging Market, By Application, 2019-2032 (USD Billion)
16. U.S. Veterinary Imaging Market, By Equipment, 2019-2032 (USD Billion)
17. U.S. Veterinary Imaging Market, By Application, 2019-2032 (USD Billion)
18. Canada Veterinary Imaging Market, By Equipment, 2019-2032 (USD Billion)
19. Canada Veterinary Imaging Market, By Application, 2019-2032 (USD Billion)
20. Mexico Veterinary Imaging Market, By Equipment, 2019-2032 (USD Billion)
21. Mexico Veterinary Imaging Market, By Application, 2019-2032 (USD Billion)
22. Europe Veterinary Imaging Market, By Equipment, 2019-2032 (USD Billion)
23. Europe Veterinary Imaging Market, By Application, 2019-2032 (USD Billion)
24. Germany Veterinary Imaging Market, By Equipment, 2019-2032 (USD Billion)
25. Germany Veterinary Imaging Market, By Application, 2019-2032 (USD Billion)
26. France Veterinary Imaging Market, By Equipment, 2019-2032 (USD Billion)
27. France Veterinary Imaging Market, By Application, 2019-2032 (USD Billion)
28. U.K. Veterinary Imaging Market, By Equipment, 2019-2032 (USD Billion)
29. U.K. Veterinary Imaging Market, By Application, 2019-2032 (USD Billion)
30. Italy Veterinary Imaging Market, By Equipment, 2019-2032 (USD Billion)
31. Italy Veterinary Imaging Market, By Application, 2019-2032 (USD Billion)
32. Spain Veterinary Imaging Market, By Equipment, 2019-2032 (USD Billion)
33. Spain Veterinary Imaging Market, By Application, 2019-2032 (USD Billion)
34. Asia Pacific Veterinary Imaging Market, By Equipment, 2019-2032 (USD Billion)
35. Asia Pacific Veterinary Imaging Market, By Application, 2019-2032 (USD Billion)
36. Japan Veterinary Imaging Market, By Equipment, 2019-2032 (USD Billion)
37. Japan Veterinary Imaging Market, By Application, 2019-2032 (USD Billion)
38. China Veterinary Imaging Market, By Equipment, 2019-2032 (USD Billion)
39. China Veterinary Imaging Market, By Application, 2019-2032 (USD Billion)
40. India Veterinary Imaging Market, By Equipment, 2019-2032 (USD Billion)
41. India Veterinary Imaging Market, By Application, 2019-2032 (USD Billion)
42. South America Veterinary Imaging Market, By Equipment, 2019-2032 (USD Billion)
43. South America Veterinary Imaging Market, By Application, 2019-2032 (USD Billion)
44. Brazil Veterinary Imaging Market, By Equipment, 2019-2032 (USD Billion)
45. Brazil Veterinary Imaging Market, By Application, 2019-2032 (USD Billion)
46. Middle East and Africa Veterinary Imaging Market, By Equipment, 2019-2032 (USD Billion)
47. Middle East and Africa Veterinary Imaging Market, By Application, 2019-2032 (USD Billion)
48. UAE Veterinary Imaging Market, By Equipment, 2019-2032 (USD Billion)
49. UAE Veterinary Imaging Market, By Application, 2019-2032 (USD Billion)
50. South Africa Veterinary Imaging Market, By Equipment, 2019-2032 (USD Billion)
51. South Africa Veterinary Imaging Market, By Application, 2019-2032 (USD Billion)
List of Figures
1. Global Veterinary Imaging Market Segmentation
2. Global Veterinary Imaging Market: Research Methodology
3. Market Size Estimation Methodology: Bottom-Up Approach
4. Market Size Estimation Methodology: Top-Down Approach
5. Data Triangulation
6. Porter’s Five Forces Analysis
7. Value Chain Analysis
8. Global Veterinary Imaging Market Attractiveness Analysis by Equipment
9. Global Veterinary Imaging Market Attractiveness Analysis by Application
10. Global Veterinary Imaging Market Attractiveness Analysis by Region
11. Global Veterinary Imaging Market: Dynamics
12. Global Veterinary Imaging Market Share by Equipment (2023 & 2032)
13. Global Veterinary Imaging Market Share by Application (2023 & 2032)
14. Global Veterinary Imaging Market Share by Regions (2023 & 2032)
15. Global Veterinary Imaging Market Share by Company (2022)
This study forecasts global, regional, and country revenue from 2019 to 2032. The Brainy Insights has segmented the global veterinary imaging market based on the below-mentioned segments:
Global Veterinary Imaging Market By Equipment:
Global Veterinary Imaging Market By Application:
Global Veterinary Imaging Market By Region:
Research has its special purpose to undertake marketing efficiently. In this competitive scenario, businesses need information across all industry verticals; the information about customer wants, market demand, competition, industry trends, distribution channels etc. This information needs to be updated regularly because businesses operate in a dynamic environment. Our organization, The Brainy Insights incorporates scientific and systematic research procedures in order to get proper market insights and industry analysis for overall business success. The analysis consists of studying the market from a miniscule level wherein we implement statistical tools which helps us in examining the data with accuracy and precision.
Our research reports feature both; quantitative and qualitative aspects for any market. Qualitative information for any market research process are fundamental because they reveal the customer needs and wants, usage and consumption for any product/service related to a specific industry. This in turn aids the marketers/investors in knowing certain perceptions of the customers. Qualitative research can enlighten about the different product concepts and designs along with unique service offering that in turn, helps define marketing problems and generate opportunities. On the other hand, quantitative research engages with the data collection process through interviews, e-mail interactions, surveys and pilot studies. Quantitative aspects for the market research are useful to validate the hypotheses generated during qualitative research method, explore empirical patterns in the data with the help of statistical tools, and finally make the market estimations.
The Brainy Insights offers comprehensive research and analysis, based on a wide assortment of factual insights gained through interviews with CXOs and global experts and secondary data from reliable sources. Our analysts and industry specialist assume vital roles in building up statistical tools and analysis models, which are used to analyse the data and arrive at accurate insights with exceedingly informative research discoveries. The data provided by our organization have proven precious to a diverse range of companies, facilitating them to address issues such as determining which products/services are the most appealing, whether or not customers use the product in the manner anticipated, the purchasing intentions of the market and many others.
Our research methodology encompasses an idyllic combination of primary and secondary initiatives. Key phases involved in this process are listed below:

The phase involves the gathering and collecting of market data and its related information with the help of different sources & research procedures.

The data procurement stage involves in data gathering and collecting through various data sources.
This stage involves in extensive research. These data sources includes:
Purchased Database: Purchased databases play a crucial role in estimating the market sizes irrespective of the domain. Our purchased database includes:
Primary Research: The Brainy Insights interacts with leading companies and experts of the concerned domain to develop the analyst team’s market understanding and expertise. It improves and substantiates every single data presented in the market reports. Primary research mainly involves in telephonic interviews, E-mail interactions and face-to-face interviews with the raw material providers, manufacturers/producers, distributors, & independent consultants. The interviews that we conduct provides valuable data on market size and industry growth trends prevailing in the market. Our organization also conducts surveys with the various industry experts in order to gain overall insights of the industry/market. For instance, in healthcare industry we conduct surveys with the pharmacists, doctors, surgeons and nurses in order to gain insights and key information of a medical product/device/equipment which the customers are going to usage. Surveys are conducted in the form of questionnaire designed by our own analyst team. Surveys plays an important role in primary research because surveys helps us to identify the key target audiences of the market. Additionally, surveys helps to identify the key target audience engaged with the market. Our survey team conducts the survey by targeting the key audience, thus gaining insights from them. Based on the perspectives of the customers, this information is utilized to formulate market strategies. Moreover, market surveys helps us to understand the current competitive situation of the industry. To be precise, our survey process typically involve with the 360 analysis of the market. This analytical process begins by identifying the prospective customers for a product or service related to the market/industry to obtain data on how a product/service could fit into customers’ lives.

Secondary Research: The secondary data sources includes information published by the on-profit organizations such as World bank, WHO, company fillings, investor presentations, annual reports, national government documents, statistical databases, blogs, articles, white papers and others. From the annual report, we analyse a company’s revenue to understand the key segment and market share of that organization in a particular region. We analyse the company websites and adopt the product mapping technique which is important for deriving the segment revenue. In the product mapping method, we select and categorize the products offered by the companies catering to domain specific market, deduce the product revenue for each of the companies so as to get overall estimation of the market size. We also source data and analyses trends based on information received from supply side and demand side intermediaries in the value chain. The supply side denotes the data gathered from supplier, distributor, wholesaler and the demand side illustrates the data gathered from the end customers for respective market domain.

The supply side for a domain specific market is analysed by:
The demand side for the market is estimated through:
In-house Library: Apart from these third-party sources, we have our in-house library of qualitative and quantitative information. Our in-house database includes market data for various industry and domains. These data are updated on regular basis as per the changing market scenario. Our library includes, historic databases, internal audit reports and archives.
Sometimes there are instances where there is no metadata or raw data available for any domain specific market. For those cases, we use our expertise to forecast and estimate the market size in order to generate comprehensive data sets. Our analyst team adopt a robust research technique in order to produce the estimates:
Data Synthesis: This stage involves the analysis & mapping of all the information obtained from the previous step. It also involves in scrutinizing the data for any discrepancy observed while data gathering related to the market. The data is collected with consideration to the heterogeneity of sources. Robust scientific techniques are in place for synthesizing disparate data sets and provide the essential contextual information that can orient market strategies. The Brainy Insights has extensive experience in data synthesis where the data passes through various stages:


Market Deduction & Formulation: The final stage comprises of assigning data points at appropriate market spaces so as to deduce feasible conclusions. Analyst perspective & subject matter expert based holistic form of market sizing coupled with industry analysis also plays a crucial role in this stage.
This stage involves in finalization of the market size and numbers that we have collected from data integration step. With data interpolation, it is made sure that there is no gap in the market data. Successful trend analysis is done by our analysts using extrapolation techniques, which provide the best possible forecasts for the market.
Data Validation & Market Feedback: Validation is the most important step in the process. Validation & re-validation via an intricately designed process helps us finalize data-points to be used for final calculations.

The Brainy Insights interacts with leading companies and experts of the concerned domain to develop the analyst team’s market understanding and expertise. It improves and substantiates every single data presented in the market reports. The data validation interview and discussion panels are typically composed of the most experienced industry members. The participants include, however, are not limited to:
Moreover, we always validate our data and findings through primary respondents from all the major regions we are working on.


Free Customization
Fortune 500 Clients
Free Yearly Update On Purchase Of Multi/Corporate License
Companies Served Till Date