- +1-315-215-1633
- sales@thebrainyinsights.com

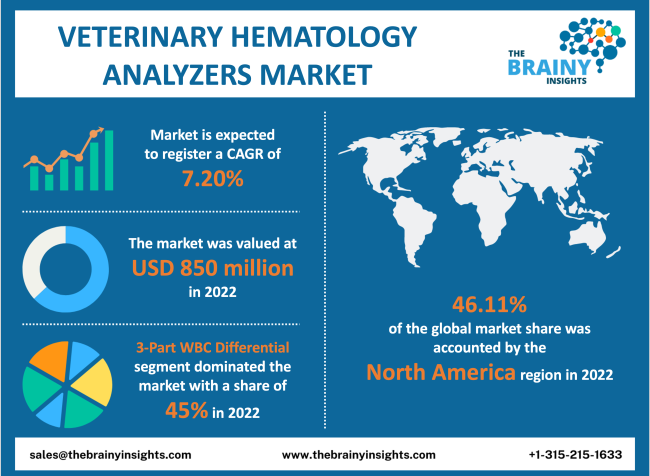
The global veterinary hematology analyzers market is expected to grow from USD 850 million in 2022 to USD 1482.44 million by 2030, at a CAGR of 7.20% during the forecast period 2022-2030. The North American veterinary hematology analyzers market is expected to maintain its dominance during the forecast period.
A hematology analyzer is used to perform a complete blood count, meaning it offers details about the number of RBC, WBC, platelets and so on in the blood. A much more detailed analysis is offered as details about haemoglobin, monocytes, lymphocytes and basophils are also provided by the hemotology analyzers. Such an analysis is the first point in understanding the patient's health status. The complete blood count acts as an indicator and offers the physician an insight into what might be wrong. For instance, a spike in WBCs might indicate that the immune system is fighting something. The lower RBCs or haemoglobin might explain the fatigue experienced by someone. This indication enables the doctor is deducing the disease/condition causing these changes and then offer the necessary treatment to cure the patient. Veterinary hematology analyzers are designed for animals. They are offered in table top and point-of-care formats. They are fully automatic and can also be found in semiautomatic forms. Technological advancement has enabled developers to offer advanced, efficient, affordable and easy-to-use veterinary hematology analyzers. The increasing animal population has increased the instances of zoonotic diseases. The rise in pet adoption has also contributed to the growing demand for animal healthcare. Therefore, the growing demand for animal healthcare will augment the global veterinary hematology analyzers market. The establishment of veterinary hospitals, clinics and diagnostics laboratories have paved the way for the market's growth.
Get an overview of this study by requesting a free sample
October 2022 - Historically, veterinary professionals have not had many options when collaborating with reference labs. Zoetis Reference Laboratories (ZRL) aims to upend the market with special advantages that set it apart from its long-established competitors. With its series of VETSCAN analyzers and glucose and anaesthetic monitoring devices, Zoetis was well-known in point-of-care diagnostics before it introduced ZRL. The corporation expanded its diagnostic capabilities over the previous three years by acquiring and combining three regional laboratories into a seamless national laboratory.
August 2022 - A new haematology analyzer called ProCyte One was introduced by IDEXX Lbaoratories Inc. and is currently available for pre-order. IDEXX, based in Westbrook, Maine, claims that ProCyte One is made to deliver point-of-care test results in under five minutes. The tabletop gadget has the following features: Every complete blood count includes reticulocyte numbers, Integrated load-and-go components and automatic quality control. It also offers a simplified interpretation of the results and has recyclable packaging.
The rising incidence and prevalence of zoonotic diseases – Weather patterns have drastically changed due to the speeding up of climate change. Long periods of intensely dry weather with high temperatures, a dry atmosphere with cold weather, or heavy rains occur more frequently than they did a century ago. These changes severely and negatively impact animals and their habitats. Similar to how human activity has expanded, so have animal habitats, increasing the likelihood of human contact. Recently, the chance of catching zoonotic illnesses from an animal vector has increased. For instance, the covid-19 epidemic, which caused millions of fatalities globally, was allegedly transmitted to humans through an animal-borne vector, most likely a bat. The attention towards animal healthcare has increased due to regular incidents of culling chickens or ducks. Scientists are working to improve animal vaccinations, drugs, food, and feed as the potential of zoonotic disease transmission from animals to humans rises. The market for veterinary hematology analyzers will therefore expand in the future.
Stringent government regulations – The modern world has witnessed a more frequent or regular interaction of humans-animals given the rising trend of pet adoption, loss of animal habitat and encroachment of humans on animal habitats. Furthermore, meat consumption is still the primary source of protein in the diet for most of the population. Therefore, there is an increased risk of humans being affected due to a spike in zoonotic diseases. Any monitoring guidelines associated with animal health or regulatory approvals are implemented stringently, keeping in mind the direct impact of animal health on a nation's social, economic and environmental well-being. Therefore, stringent government regulations will limit the market's growth.
Increasing research and development expenditure on animal healthcare – Government institutions have increased their spending on improving animal health as a result of the considerable harm zoonotic illnesses cause the deaths of animals to do on an individual and national level. Future business prospects will be attractive due to the rising government spending on developing more effective drugs, vaccines, tools, devices and diagnostics for the prevention and treatment of animal diseases. The market for animal products has grown as pet ownership and disposable money has increased. To take advantage of the increased market, private market firms are improving their products and investing more in R&D.
Insufficient animal healthcare infrastructure – Only in the last few years, with major government financing, has the movement to create a strong infrastructure for animal health gained pace. In low- and middle-income nations, however, the way that government projects have been carried out and the money has been used has been less than satisfying. A recent example of the lack of prophylactic measures is the large number of cattle who have recently died in India from lumpy skin disease. Additionally, it highlights how poorly the nation's animal healthcare systems are performing. The country has suffered significant economic losses due to similar chicken and duck culling incidents. The market's expansion will be hampered by a lack of infrastructure for developing, monitoring, testing, tracing, isolating, treating and vaccinating against zoonotic diseases.
The regions analyzed for the market include North America, Europe, South America, Asia Pacific, the Middle East, and Africa. The North American region emerged as the largest global veterinary hematology analyzers market, with a 46.11% market revenue share in 2022. Non-vegetarians make up a large section of the local community. The regional diet of the North American market includes a lot of meat consumption. Commercial animal breeding is required to meet the needs of the large meat-eating population to provide high-quality animal health and safeguard the interests of customers. The North American market has expanded as a result of strict government laws, as well as the existence of numerous organizations committed to the health and welfare of animals. As evidenced by the COVID-19 pandemic, the rising incidence of zoonotic illnesses needs more monitoring to prevent catastrophic harm. As zoonotic illnesses spread, the fiscal authorities are compelled to support and finance beneficial industrial measures that will advance animal health. Technological breakthroughs and access to cutting-edge technology are fueling the industry's expansion. The rise will probably influence the rising demand for goods aimed at achieving high animal health in pet adoption.
North America Region Veterinary Hematology Analyzers Market Share in 2022 - 46.11%
www.thebrainyinsights.com
Check the geographical analysis of this market by requesting a free sample
The product segment is divided into table top analyzers and point-of-care analyzers. The table top analyzers are further divided into fully automatic and semiautomatic analyzers. The point-of-care analyzers are further divided into cartridge-based and direct sample-based analyzers. The table top analyzers segment dominated the market with a market share of around 65% in 2022. Table top analyzers offer a broad-spectrum analysis with details. They are easy to use. The sample requirements are small, making it highly compatible in a volatile environment. Table top analyzers are low-maintenance devices widely applied in animal healthcare. The increasing animal population and the rise in diseases have increased the demand for table top analyzers in the market. The fully automatic and semiautomatic analyzers both equally drive the table top analyzer segment. They offer a detailed analysis with high accuracy.
The analysis parameter segment is divided into 2-part WBC differential, 3-part WBC differential, 5-part WBC differential and others. The 3-part WBC differential segment dominated the market with a market share of around 45% in 2022. A 3-part WBC differential gives a count of the blood's monocytes, neutrophils, and lymphocytes. These analyzers are found in most physician or veterinary hospitals, clinics and diagnostic laboratories. They are popular in the animal healthcare sector as they offer sufficient diagnostic insights to deduce the disease/condition affecting the animal/pet. It is efficient and effective in detecting viral and bacterial infections. The high prevalence of zoonotic diseases, mostly bacterial or viral, contributes to the rising adoption of 3-part WBC differential analyzers in the market.
The end-user segment is divided into research institutes, veterinary hospitals and clinics, veterinary diagnostic centers, point-of-care testing, inhouse-testing, and others. The veterinary hospitals and clinics segment dominated the market with a market share of around 45% in 2022. Just as hospitals and clinics are the primary healthcare providers worldwide and are trusted by the general population, veterinary hospitals and clinics are the preferred choice for their pets and domesticated animals. Veterinary hospitals and clinics are equipped with all the necessary medications, equipment, devices and other necessities to provide optimum healthcare to animals. Furthermore, the increase in the adoption of pets has prompted public and private players to establish and operate veterinary hospitals and clinics to deliver veterinary healthcare services to everyone and anyone seeking it. Establishing walk-in clinics with qualified professionals to assist the patients brought in will propel the segment's growth.
| Attribute | Description |
|---|---|
| Market Size | Revenue (USD Million) |
| Market size value in 2022 | USD 850 Million |
| Market size value in 2030 | USD 1482.44 Million |
| CAGR (2022 to 2030) | 7.20% |
| Historical data | 2019-2020 |
| Base Year | 2021 |
| Forecast | 2022-2030 |
| Segments | The research segment is based on the product, analysis parameter and end user. |
| Regional Segments | The regions examined for the market are Europe, Asia Pacific, North America, South America, and Middle East & Africa. |
As per The Brainy Insights, the size of the veterinary hematology analyzers market was valued at USD 850 million in 2022 to USD 1482.44 million by 2030.
Global veterinary hematology analyzers market is growing at a CAGR of 7.20% during the forecast period 2022-2030.
The market's growth will be influenced by the rising incidence and prevalence of zoonotic diseases.
Stringent government regulations could hamper the market growth.
1. Introduction
1.1. Objectives of the Study
1.2. Market Definition
1.3. Research Scope
1.4. Currency
1.5. Key Target Audience
2. Research Methodology and Assumptions
3. Executive Summary
4. Premium Insights
4.1. Porter’s Five Forces Analysis
4.2. Value Chain Analysis
4.3. Top Investment Pockets
4.3.1. Market Attractiveness Analysis by Product
4.3.2. Market Attractiveness Analysis by Analysis Parameter
4.3.3. Market Attractiveness Analysis by End User
4.3.4. Market Attractiveness Analysis by Region
4.4. Industry Trends
5. Market Dynamics
5.1. Market Evaluation
5.2. Drivers
5.2.1. The rising incidence and prevalence of zoonotic diseases
5.3. Restraints
5.3.1. Stringent government regulations
5.4. Opportunities
5.4.1. Increasing research and development expenditure on animal healthcare
5.5. Challenges
5.5.1. Insufficient animal healthcare infrastructure
6. Global Veterinary Hematology Analyzers Market Analysis and Forecast, By Product
6.1. Segment Overview
6.2. Table Top Analyzers
6.2.1. Fully Automatic Analyzers
6.2.2. Semiautomatic Analyzers
6.3. Point Of Care Analyzers
6.3.1. Cartridge-Based Analyzers
6.3.2. Direct Sample Based Analyzers
7. Global Veterinary Hematology Analyzers Market Analysis and Forecast, By Analysis Parameter
7.1. Segment Overview
7.2. 2-Part WBC Differential
7.3. 3-Part WBC Differential
7.4. 5-Part WBC Differential
7.5. Others
8. Global Veterinary Hematology Analyzers Market Analysis and Forecast, By End User
8.1. Segment Overview
8.2. Research Institutes
8.3. Veterinary Hospitals and Clinics
8.4. Veterinary Diagnostic Centers
8.5. Point-Of-Care Testing
8.6. Inhouse-Testing
8.7. Others
9. Global Veterinary Hematology Analyzers Market Analysis and Forecast, By Regional Analysis
9.1. Segment Overview
9.2. North America
9.2.1. U.S.
9.2.2. Canada
9.2.3. Mexico
9.3. Europe
9.3.1. Germany
9.3.2. France
9.3.3. U.K.
9.3.4. Italy
9.3.5. Spain
9.4. Asia-Pacific
9.4.1. Japan
9.4.2. China
9.4.3. India
9.5. South America
9.5.1. Brazil
9.6. Middle East and Africa
9.6.1. UAE
9.6.2. South Africa
10. Global Veterinary Hematology Analyzers Market-Competitive Landscape
10.1. Overview
10.2. Market Share of Key Players in the Veterinary Hematology Analyzers Market
10.2.1. Global Company Market Share
10.2.2. North America Company Market Share
10.2.3. Europe Company Market Share
10.2.4. APAC Company Market Share
10.3. Competitive Situations and Trends
10.3.1. Analysis Parameter Launches and Developments
10.3.2. Partnerships, Collaborations, and Agreements
10.3.3. Mergers & Acquisitions
10.3.4. Expansions
11. Company Profiles
11.1. Abaxis Inc.
11.1.1. Business Overview
11.1.2. Company Snapshot
11.1.3. Company Market Share Analysis
11.1.4. Company Analysis Parameter Portfolio
11.1.5. Recent Developments
11.1.6. SWOT Analysis
11.2. Boule Medical AB
11.2.1. Business Overview
11.2.2. Company Snapshot
11.2.3. Company Market Share Analysis
11.2.4. Company Analysis Parameter Portfolio
11.2.5. Recent Developments
11.2.6. SWOT Analysis
11.3. Clindaig Systems Co. Ltd.
11.3.1. Business Overview
11.3.2. Company Snapshot
11.3.3. Company Market Share Analysis
11.3.4. Company Analysis Parameter Portfolio
11.3.5. Recent Developments
11.3.6. SWOT Analysis
11.4. Diatron MI Zrt
11.4.1. Business Overview
11.4.2. Company Snapshot
11.4.3. Company Market Share Analysis
11.4.4. Company Analysis Parameter Portfolio
11.4.5. Recent Developments
11.4.6. SWOT Analysis
11.5. Drew Scientific Inc.
11.5.1. Business Overview
11.5.2. Company Snapshot
11.5.3. Company Market Share Analysis
11.5.4. Company Analysis Parameter Portfolio
11.5.5. Recent Developments
11.5.6. SWOT Analysis
11.6. Heska Corporation
11.6.1. Business Overview
11.6.2. Company Snapshot
11.6.3. Company Market Share Analysis
11.6.4. Company Analysis Parameter Portfolio
11.6.5. Recent Developments
11.6.6. SWOT Analysis
11.7. IDEXX Laboratories Inc.
11.7.1. Business Overview
11.7.2. Company Snapshot
11.7.3. Company Market Share Analysis
11.7.4. Company Analysis Parameter Portfolio
11.7.5. Recent Developments
11.7.6. SWOT Analysis
11.8. Siemens Healthcare Diagnostics Inc.
11.8.1. Business Overview
11.8.2. Company Snapshot
11.8.3. Company Market Share Analysis
11.8.4. Company Analysis Parameter Portfolio
11.8.5. Recent Developments
11.8.6. SWOT Analysis
11.9. Sysmex Corporation
11.9.1. Business Overview
11.9.2. Company Snapshot
11.9.3. Company Market Share Analysis
11.9.4. Company Analysis Parameter Portfolio
11.9.5. Recent Developments
11.9.6. SWOT Analysis
11.10. URIT Medical
11.10.1. Business Overview
11.10.2. Company Snapshot
11.10.3. Company Market Share Analysis
11.10.4. Company Analysis Parameter Portfolio
11.10.5. Recent Developments
11.10.6. SWOT Analysis
List of Table
1. Global Veterinary Hematology Analyzers Market, By Product, 2019-2030 (USD Million)
2. Global Table Top Analyzers Veterinary Hematology Analyzers Market, By Region, 2019-2030 (USD Million)
3. Global Point of Care Analyzers Veterinary Hematology Analyzers Market, By Region, 2019-2030 (USD Million)
4. Global Veterinary Hematology Analyzers Market, By Analysis Parameter, 2019-2030 (USD Million)
5. Global 2-Part WBC Differential Veterinary Hematology Analyzers Market, By Region, 2019-2030 (USD Million)
6. Global 3-Part WBC Differential Veterinary Hematology Analyzers Market, By Region, 2019-2030 (USD Million)
7. Global 5-Part WBC Differential Veterinary Hematology Analyzers Market, By Region, 2019-2030 (USD Million)
8. Global Others Veterinary Hematology Analyzers Market, By Region, 2019-2030 (USD Million)
9. Global Veterinary Hematology Analyzers Market, By End User, 2019-2030 (USD Million)
10. Global Research Institutes Veterinary Hematology Analyzers Market, By Region, 2019-2030 (USD Million)
11. Global Veterinary Hospitals And Clinics Veterinary Hematology Analyzers Market, By Region, 2019-2030 (USD Million)
12. Global Veterinary Diagnostic Centers Veterinary Hematology Analyzers Market, By Region, 2019-2030 (USD Million)
13. Global Point-Of-Care Testing Veterinary Hematology Analyzers Market, By Region, 2019-2030 (USD Million)
14. Global Inhouse-Testing Veterinary Hematology Analyzers Market, By Region, 2019-2030 (USD Million)
15. Global Others Veterinary Hematology Analyzers Market, By Region, 2019-2030 (USD Million)
16. Global Veterinary Hematology Analyzers Market, By Region, 2019-2030 (USD Million)
17. North America Veterinary Hematology Analyzers Market, By Product, 2019-2030 (USD Million)
18. North America Veterinary Hematology Analyzers Market, By Analysis Parameter, 2019-2030 (USD Million)
19. North America Veterinary Hematology Analyzers Market, By End User, 2019-2030 (USD Million)
20. U.S. Veterinary Hematology Analyzers Market, By Product, 2019-2030 (USD Million)
21. U.S. Veterinary Hematology Analyzers Market, By Analysis Parameter, 2019-2030 (USD Million)
22. U.S. Veterinary Hematology Analyzers Market, By End User, 2019-2030 (USD Million)
23. Canada Veterinary Hematology Analyzers Market, By Product, 2019-2030 (USD Million)
24. Canada Veterinary Hematology Analyzers Market, By Analysis Parameter, 2019-2030 (USD Million)
25. Canada Veterinary Hematology Analyzers Market, By End User, 2019-2030 (USD Million)
26. Mexico Veterinary Hematology Analyzers Market, By Product, 2019-2030 (USD Million)
27. Mexico Veterinary Hematology Analyzers Market, By Analysis Parameter, 2019-2030 (USD Million)
28. Mexico Veterinary Hematology Analyzers Market, By End User, 2019-2030 (USD Million)
29. Europe Veterinary Hematology Analyzers Market, By Product, 2019-2030 (USD Million)
30. Europe Veterinary Hematology Analyzers Market, By Analysis Parameter, 2019-2030 (USD Million)
31. Europe Veterinary Hematology Analyzers Market, By End User, 2019-2030 (USD Million)
32. Germany Veterinary Hematology Analyzers Market, By Product, 2019-2030 (USD Million)
33. Germany Veterinary Hematology Analyzers Market, By Analysis Parameter, 2019-2030 (USD Million)
34. Germany Veterinary Hematology Analyzers Market, By End User, 2019-2030 (USD Million)
35. France Veterinary Hematology Analyzers Market, By Product, 2019-2030 (USD Million)
36. France Veterinary Hematology Analyzers Market, By Analysis Parameter, 2019-2030 (USD Million)
37. France Veterinary Hematology Analyzers Market, By End User, 2019-2030 (USD Million)
38. U.K. Veterinary Hematology Analyzers Market, By Product, 2019-2030 (USD Million)
39. U.K. Veterinary Hematology Analyzers Market, By Analysis Parameter, 2019-2030 (USD Million)
40. U.K. Veterinary Hematology Analyzers Market, By End User, 2019-2030 (USD Million)
41. Italy Veterinary Hematology Analyzers Market, By Product, 2019-2030 (USD Million)
42. Italy Veterinary Hematology Analyzers Market, By Analysis Parameter, 2019-2030 (USD Million)
43. Italy Veterinary Hematology Analyzers Market, By End User, 2019-2030 (USD Million)
44. Spain Veterinary Hematology Analyzers Market, By Product, 2019-2030 (USD Million)
45. Spain Veterinary Hematology Analyzers Market, By Analysis Parameter, 2019-2030 (USD Million)
46. Spain Veterinary Hematology Analyzers Market, By End User, 2019-2030 (USD Million)
47. Asia Pacific Veterinary Hematology Analyzers Market, By Product, 2019-2030 (USD Million)
48. Asia Pacific Veterinary Hematology Analyzers Market, By Analysis Parameter, 2019-2030 (USD Million)
49. Asia Pacific Veterinary Hematology Analyzers Market, By End User, 2019-2030 (USD Million)
50. Japan Veterinary Hematology Analyzers Market, By Product, 2019-2030 (USD Million)
51. Japan Veterinary Hematology Analyzers Market, By Analysis Parameter, 2019-2030 (USD Million)
52. Japan Veterinary Hematology Analyzers Market, By End User, 2019-2030 (USD Million)
53. China Veterinary Hematology Analyzers Market, By Product, 2019-2030 (USD Million)
54. China Veterinary Hematology Analyzers Market, By Analysis Parameter, 2019-2030 (USD Million)
55. China Veterinary Hematology Analyzers Market, By End User, 2019-2030 (USD Million)
56. India Veterinary Hematology Analyzers Market, By Product, 2019-2030 (USD Million)
57. India Veterinary Hematology Analyzers Market, By Analysis Parameter, 2019-2030 (USD Million)
58. India Veterinary Hematology Analyzers Market, By End User, 2019-2030 (USD Million)
59. South America Veterinary Hematology Analyzers Market, By Product, 2019-2030 (USD Million)
60. South America Veterinary Hematology Analyzers Market, By Analysis Parameter, 2019-2030 (USD Million)
61. South America Veterinary Hematology Analyzers Market, By End User, 2019-2030 (USD Million)
62. Brazil Veterinary Hematology Analyzers Market, By Product, 2019-2030 (USD Million)
63. Brazil Veterinary Hematology Analyzers Market, By Analysis Parameter, 2019-2030 (USD Million)
64. Brazil Veterinary Hematology Analyzers Market, By End User, 2019-2030 (USD Million)
65. Middle East and Africa Veterinary Hematology Analyzers Market, By Product, 2019-2030 (USD Million)
66. Middle East and Africa Veterinary Hematology Analyzers Market, By Analysis Parameter, 2019-2030 (USD Million)
67. Middle East and Africa Veterinary Hematology Analyzers Market, By End User, 2019-2030 (USD Million)
68. UAE Veterinary Hematology Analyzers Market, By Product, 2019-2030 (USD Million)
69. UAE Veterinary Hematology Analyzers Market, By Analysis Parameter, 2019-2030 (USD Million)
70. UAE Veterinary Hematology Analyzers Market, By End User, 2019-2030 (USD Million)
71. South Africa Veterinary Hematology Analyzers Market, By Product, 2019-2030 (USD Million)
72. South Africa Veterinary Hematology Analyzers Market, By Analysis Parameter, 2019-2030 (USD Million)
73. South Africa Veterinary Hematology Analyzers Market, By End User, 2019-2030 (USD Million)
List of Figures
1. Global Veterinary Hematology Analyzers Market Segmentation
2. Veterinary Hematology Analyzers Market: Research Methodology
3. Market Size Estimation Methodology: Bottom-Up Approach
4. Market Size Estimation Methodology: Top-Down Approach
5. Data Triangulation
6. Porter’s Five Forces Analysis
7. Value Chain Analysis
8. Global Veterinary Hematology Analyzers Market Attractiveness Analysis by Product
9. Global Veterinary Hematology Analyzers Market Attractiveness Analysis by Analysis Parameter
10. Global Veterinary Hematology Analyzers Market Attractiveness Analysis by End User
11. Global Veterinary Hematology Analyzers Market Attractiveness Analysis by Region
12. Global Veterinary Hematology Analyzers Market: Dynamics
13. Global Veterinary Hematology Analyzers Market Share by Product (2022 & 2030)
14. Global Veterinary Hematology Analyzers Market Share by Analysis Parameter (2022 & 2030)
15. Global Veterinary Hematology Analyzers Market Share by End User (2022 & 2030)
16. Global Veterinary Hematology Analyzers Market Share by Regions (2022 & 2030)
17. Global Veterinary Hematology Analyzers Market Share by Company (2021)
This study forecasts revenue at global, regional, and country levels from 2019 to 2030. The Brainy Insights has segmented the veterinary hematology analyzers market based on below mentioned segments:
Veterinary Hematology Analyzers Market by Product:
Veterinary Hematology Analyzers Market by Analysis Parameter:
Veterinary Hematology Analyzers Market by End User:
Veterinary Hematology Analyzers Market by Region:
Research has its special purpose to undertake marketing efficiently. In this competitive scenario, businesses need information across all industry verticals; the information about customer wants, market demand, competition, industry trends, distribution channels etc. This information needs to be updated regularly because businesses operate in a dynamic environment. Our organization, The Brainy Insights incorporates scientific and systematic research procedures in order to get proper market insights and industry analysis for overall business success. The analysis consists of studying the market from a miniscule level wherein we implement statistical tools which helps us in examining the data with accuracy and precision.
Our research reports feature both; quantitative and qualitative aspects for any market. Qualitative information for any market research process are fundamental because they reveal the customer needs and wants, usage and consumption for any product/service related to a specific industry. This in turn aids the marketers/investors in knowing certain perceptions of the customers. Qualitative research can enlighten about the different product concepts and designs along with unique service offering that in turn, helps define marketing problems and generate opportunities. On the other hand, quantitative research engages with the data collection process through interviews, e-mail interactions, surveys and pilot studies. Quantitative aspects for the market research are useful to validate the hypotheses generated during qualitative research method, explore empirical patterns in the data with the help of statistical tools, and finally make the market estimations.
The Brainy Insights offers comprehensive research and analysis, based on a wide assortment of factual insights gained through interviews with CXOs and global experts and secondary data from reliable sources. Our analysts and industry specialist assume vital roles in building up statistical tools and analysis models, which are used to analyse the data and arrive at accurate insights with exceedingly informative research discoveries. The data provided by our organization have proven precious to a diverse range of companies, facilitating them to address issues such as determining which products/services are the most appealing, whether or not customers use the product in the manner anticipated, the purchasing intentions of the market and many others.
Our research methodology encompasses an idyllic combination of primary and secondary initiatives. Key phases involved in this process are listed below:

The phase involves the gathering and collecting of market data and its related information with the help of different sources & research procedures.

The data procurement stage involves in data gathering and collecting through various data sources.
This stage involves in extensive research. These data sources includes:
Purchased Database: Purchased databases play a crucial role in estimating the market sizes irrespective of the domain. Our purchased database includes:
Primary Research: The Brainy Insights interacts with leading companies and experts of the concerned domain to develop the analyst team’s market understanding and expertise. It improves and substantiates every single data presented in the market reports. Primary research mainly involves in telephonic interviews, E-mail interactions and face-to-face interviews with the raw material providers, manufacturers/producers, distributors, & independent consultants. The interviews that we conduct provides valuable data on market size and industry growth trends prevailing in the market. Our organization also conducts surveys with the various industry experts in order to gain overall insights of the industry/market. For instance, in healthcare industry we conduct surveys with the pharmacists, doctors, surgeons and nurses in order to gain insights and key information of a medical product/device/equipment which the customers are going to usage. Surveys are conducted in the form of questionnaire designed by our own analyst team. Surveys plays an important role in primary research because surveys helps us to identify the key target audiences of the market. Additionally, surveys helps to identify the key target audience engaged with the market. Our survey team conducts the survey by targeting the key audience, thus gaining insights from them. Based on the perspectives of the customers, this information is utilized to formulate market strategies. Moreover, market surveys helps us to understand the current competitive situation of the industry. To be precise, our survey process typically involve with the 360 analysis of the market. This analytical process begins by identifying the prospective customers for a product or service related to the market/industry to obtain data on how a product/service could fit into customers’ lives.

Secondary Research: The secondary data sources includes information published by the on-profit organizations such as World bank, WHO, company fillings, investor presentations, annual reports, national government documents, statistical databases, blogs, articles, white papers and others. From the annual report, we analyse a company’s revenue to understand the key segment and market share of that organization in a particular region. We analyse the company websites and adopt the product mapping technique which is important for deriving the segment revenue. In the product mapping method, we select and categorize the products offered by the companies catering to domain specific market, deduce the product revenue for each of the companies so as to get overall estimation of the market size. We also source data and analyses trends based on information received from supply side and demand side intermediaries in the value chain. The supply side denotes the data gathered from supplier, distributor, wholesaler and the demand side illustrates the data gathered from the end customers for respective market domain.

The supply side for a domain specific market is analysed by:
The demand side for the market is estimated through:
In-house Library: Apart from these third-party sources, we have our in-house library of qualitative and quantitative information. Our in-house database includes market data for various industry and domains. These data are updated on regular basis as per the changing market scenario. Our library includes, historic databases, internal audit reports and archives.
Sometimes there are instances where there is no metadata or raw data available for any domain specific market. For those cases, we use our expertise to forecast and estimate the market size in order to generate comprehensive data sets. Our analyst team adopt a robust research technique in order to produce the estimates:
Data Synthesis: This stage involves the analysis & mapping of all the information obtained from the previous step. It also involves in scrutinizing the data for any discrepancy observed while data gathering related to the market. The data is collected with consideration to the heterogeneity of sources. Robust scientific techniques are in place for synthesizing disparate data sets and provide the essential contextual information that can orient market strategies. The Brainy Insights has extensive experience in data synthesis where the data passes through various stages:


Market Deduction & Formulation: The final stage comprises of assigning data points at appropriate market spaces so as to deduce feasible conclusions. Analyst perspective & subject matter expert based holistic form of market sizing coupled with industry analysis also plays a crucial role in this stage.
This stage involves in finalization of the market size and numbers that we have collected from data integration step. With data interpolation, it is made sure that there is no gap in the market data. Successful trend analysis is done by our analysts using extrapolation techniques, which provide the best possible forecasts for the market.
Data Validation & Market Feedback: Validation is the most important step in the process. Validation & re-validation via an intricately designed process helps us finalize data-points to be used for final calculations.

The Brainy Insights interacts with leading companies and experts of the concerned domain to develop the analyst team’s market understanding and expertise. It improves and substantiates every single data presented in the market reports. The data validation interview and discussion panels are typically composed of the most experienced industry members. The participants include, however, are not limited to:
Moreover, we always validate our data and findings through primary respondents from all the major regions we are working on.


Free Customization
Fortune 500 Clients
Free Yearly Update On Purchase Of Multi/Corporate License
Companies Served Till Date