- +1-315-215-1633
- sales@thebrainyinsights.com

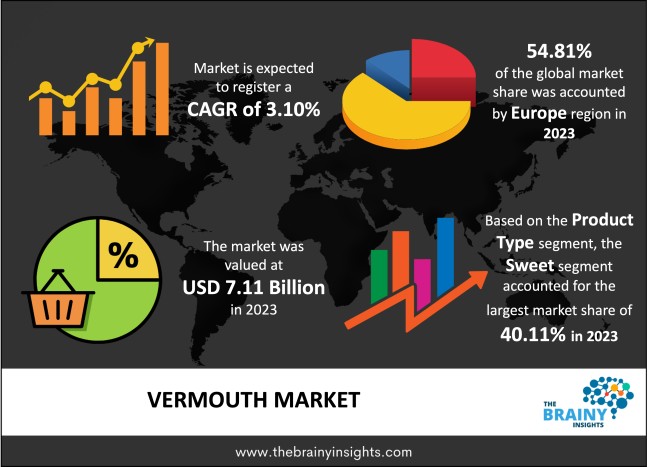
Global vermouth market is projected to reach USD 9.64 billion by 2033, at a CAGR of 3.10% from 2024 to 2033. Rising demand for beverages with a low alcohol content among adults and millennials in restaurants and pubs is projected to be the main driver for market growth. Also, the increasing popularity among millennials of aromatized and fortified wines on a global level is anticipated to remain one of the key driving forces for the market during the forecast period.
Vermouth is a dry or sweet aperitif wine aromatised with herbs and sometimes used in blended drinks. It is a fortified wine, flavoured with a range of botanicals (flowers, roots, barks, seeds, spices and herbs) and often colourful. Vermouth wines are sweet aperitif wines and similar to the Martini or sweet Cinzano wines. As an appetite stimulant before meals, vermouth is served chilled at 7 to 10 degrees Celsius. Vermouth usually contains alcohol from 17% to 19% and sugar from 7% to 9%. Besides being used as a cocktail or aperitif ingredient, vermouth is at times used in the cooking as a replacement for white wine. Vermouth is made beginning from unfermented wine must or a neutral grape wine foundation. Every producer adds additional alcohol and a proprietary blend of dry ingredients, composed of aromatic roots and barks, herbs, to base wine, spirit alone or base wine plus spirit– which must be redistilled before adding to the unfermented wine must or wine. Based on the style, the vermouth is sweetened with either caramelized sugar or cane sugar after the wine is aromatised and fortified. Vermouth's popularity is growing due to the booming classic cocktails sector and a surge in the preference for lower Alcohol by volume serving.
Vermouth is an ingredient common in cocktails, particularly in manhattans and martinis. It is usually an apéritif while consuming vermouth by itself. Vermouth is utilized as an ingredient in several different cocktails, since it has been considered beneficial to lower the alcohol content of cocktails with powerful spirits as their base, to have a good herbal taste and aroma, and to accentuate the flavors in the base liquor. Although vermouth can be used in food recipes as a replacement for white wine, since it is more flavourful than wine, it can be overwhelming when used in some dishes. The herbs in dry vermouth make it a desirable ingredient in sauces for fish dishes, or as a marinade for certain meats, including pork and chicken.
Get an overview of this study by requesting a free sample
Major growth factor for the global vermouth market is the growing desire for new flavors in fortified wines. Market players are coming up with different flavours for fortified wines to satisfy their consumers' rising demands. Consumers' taste preferences are increasingly evolving, and demand for new and exotic flavors in fortified wines is high.
The easy availability of product substitutes coupled with the large consumption of craft beers may hinder the growth potential for the vermouth industry.
Product premiumization will provide a massisve opportunity to the global vermouth market. With the global economy's recovery, customers' disposable income has risen and their demand for premium goods has therefore increased. Most customers expect premium products to use high-quality ingredients, and therefore the quality of these items is perceived to be better than regular goods. Thereby boosting the growth of the global vermouth market.
It is anticipated that high taxes and regulatory restrictions by governments and the availability of certain wine alternatives would impede global vermouth market growth.
The global vermouth market has been segmented based on product type, distribution channel, packaging and regions.
The regions evaluated for the vermouth market include Europe, North America, Middle East and Africa, South America and Asia Pacific. The Europe region emerged as the largest market for the vermouth, with a 54.81% share of market revenue in 2023.
Europe Vermouth Market Share in 2023 - 54.81%
www.thebrainyinsights.com
Check the geographical analysis of this market by requesting a free sample
In July, 2019, El Bandarra, a company known for craft vermouth has introduced a new product in Barcelona, Spain, under the brand name 'El Bandarra Vermut Rosé.' This product contains 30% less sugar, and 15.0% Alcohol by Volume (ABV).
As per The Brainy Insights, the size of the vermouth market was valued at USD 7.11 billion in 2023 and is anticipated to reach USD 9.64 billion by 2033.
Global vermouth market is growing at a CAGR of 3.10% during the forecast period 2024-2033.
The Europe region emerged as the largest market for the vermouth.
Burgeoning demand for new flavors of fortified wines is the key driving factor for the vermouth market.
Availability of substitutes could hamper the market growth.
Product premiumization will provide huge opportunities to the market.
Key players are Atsby Vermouth, Bacardi Limited, Belsazar, Branca International S.p.A., Cinzano, Lustau, MAiDENii, MANCINO VERMOUTH, MARTINEZ LACUESTA
1. Introduction
1.1. Objectives of the Study
1.2. Market Definition
1.3. Research Scope
1.4. Currency
1.5. Key Target Audience
2. Research Methodology and Assumptions
3. Executive Summary
4. Premium Insights
4.1. Porter’s Five Forces Analysis
4.2. Value Chain Analysis
4.3. Top Investment Pockets
4.3.1. Market Attractiveness Analysis By Product Type
4.3.2. Market Attractiveness Analysis By Packaging
4.3.3. Market Attractiveness Analysis By Distribution Channel
4.3.4. Market Attractiveness Analysis By Region
4.4. Industry Trends
5. Market Dynamics
5.1. Market Evaluation
5.2. Drivers
5.2.1. Burgeoning Demand for New Flavors of Fortified Wines
5.3. Restraints
5.3.1. Availability of Substitutes
5.4. Opportunities
5.4.1. Product Premiumization
5.5. Challenges
5.5.1. High Taxes
6. Global Vermouth Market Analysis and Forecast, By Product Type
6.1. Segment Overview
6.2. Sweet
6.3. Dry
6.4. White Vermouth
7. Global Vermouth Market Analysis and Forecast, By Packaging
7.1. Segment Overview
7.2. Plastic Bottles
7.3. Glass Bottles
7.4. Others
8. Global Vermouth Market Analysis and Forecast, By Distribution Channel
8.1. Segment Overview
8.2. Off Trade
8.3. On Trade
9. Global Vermouth Market Analysis and Forecast, By Regional Analysis
9.1. Segment Overview
9.2. North America
9.2.1. U.S.
9.2.2. Canada
9.2.3. Mexico
9.3. Europe
9.3.1. Germany
9.3.2. France
9.3.3. U.K.
9.3.4. Italy
9.3.5. Spain
9.4. Asia-Pacific
9.4.1. Japan
9.4.2. China
9.4.3. India
9.5. South America
9.5.1. Brazil
9.6. Middle East and Africa
9.6.1. UAE
9.6.2. South Africa
10. Global Vermouth Market-Competitive Landscape
10.1. Overview
10.2. Market Share of Key Players in Global Vermouth Market
10.2.1. Global Company Market Share
10.2.2. North America Company Market Share
10.2.3. Europe Company Market Share
10.2.4. APAC Company Market Share
10.3. Competitive Situations and Trends
10.3.1. Product Launches and Developments
10.3.2. Partnerships, Collaborations, and Agreements
10.3.3. Mergers & Acquisitions
10.3.4. Expansions
11. Company Profiles
11.1. Atsby Vermouth
11.1.1. Business Overview
11.1.2. Company Snapshot
11.1.3. Company Market Share Analysis
11.1.4. Company Product Portfolio
11.1.5. Recent Developments
11.1.6. SWOT Analysis
11.2. Bacardi Limited
11.2.1. Business Overview
11.2.2. Company Snapshot
11.2.3. Company Market Share Analysis
11.2.4. Company Product Portfolio
11.2.5. Recent Developments
11.2.6. SWOT Analysis
11.3. Belsazar
11.3.1. Business Overview
11.3.2. Company Snapshot
11.3.3. Company Market Share Analysis
11.3.4. Company Product Portfolio
11.3.5. Recent Developments
11.3.6. SWOT Analysis
11.4. Branca International S.p.A.
11.4.1. Business Overview
11.4.2. Company Snapshot
11.4.3. Company Market Share Analysis
11.4.4. Company Product Portfolio
11.4.5. Recent Developments
11.4.6. SWOT Analysis
11.5. Cinzano
11.5.1. Business Overview
11.5.2. Company Snapshot
11.5.3. Company Market Share Analysis
11.5.4. Company Product Portfolio
11.5.5. Recent Developments
11.5.6. SWOT Analysis
11.6. Contratto
11.6.1. Business Overview
11.6.2. Company Snapshot
11.6.3. Company Market Share Analysis
11.6.4. Company Product Portfolio
11.6.5. Recent Developments
11.6.6. SWOT Analysis
11.7. Distillerie des Alpes
11.7.1. Business Overview
11.7.2. Company Snapshot
11.7.3. Company Market Share Analysis
11.7.4. Company Product Portfolio
11.7.5. Recent Developments
11.7.6. SWOT Analysis
11.8. E.and J. Gallo Winery
11.8.1. Business Overview
11.8.2. Company Snapshot
11.8.3. Company Market Share Analysis
11.8.4. Company Product Portfolio
11.8.5. Recent Developments
11.8.6. SWOT Analysis
11.9. F.LLI GANCIA & C. SpA - CANELLI (Asti – ITALY)
11.9.1. Business Overview
11.9.2. Company Snapshot
11.9.3. Company Market Share Analysis
11.9.4. Company Product Portfolio
11.9.5. Recent Developments
11.9.6. SWOT Analysis
11.10. FRATELLI BRANCA DISTILLERIE SRL(Carpano)
11.10.1. Business Overview
11.10.2. Company Snapshot
11.10.3. Company Market Share Analysis
11.10.4. Company Product Portfolio
11.10.5. Recent Developments
11.10.6. SWOT Analysis
11.11. GiulioCocchiSpumantiSrl
11.11.1. Business Overview
11.11.2. Company Snapshot
11.11.3. Company Market Share Analysis
11.11.4. Company Product Portfolio
11.11.5. Recent Developments
11.11.6. SWOT Analysis
11.12. Imbue
11.12.1. Business Overview
11.12.2. Company Snapshot
11.12.3. Company Market Share Analysis
11.12.4. Company Product Portfolio
11.12.5. Recent Developments
11.12.6. SWOT Analysis
11.13. LA QUINTINYE VERMOUTH ROYAL
11.13.1. Business Overview
11.13.2. Company Snapshot
11.13.3. Company Market Share Analysis
11.13.4. Company Product Portfolio
11.13.5. Recent Developments
11.13.6. SWOT Analysis
11.14. Lo-Fi Aperitifs
11.14.1. Business Overview
11.14.2. Company Snapshot
11.14.3. Company Market Share Analysis
11.14.4. Company Product Portfolio
11.14.5. Recent Developments
11.14.6. SWOT Analysis
11.15. Lustau
11.15.1. Business Overview
11.15.2. Company Snapshot
11.15.3. Company Market Share Analysis
11.15.4. Company Product Portfolio
11.15.5. Recent Developments
11.15.6. SWOT Analysis
11.16. MAiDENii
11.16.1. Business Overview
11.16.2. Company Snapshot
11.16.3. Company Market Share Analysis
11.16.4. Company Product Portfolio
11.16.5. Recent Developments
11.16.6. SWOT Analysis
11.17. MANCINO VERMOUTH
11.17.1. Business Overview
11.17.2. Company Snapshot
11.17.3. Company Market Share Analysis
11.17.4. Company Product Portfolio
11.17.5. Recent Developments
11.17.6. SWOT Analysis
11.18. MARTINEZ LACUESTA
11.18.1. Business Overview
11.18.2. Company Snapshot
11.18.3. Company Market Share Analysis
11.18.4. Company Product Portfolio
11.18.5. Recent Developments
11.18.6. SWOT Analysis
11.19. MARTINI
11.19.1. Business Overview
11.19.2. Company Snapshot
11.19.3. Company Market Share Analysis
11.19.4. Company Product Portfolio
11.19.5. Recent Developments
11.19.6. SWOT Analysis
11.20. Napa, CA.
11.20.1. Business Overview
11.20.2. Company Snapshot
11.20.3. Company Market Share Analysis
11.20.4. Company Product Portfolio
11.20.5. Recent Developments
11.20.6. SWOT Analysis
11.21. NoillyPrat
11.21.1. Business Overview
11.21.2. Company Snapshot
11.21.3. Company Market Share Analysis
11.21.4. Company Product Portfolio
11.21.5. Recent Developments
11.21.6. SWOT Analysis
11.22. Quady Wines
11.22.1. Business Overview
11.22.2. Company Snapshot
11.22.3. Company Market Share Analysis
11.22.4. Company Product Portfolio
11.22.5. Recent Developments
11.22.6. SWOT Analysis
11.23. Ransom
11.23.1. Business Overview
11.23.2. Company Snapshot
11.23.3. Company Market Share Analysis
11.23.4. Company Product Portfolio
11.23.5. Recent Developments
11.23.6. SWOT Analysis
11.24. Regal Rogue
11.24.1. Business Overview
11.24.2. Company Snapshot
11.24.3. Company Market Share Analysis
11.24.4. Company Product Portfolio
11.24.5. Recent Developments
11.24.6. SWOT Analysis
11.25. RISERVA CARLO ALBERTO
11.25.1. Business Overview
11.25.2. Company Snapshot
11.25.3. Company Market Share Analysis
11.25.4. Company Product Portfolio
11.25.5. Recent Developments
11.25.6. SWOT Analysis
11.26. sutton cellars
11.26.1. Business Overview
11.26.2. Company Snapshot
11.26.3. Company Market Share Analysis
11.26.4. Company Product Portfolio
11.26.5. Recent Developments
11.26.6. SWOT Analysis
11.27. UNCOUTH VERMOUTH
11.27.1. Business Overview
11.27.2. Company Snapshot
11.27.3. Company Market Share Analysis
11.27.4. Company Product Portfolio
11.27.5. Recent Developments
11.27.6. SWOT Analysis
List of Table
1. Global Vermouth Market, By Product Type, 2020 - 2033(USD Billion)
2. Global Sweet In Vermouth Market, By Region, 2020 - 2033(USD Billion)
3. Global Dry In Vermouth Market, By Region, 2020 - 2033(USD Billion)
4. Global White Vermouth In Vermouth Market, By Region, 2020 - 2033(USD Billion)
5. Global Vermouth Market, By Packaging, 2020 - 2033(USD Billion)
6. Global Plastic Bottles, Vermouth Market, By Region, 2020 - 2033(USD Billion)
7. Global Glass Bottles, Vermouth Market, By Region, 2020 - 2033(USD Billion)
8. Global Others, Vermouth Market, By Region, 2020 - 2033(USD Billion)
9. Global Vermouth Market, By Distribution Channel, 2020 - 2033(USD Billion)
10. Global Off Trade, Vermouth Market, By Region, 2020 - 2033(USD Billion)
11. Global On Trade, Vermouth Market, By Region, 2020 - 2033 (USD Billion)
12. Global Vermouth Market, By Region, 2020 - 2033(USD Billion)
13. Global Vermouth Market, By North America, 2020 - 2033(USD Billion)
14. North America Vermouth Market, By Product Type, 2020 - 2033(USD Billion)
15. North America Vermouth Market, By Packaging, 2020 - 2033(USD Billion)
16. North America Vermouth Market, By Distribution Channel, 2020 - 2033(USD Billion)
17. U.S. Vermouth Market, By Product Type, 2020 - 2033(USD Billion)
18. U.S. Vermouth Market, By Packaging, 2020 - 2033(USD Billion)
19. U.S. Vermouth Market, By Distribution Channel, 2020 - 2033(USD Billion)
20. Canada Vermouth Market, By Product Type, 2020 - 2033(USD Billion)
21. Canada Vermouth Market, By Packaging, 2020 - 2033(USD Billion)
22. Canada Vermouth Market, By Distribution Channel, 2020 - 2033(USD Billion)
23. Mexico Vermouth Market, By Product Type, 2020 - 2033(USD Billion)
24. Mexico Vermouth Market, By Packaging, 2020 - 2033(USD Billion)
25. Mexico Vermouth Market, By Distribution Channel, 2020 - 2033(USD Billion)
26. Europe Vermouth Market, By Product Type, 2020 - 2033(USD Billion)
27. Europe Vermouth Market, By Packaging, 2020 - 2033(USD Billion)
28. Europe Vermouth Market, By Distribution Channel, 2020 - 2033(USD Billion)
29. Germany Vermouth Market, By Product Type, 2020 - 2033(USD Billion)
30. Germany Vermouth Market, By Packaging, 2020 - 2033(USD Billion)
31. Germany Vermouth Market, By Distribution Channel, 2020 - 2033(USD Billion)
32. France Vermouth Market, By Product Type, 2020 - 2033(USD Billion)
33. France Vermouth Market, By Packaging, 2020 - 2033(USD Billion)
34. France Vermouth Market, By Distribution Channel, 2020 - 2033(USD Billion)
35. U.K. Vermouth Market, By Product Type, 2020 - 2033(USD Billion)
36. U.K. Vermouth Market, By Packaging, 2020 - 2033(USD Billion)
37. U.K. Vermouth Market, By Distribution Channel, 2020 - 2033(USD Billion)
38. Italy Vermouth Market, By Product Type, 2020 - 2033(USD Billion)
39. Italy Vermouth Market, By Packaging, 2020 - 2033(USD Billion)
40. Italy Vermouth Market, By Distribution Channel, 2020 - 2033(USD Billion)
41. Spain Vermouth Market, By Product Type, 2020 - 2033(USD Billion)
42. Spain Vermouth Market, By Packaging, 2020 - 2033(USD Billion)
43. Spain Vermouth Market, By Distribution Channel, 2020 - 2033(USD Billion)
44. Asia Pacific Vermouth Market, By Product Type, 2020 - 2033(USD Billion)
45. Asia Pacific Vermouth Market, By Packaging, 2020 - 2033(USD Billion)
46. Asia Pacific Vermouth Market, By Distribution Channel, 2020 - 2033(USD Billion)
47. Japan Vermouth Market, By Product Type, 2020 - 2033(USD Billion)
48. Japan Vermouth Market, By Packaging, 2020 - 2033(USD Billion)
49. Japan Vermouth Market, By Distribution Channel, 2020 - 2033(USD Billion)
50. China Vermouth Market, By Product Type, 2020 - 2033(USD Billion)
51. China Vermouth Market, By Packaging, 2020 - 2033(USD Billion)
52. China Vermouth Market, By Distribution Channel, 2020 - 2033(USD Billion)
53. India Vermouth Market, By Product Type, 2020 - 2033(USD Billion)
54. India Vermouth Market, By Packaging, 2020 - 2033(USD Billion)
55. India Vermouth Market, By Distribution Channel, 2020 - 2033(USD Billion)
56. South America Vermouth Market, By Product Type, 2020 - 2033(USD Billion)
57. South America Vermouth Market, By Packaging, 2020 - 2033(USD Billion)
58. South America Vermouth Market, By Distribution Channel, 2020 - 2033(USD Billion)
59. Brazil Vermouth Market, By Product Type, 2020 - 2033(USD Billion)
60. Brazil Vermouth Market, By Packaging, 2020 - 2033(USD Billion)
61. Brazil Vermouth Market, By Distribution Channel, 2020 - 2033(USD Billion)
62. Middle East and Africa Vermouth Market, By Product Type, 2020 - 2033(USD Billion)
63. Middle East and Africa Vermouth Market, By Packaging, 2020 - 2033(USD Billion)
64. Middle East Vermouth Market, By Distribution Channel, 2020 - 2033(USD Billion)
65. UAE Vermouth Market, By Product Type, 2020 - 2033(USD Billion)
66. UAE Vermouth Market, By Packaging, 2020 - 2033(USD Billion)
67. UAE Vermouth Market, By Distribution Channel, 2020 - 2033(USD Billion)
68. South Africa Vermouth Market, By Product Type, 2020 - 2033(USD Billion)
69. South Africa Vermouth Market, By Packaging, 2020 - 2033(USD Billion)
70. South Africa Vermouth Market, By Distribution Channel, 2020 - 2033(USD Billion)
List of Figures
1. Global Vermouth Market Segmentation
2. Vermouth Market: Research Methodology
3. Market Size Estimation Methodology: Bottom-Up Approach
4. Market Size Estimation Methodology: Top-Down Approach
5. Data Triangulation
6. Porter’s Five Forces Analysis
7. Value Chain Analysis
8. Global Vermouth Market Attractiveness Analysis By Product Type
9. Global Vermouth Market Attractiveness Analysis By Packaging
10. Global Vermouth Market Attractiveness Analysis By Distribution Channel
11. Global Vermouth Market Attractiveness Analysis By Region
12. Global Vermouth Market: Dynamics
13. Global Vermouth Market Share By Product Type (2023 & 2033)
14. Global Vermouth Market Share By Packaging (2023 & 2033)
15. Global Vermouth Market Share By Distribution Channel (2023 & 2033)
16. Global Vermouth Market Share by Regions (2023 & 2033)
17. Global Vermouth Market Share by Company (2023)
This study forecasts revenue growth at global, regional, and country levels from 2020 to 2033. The Brainy Insights has segmented the global vermouth market on the basis of below mentioned segments:
Global Vermouth Market by Product Type:
Global Vermouth Market by Packaging:
Global Vermouth Market by Distribution Channel:
Global Vermouth Market by Region:
Research has its special purpose to undertake marketing efficiently. In this competitive scenario, businesses need information across all industry verticals; the information about customer wants, market demand, competition, industry trends, distribution channels etc. This information needs to be updated regularly because businesses operate in a dynamic environment. Our organization, The Brainy Insights incorporates scientific and systematic research procedures in order to get proper market insights and industry analysis for overall business success. The analysis consists of studying the market from a miniscule level wherein we implement statistical tools which helps us in examining the data with accuracy and precision.
Our research reports feature both; quantitative and qualitative aspects for any market. Qualitative information for any market research process are fundamental because they reveal the customer needs and wants, usage and consumption for any product/service related to a specific industry. This in turn aids the marketers/investors in knowing certain perceptions of the customers. Qualitative research can enlighten about the different product concepts and designs along with unique service offering that in turn, helps define marketing problems and generate opportunities. On the other hand, quantitative research engages with the data collection process through interviews, e-mail interactions, surveys and pilot studies. Quantitative aspects for the market research are useful to validate the hypotheses generated during qualitative research method, explore empirical patterns in the data with the help of statistical tools, and finally make the market estimations.
The Brainy Insights offers comprehensive research and analysis, based on a wide assortment of factual insights gained through interviews with CXOs and global experts and secondary data from reliable sources. Our analysts and industry specialist assume vital roles in building up statistical tools and analysis models, which are used to analyse the data and arrive at accurate insights with exceedingly informative research discoveries. The data provided by our organization have proven precious to a diverse range of companies, facilitating them to address issues such as determining which products/services are the most appealing, whether or not customers use the product in the manner anticipated, the purchasing intentions of the market and many others.
Our research methodology encompasses an idyllic combination of primary and secondary initiatives. Key phases involved in this process are listed below:

The phase involves the gathering and collecting of market data and its related information with the help of different sources & research procedures.

The data procurement stage involves in data gathering and collecting through various data sources.
This stage involves in extensive research. These data sources includes:
Purchased Database: Purchased databases play a crucial role in estimating the market sizes irrespective of the domain. Our purchased database includes:
Primary Research: The Brainy Insights interacts with leading companies and experts of the concerned domain to develop the analyst team’s market understanding and expertise. It improves and substantiates every single data presented in the market reports. Primary research mainly involves in telephonic interviews, E-mail interactions and face-to-face interviews with the raw material providers, manufacturers/producers, distributors, & independent consultants. The interviews that we conduct provides valuable data on market size and industry growth trends prevailing in the market. Our organization also conducts surveys with the various industry experts in order to gain overall insights of the industry/market. For instance, in healthcare industry we conduct surveys with the pharmacists, doctors, surgeons and nurses in order to gain insights and key information of a medical product/device/equipment which the customers are going to usage. Surveys are conducted in the form of questionnaire designed by our own analyst team. Surveys plays an important role in primary research because surveys helps us to identify the key target audiences of the market. Additionally, surveys helps to identify the key target audience engaged with the market. Our survey team conducts the survey by targeting the key audience, thus gaining insights from them. Based on the perspectives of the customers, this information is utilized to formulate market strategies. Moreover, market surveys helps us to understand the current competitive situation of the industry. To be precise, our survey process typically involve with the 360 analysis of the market. This analytical process begins by identifying the prospective customers for a product or service related to the market/industry to obtain data on how a product/service could fit into customers’ lives.

Secondary Research: The secondary data sources includes information published by the on-profit organizations such as World bank, WHO, company fillings, investor presentations, annual reports, national government documents, statistical databases, blogs, articles, white papers and others. From the annual report, we analyse a company’s revenue to understand the key segment and market share of that organization in a particular region. We analyse the company websites and adopt the product mapping technique which is important for deriving the segment revenue. In the product mapping method, we select and categorize the products offered by the companies catering to domain specific market, deduce the product revenue for each of the companies so as to get overall estimation of the market size. We also source data and analyses trends based on information received from supply side and demand side intermediaries in the value chain. The supply side denotes the data gathered from supplier, distributor, wholesaler and the demand side illustrates the data gathered from the end customers for respective market domain.

The supply side for a domain specific market is analysed by:
The demand side for the market is estimated through:
In-house Library: Apart from these third-party sources, we have our in-house library of qualitative and quantitative information. Our in-house database includes market data for various industry and domains. These data are updated on regular basis as per the changing market scenario. Our library includes, historic databases, internal audit reports and archives.
Sometimes there are instances where there is no metadata or raw data available for any domain specific market. For those cases, we use our expertise to forecast and estimate the market size in order to generate comprehensive data sets. Our analyst team adopt a robust research technique in order to produce the estimates:
Data Synthesis: This stage involves the analysis & mapping of all the information obtained from the previous step. It also involves in scrutinizing the data for any discrepancy observed while data gathering related to the market. The data is collected with consideration to the heterogeneity of sources. Robust scientific techniques are in place for synthesizing disparate data sets and provide the essential contextual information that can orient market strategies. The Brainy Insights has extensive experience in data synthesis where the data passes through various stages:


Market Deduction & Formulation: The final stage comprises of assigning data points at appropriate market spaces so as to deduce feasible conclusions. Analyst perspective & subject matter expert based holistic form of market sizing coupled with industry analysis also plays a crucial role in this stage.
This stage involves in finalization of the market size and numbers that we have collected from data integration step. With data interpolation, it is made sure that there is no gap in the market data. Successful trend analysis is done by our analysts using extrapolation techniques, which provide the best possible forecasts for the market.
Data Validation & Market Feedback: Validation is the most important step in the process. Validation & re-validation via an intricately designed process helps us finalize data-points to be used for final calculations.

The Brainy Insights interacts with leading companies and experts of the concerned domain to develop the analyst team’s market understanding and expertise. It improves and substantiates every single data presented in the market reports. The data validation interview and discussion panels are typically composed of the most experienced industry members. The participants include, however, are not limited to:
Moreover, we always validate our data and findings through primary respondents from all the major regions we are working on.


Free Customization
Fortune 500 Clients
Free Yearly Update On Purchase Of Multi/Corporate License
Companies Served Till Date