- +1-315-215-1633
- sales@thebrainyinsights.com

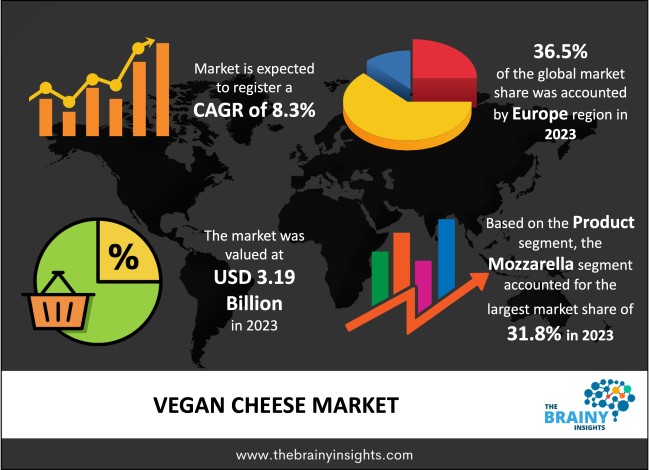
The global vegan cheese market was valued at USD 3.19 billion in 2023 and grew at a CAGR of 8.3% from 2024 to 2033. The market is expected to reach USD 7.13 billion by 2033. The market is growing as veganism, particularly among millennials, becomes more and more well-liked. Due to growing public awareness of animal cruelty and the damaging effects the dairy industry has on the environment, consumers are being encouraged to prefer plant-based products. The demand for vegan food products has significantly increased throughout this time. For instance, in the United States, the commerce in plant-based meals went from USD 5.0 billion in 2019 to USD 7.0 billion in 2020. In this circumstance, it is projected that the market prospects would continue positive.
Changing food preferences and new food and beverage industry trends are increasing the global demand for vegan cheese. The rise in lactose intolerance population and other food allergies in children and adults has shifted consumer choices in recent years. Data from the Food Intolerance Network indicates that about 70% of the global population experienced lactose intolerance in 2019. The growing interest in vegan and vegetarian diets among millennials will likely drive growth in the hotel/restaurant/café (HoReCa) sector. For example, Saudi Arabia has seen an increase in vegan restaurants aimed at promoting healthier lifestyles. Furthermore, a rising awareness of animal welfare and growing concerns about the environmental impact of animal-based diets are compelling more consumers to opt for plant-based alternatives. This shift is not just about avoiding meat; it also involves steering clear of all animal-derived products, including cheese, milk, cream, yoghurt, and honey. This ethical and sustainable approach to food consumption is expected to further boost the market for vegan cheese.
A global trend is the introduction of plant-based goods that can replace dairy products. This is related to an increase in vegans, a rise in animal welfare and health concerns, and a trend for those with dairy allergies to eat more plant-based cuisine. The same proteins, carbohydrates, and vitamins are present in vegan cheese as in dairy cheese. Additionally, vegan cheese contains a lot less fat than dairy cheese. Eating vegan cuisine benefits people's health. Veganism, once perceived as a fleeting trend, has now been embraced by millennials, establishing it as a mainstream lifestyle choice. Rising awareness regarding animal welfare and sustainability creates significant opportunities for producers within the vegan cheese industry sector. Additionally, rising health concerns associated with dairy consumption are prompting more individuals to adopt a vegan diet. Many research studies indicate that using hormones, allergens, and antibiotics in cattle to enhance production negatively affects the dairy industry. In response to the growing global interest in veganism, numerous manufacturers in the food and beverage sector are prioritizing the development of vegan products. The active participation of various sports figures and celebrities in promoting vegan offerings is a clear indication of the potential for growth in the vegan market, further driving the growth of the vegan cheese market.
Get an overview of this study by requesting a free sample
Many people are looking for cruelty-free substitutes because they have concerns about how animals are treated in the dairy business. For individuals who prefer to stay away from supporting animal abuse, vegan cheese, which is composed completely of plant-based components, offers an ethical option. Additionally, growing knowledge of the advantages of plant-based diets for health has affected consumer decisions. Vegan cheese is a desirable alternative for people who care about their health since it is frequently lower in saturated fats, cholesterol-free, and lactose-free than typical dairy cheese.
Due to the higher expense of plant-based components and manufacturing techniques, vegan cheese, particularly artisanal or specialized types, can be more costly than dairy cheese. For certain users, the availability and affordability of vegan cheese may be constrained by higher price points. Compared to regular cheese, certain vegan cheese items may have a shorter duration of shelf life, which could impact distribution and availability. To assure freshness and reduce waste, this restriction could force manufacturers and merchants to establish effective supply chain management.
There is room to increase the selection of vegan cheese items on the market. To accommodate a range of consumer tastes, manufacturers might develop new tastes, textures, and forms. This involves creating aged cheeses, spreadable cheeses, artisanal variants, and cheese substitutes made particularly for melting or grating.
Europe led the market in 2022 with the largest market share of 36.1%. Customers are increasingly choosing more ecologically friendly and vegan items as a result of growing awareness of animal cruelty and the region's rising carbon footprint caused by the use of foods produced from animals, such as milk, honey, eggs, cattle, pig, and seafood.
Europe Region Vegan Cheese Market Share in 2023 - 36.5%
www.thebrainyinsights.com
Check the geographical analysis of this market by requesting a free sample
The cashew segment dominated the global market in 2023 with a market share of 37.4% and throughout the predicted period, is anticipated to keep up its leading position. Vegan cheese made from cashews is low in fat and includes vitamins B2 and B12. This makes it popular with people that care about their health all around the world. Due to its health advantages, free of gluten and free of cholesterol cashew products are also becoming increasingly popular.
The mozzarella segment held a significant market share of 31.8% in 2023. Pizza toppings commonly include mozzarella cheese, and the increasing demand for vegan pizzas has driven the expansion of the vegan mozzarella market. Excellent vegan mozzarella cheese which melts stretches and imparts the same taste and texture as regular mozzarella is excellent potential as more customers look for plant-based alternatives. Adding vital elements like calcium and vitamin B12 to vegan mozzarella alternatives might boost their nutritional value and draw in health-conscious customers. A selling pitch for this market might be emphasizing the nutritional advantages of vegan mozzarella, such as its reduced amount of saturated fat and lack of cholesterol.
The B2C segment held a significant market share of 52.4% in 2023. The market for plant-based products in the B2C market has grown as a result of factors such as rising consumer disposable income levels and their desire to spend on high-end goods. The simple availability of products in convenience stores and supermarkets has also aided in this segment's expansion.
| Attribute | Description |
|---|---|
| Market Size | Revenue (USD Billion) |
| Market size value in 2023 | USD 3.19 Billion |
| Market size value in 2033 | USD 7.13 Billion |
| CAGR (2024 to 2033) | 8.3% |
| Historical data | 2020-2022 |
| Base Year | 2023 |
| Forecast | 2024-2033 |
| Region | The regions analyzed for the market are Asia Pacific, Europe, South America, North America, and Middle East & Africa. Furthermore, the regions are further analyzed at the country level. |
| Segments | Source, Product, End-use |
As per The Brainy Insights, the size of the vegan cheese market was valued at USD 3.19 billion in 2023 to USD 7.13 billion by 2033.
The global vegan cheese market is growing at a CAGR of 8.3% during the forecast period 2024-2033.
The Europe region emerged as the largest market for the vegan cheese.
Rise in concerns regarding animal cruelty will influence the market's growth.
1. Introduction
1.1. Objectives of the Study
1.2. Market Definition
1.3. Research Scope
1.4. Currency
1.5. Key Target Audience
2. Research Methodology and Assumptions
3. Executive Summary
4. Premium Insights
4.1. Porter’s Five Forces Analysis
4.2. Value Chain Analysis
4.3. Top Investment Pockets
4.3.1. Market Attractiveness Analysis by Source
4.3.2. Market Attractiveness Analysis by Product
4.3.3. Market Attractiveness Analysis by End-Use
4.3.4. Market Attractiveness Analysis by Region
4.4. Industry Trends
5. Market Dynamics
5.1. Market Evaluation
5.2. Drivers
5.2.1. Rise in concerns regarding animal cruelty
5.3. Restraints
5.3.1. High cost of the Vegan Cheese
5.4. Opportunities
5.4.1. Product development
5.5. Challenges
5.5.1. Issues with supply chain
6. Global Vegan Cheese Market Analysis and Forecast, By Source
6.1. Segment Overview
6.2. Soy
6.3. Cashew
6.4. Almond
6.5. Coconut
6.6. Others
7. Global Vegan Cheese Market Analysis and Forecast, By Product
7.1. Segment Overview
7.2. Cheddar
7.3. Parmesan
7.4. Cream Cheese
7.5. Mozzarella
7.6. Ricotta
7.7. Others
8. Global Vegan Cheese Market Analysis and Forecast, By End-Use
8.1. Segment Overview
8.2. B2B
8.3. B2C
9. Global Vegan Cheese Market Analysis and Forecast, By Regional Analysis
9.1. Segment Overview
9.2. North America
9.2.1. U.S.
9.2.2. Canada
9.2.3. Mexico
9.3. Europe
9.3.1. Germany
9.3.2. France
9.3.3. U.K.
9.3.4. Italy
9.3.5. Spain
9.4. Asia-Pacific
9.4.1. Japan
9.4.2. China
9.4.3. India
9.5. South America
9.5.1. Brazil
9.6. Middle East and Africa
9.6.1. UAE
9.6.2. South Africa
10. Global Vegan Cheese Market-Competitive Landscape
10.1. Overview
10.2. Market Share of Key Players in the Vegan Cheese Market
10.2.1. Global Company Market Share
10.2.2. North America Company Market Share
10.2.3. Europe Company Market Share
10.2.4. APAC Company Market Share
10.3. Competitive Situations and Trends
10.3.1. Product Launches and Developments
10.3.2. Partnerships, Collaborations, and Agreements
10.3.3. Mergers & Acquisitions
10.3.4. Expansions
11. Company Profiles
11.1. Dr-Cow Tree Nut Cheese
11.1.1. Business Overview
11.1.2. Company Snapshot
11.1.3. Company Market Share Analysis
11.1.4. Company Product Portfolio
11.1.5. Recent Developments
11.1.6. SWOT Analysis
11.2. Tofutti Brands, Inc.
11.2.1. Business Overview
11.2.2. Company Snapshot
11.2.3. Company Market Share Analysis
11.2.4. Company Product Portfolio
11.2.5. Recent Developments
11.2.6. SWOT Analysis
11.3. Tyne Cheese Limited
11.3.1. Business Overview
11.3.2. Company Snapshot
11.3.3. Company Market Share Analysis
11.3.4. Company Product Portfolio
11.3.5. Recent Developments
11.3.6. SWOT Analysis
11.4. Miyoko's Creamery
11.4.1. Business Overview
11.4.2. Company Snapshot
11.4.3. Company Market Share Analysis
11.4.4. Company Product Portfolio
11.4.5. Recent Developments
11.4.6. SWOT Analysis
11.5. Parmela Creamery
11.5.1. Business Overview
11.5.2. Company Snapshot
11.5.3. Company Market Share Analysis
11.5.4. Company Product Portfolio
11.5.5. Recent Developments
11.5.6. SWOT Analysis
11.6. Parmela Creamery
11.6.1. Business Overview
11.6.2. Company Snapshot
11.6.3. Company Market Share Analysis
11.6.4. Company Product Portfolio
11.6.5. Recent Developments
11.6.6. SWOT Analysis
11.7. Follow Your Heart
11.7.1. Business Overview
11.7.2. Company Snapshot
11.7.3. Company Market Share Analysis
11.7.4. Company Product Portfolio
11.7.5. Recent Developments
11.7.6. SWOT Analysis
11.8. Daiya Foods Inc.
11.8.1. Business Overview
11.8.2. Company Snapshot
11.8.3. Company Market Share Analysis
11.8.4. Company Product Portfolio
11.8.5. Recent Developments
11.8.6. SWOT Analysis
11.9. Kite Hill
11.9.1. Business Overview
11.9.2. Company Snapshot
11.9.3. Company Market Share Analysis
11.9.4. Company Product Portfolio
11.9.5. Recent Developments
11.9.6. SWOT Analysis
11.10. Violife
11.10.1. Business Overview
11.10.2. Company Snapshot
11.10.3. Company Market Share Analysis
11.10.4. Company Product Portfolio
11.10.5. Recent Developments
11.10.6. SWOT Analysis
List of Table
1. Global Vegan Cheese Market, By Source, 2020-2033 (USD Billion)
2. Global Soy, Vegan Cheese Market, By Region, 2020-2033 (USD Billion)
3. Global Cashew, Vegan Cheese Market, By Region, 2020-2033 (USD Billion)
4. Global Almond, Vegan Cheese Market, By Region, 2020-2033 (USD Billion)
5. Global Coconut, Vegan Cheese Market, By Region, 2020-2033 (USD Billion)
6. Global Others, Vegan Cheese Market, By Region, 2020-2033 (USD Billion)
7. Global Vegan Cheese Market, By Product, 2020-2033 (USD Billion)
8. Global Cheddar, Vegan Cheese Market, By Region, 2020-2033 (USD Billion)
9. Global Parmesan, Vegan Cheese Market, By Region, 2020-2033 (USD Billion)
10. Global Cream Cheese, Vegan Cheese Market, By Region, 2020-2033 (USD Billion)
11. Global Mozzarella, Vegan Cheese Market, By Region, 2020-2033 (USD Billion)
12. Global Ricotta, Vegan Cheese Market, By Region, 2020-2033 (USD Billion)
13. Global Others, Vegan Cheese Market, By Region, 2020-2033 (USD Billion)
14. Global Vegan Cheese Market, By End-Use, 2020-2033 (USD Billion)
15. Global B2B, Vegan Cheese Market, By Region, 2020-2033 (USD Billion)
16. Global B2C, Vegan Cheese Market, By Region, 2020-2033 (USD Billion)
17. Global Vegan Cheese Market, By Region, 2020-2033 (USD Billion)
18. North America Vegan Cheese Market, By Source, 2020-2033 (USD Billion)
19. North America Vegan Cheese Market, By Product, 2020-2033 (USD Billion)
20. North America Vegan Cheese Market, By End-Use, 2020-2033 (USD Billion)
21. U.S. Vegan Cheese Market, By Source, 2020-2033 (USD Billion)
22. U.S. Vegan Cheese Market, By Product, 2020-2033 (USD Billion)
23. U.S. Vegan Cheese Market, By End-Use, 2020-2033 (USD Billion)
24. Canada Vegan Cheese Market, By Source, 2020-2033 (USD Billion)
25. Canada Vegan Cheese Market, By Product, 2020-2033 (USD Billion)
26. Canada Vegan Cheese Market, By End-Use, 2020-2033 (USD Billion)
27. Mexico Vegan Cheese Market, By Source, 2020-2033 (USD Billion)
28. Mexico Vegan Cheese Market, By Product, 2020-2033 (USD Billion)
29. Mexico Vegan Cheese Market, By End-Use, 2020-2033 (USD Billion)
30. Europe Vegan Cheese Market, By Source, 2020-2033 (USD Billion)
31. Europe Vegan Cheese Market, By Product, 2020-2033 (USD Billion)
32. Europe Vegan Cheese Market, By End-Use, 2020-2033 (USD Billion)
33. Germany Vegan Cheese Market, By Source, 2020-2033 (USD Billion)
34. Germany Vegan Cheese Market, By Product, 2020-2033 (USD Billion)
35. Germany Vegan Cheese Market, By End-Use, 2020-2033 (USD Billion)
36. France Vegan Cheese Market, By Source, 2020-2033 (USD Billion)
37. France Vegan Cheese Market, By Product, 2020-2033 (USD Billion)
38. France Vegan Cheese Market, By End-Use, 2020-2033 (USD Billion)
39. U.K. Vegan Cheese Market, By Source, 2020-2033 (USD Billion)
40. U.K. Vegan Cheese Market, By Product, 2020-2033 (USD Billion)
41. U.K. Vegan Cheese Market, By End-Use, 2020-2033 (USD Billion)
42. Italy Vegan Cheese Market, By Source, 2020-2033 (USD Billion)
43. Italy Vegan Cheese Market, By Product, 2020-2033 (USD Billion)
44. Italy Vegan Cheese Market, By End-Use, 2020-2033 (USD Billion)
45. Spain Vegan Cheese Market, By Source, 2020-2033 (USD Billion)
46. Spain Vegan Cheese Market, By Product, 2020-2033 (USD Billion)
47. Spain Vegan Cheese Market, By End-Use, 2020-2033 (USD Billion)
48. Asia Pacific Vegan Cheese Market, By Source, 2020-2033 (USD Billion)
49. Asia Pacific Vegan Cheese Market, By Product, 2020-2033 (USD Billion)
50. Asia Pacific Vegan Cheese Market, By End-Use, 2020-2033 (USD Billion)
51. Japan Vegan Cheese Market, By Source, 2020-2033 (USD Billion)
52. Japan Vegan Cheese Market, By Product, 2020-2033 (USD Billion)
53. Japan Vegan Cheese Market, By End-Use, 2020-2033 (USD Billion)
54. China Vegan Cheese Market, By Source, 2020-2033 (USD Billion)
55. China Vegan Cheese Market, By Product, 2020-2033 (USD Billion)
56. China Vegan Cheese Market, By End-Use, 2020-2033 (USD Billion)
57. India Vegan Cheese Market, By Source, 2020-2033 (USD Billion)
58. India Vegan Cheese Market, By Product, 2020-2033 (USD Billion)
59. India Vegan Cheese Market, By End-Use, 2020-2033 (USD Billion)
60. South America Vegan Cheese Market, By Source, 2020-2033 (USD Billion)
61. South America Vegan Cheese Market, By Product, 2020-2033 (USD Billion)
62. South America Vegan Cheese Market, By End-Use, 2020-2033 (USD Billion)
63. Brazil Vegan Cheese Market, By Source, 2020-2033 (USD Billion)
64. Brazil Vegan Cheese Market, By Product, 2020-2033 (USD Billion)
65. Brazil Vegan Cheese Market, By End-Use, 2020-2033 (USD Billion)
66. Middle East and Africa Vegan Cheese Market, By Source, 2020-2033 (USD Billion)
67. Middle East and Africa Vegan Cheese Market, By Product, 2020-2033 (USD Billion)
68. Middle East and Africa Vegan Cheese Market, By End-Use, 2020-2033 (USD Billion)
69. UAE Vegan Cheese Market, By Source, 2020-2033 (USD Billion)
70. UAE Vegan Cheese Market, By Product, 2020-2033 (USD Billion)
71. UAE Vegan Cheese Market, By End-Use, 2020-2033 (USD Billion)
72. South Africa Vegan Cheese Market, By Source, 2020-2033 (USD Billion)
73. South Africa Vegan Cheese Market, By Product, 2020-2033 (USD Billion)
74. South Africa Vegan Cheese Market, By End-Use, 2020-2033 (USD Billion)
List of Figures
1. Global Vegan Cheese Market Segmentation
2. Vegan Cheese Market: Research Methodology
3. Market Size Estimation Methodology: Bottom-Up Approach
4. Market Size Estimation Methodology: Top-Down Approach
5. Data Triangulation
6. Porter’s Five Forces Analysis
7. Value Chain Analysis
8. Global Vegan Cheese Market Attractiveness Analysis by Source
9. Global Vegan Cheese Market Attractiveness Analysis by Product
10. Global Vegan Cheese Market Attractiveness Analysis by End-Use
11. Global Vegan Cheese Market Attractiveness Analysis by Region
12. Global Vegan Cheese Market: Dynamics
13. Global Vegan Cheese Market Share by Source (2023 & 2033)
14. Global Vegan Cheese Market Share by Product (2023 & 2033)
15. Global Vegan Cheese Market Share by End-Use (2023 & 2033)
16. Global Vegan Cheese Market Share by Regions (2023 & 2033)
17. Global Vegan Cheese Market Share by Company (2023)
This study forecasts revenue at global, regional, and country levels from 2020 to 2033. The Brainy Insights has segmented the global vegan cheese market based on below-mentioned segments:
Global Vegan Cheese Market by Source:
Global Vegan Cheese Market by Product:
Global Vegan Cheese Market by End-Use:
Global Vegan Cheese Market by Region:
Research has its special purpose to undertake marketing efficiently. In this competitive scenario, businesses need information across all industry verticals; the information about customer wants, market demand, competition, industry trends, distribution channels etc. This information needs to be updated regularly because businesses operate in a dynamic environment. Our organization, The Brainy Insights incorporates scientific and systematic research procedures in order to get proper market insights and industry analysis for overall business success. The analysis consists of studying the market from a miniscule level wherein we implement statistical tools which helps us in examining the data with accuracy and precision.
Our research reports feature both; quantitative and qualitative aspects for any market. Qualitative information for any market research process are fundamental because they reveal the customer needs and wants, usage and consumption for any product/service related to a specific industry. This in turn aids the marketers/investors in knowing certain perceptions of the customers. Qualitative research can enlighten about the different product concepts and designs along with unique service offering that in turn, helps define marketing problems and generate opportunities. On the other hand, quantitative research engages with the data collection process through interviews, e-mail interactions, surveys and pilot studies. Quantitative aspects for the market research are useful to validate the hypotheses generated during qualitative research method, explore empirical patterns in the data with the help of statistical tools, and finally make the market estimations.
The Brainy Insights offers comprehensive research and analysis, based on a wide assortment of factual insights gained through interviews with CXOs and global experts and secondary data from reliable sources. Our analysts and industry specialist assume vital roles in building up statistical tools and analysis models, which are used to analyse the data and arrive at accurate insights with exceedingly informative research discoveries. The data provided by our organization have proven precious to a diverse range of companies, facilitating them to address issues such as determining which products/services are the most appealing, whether or not customers use the product in the manner anticipated, the purchasing intentions of the market and many others.
Our research methodology encompasses an idyllic combination of primary and secondary initiatives. Key phases involved in this process are listed below:

The phase involves the gathering and collecting of market data and its related information with the help of different sources & research procedures.

The data procurement stage involves in data gathering and collecting through various data sources.
This stage involves in extensive research. These data sources includes:
Purchased Database: Purchased databases play a crucial role in estimating the market sizes irrespective of the domain. Our purchased database includes:
Primary Research: The Brainy Insights interacts with leading companies and experts of the concerned domain to develop the analyst team’s market understanding and expertise. It improves and substantiates every single data presented in the market reports. Primary research mainly involves in telephonic interviews, E-mail interactions and face-to-face interviews with the raw material providers, manufacturers/producers, distributors, & independent consultants. The interviews that we conduct provides valuable data on market size and industry growth trends prevailing in the market. Our organization also conducts surveys with the various industry experts in order to gain overall insights of the industry/market. For instance, in healthcare industry we conduct surveys with the pharmacists, doctors, surgeons and nurses in order to gain insights and key information of a medical product/device/equipment which the customers are going to usage. Surveys are conducted in the form of questionnaire designed by our own analyst team. Surveys plays an important role in primary research because surveys helps us to identify the key target audiences of the market. Additionally, surveys helps to identify the key target audience engaged with the market. Our survey team conducts the survey by targeting the key audience, thus gaining insights from them. Based on the perspectives of the customers, this information is utilized to formulate market strategies. Moreover, market surveys helps us to understand the current competitive situation of the industry. To be precise, our survey process typically involve with the 360 analysis of the market. This analytical process begins by identifying the prospective customers for a product or service related to the market/industry to obtain data on how a product/service could fit into customers’ lives.

Secondary Research: The secondary data sources includes information published by the on-profit organizations such as World bank, WHO, company fillings, investor presentations, annual reports, national government documents, statistical databases, blogs, articles, white papers and others. From the annual report, we analyse a company’s revenue to understand the key segment and market share of that organization in a particular region. We analyse the company websites and adopt the product mapping technique which is important for deriving the segment revenue. In the product mapping method, we select and categorize the products offered by the companies catering to domain specific market, deduce the product revenue for each of the companies so as to get overall estimation of the market size. We also source data and analyses trends based on information received from supply side and demand side intermediaries in the value chain. The supply side denotes the data gathered from supplier, distributor, wholesaler and the demand side illustrates the data gathered from the end customers for respective market domain.

The supply side for a domain specific market is analysed by:
The demand side for the market is estimated through:
In-house Library: Apart from these third-party sources, we have our in-house library of qualitative and quantitative information. Our in-house database includes market data for various industry and domains. These data are updated on regular basis as per the changing market scenario. Our library includes, historic databases, internal audit reports and archives.
Sometimes there are instances where there is no metadata or raw data available for any domain specific market. For those cases, we use our expertise to forecast and estimate the market size in order to generate comprehensive data sets. Our analyst team adopt a robust research technique in order to produce the estimates:
Data Synthesis: This stage involves the analysis & mapping of all the information obtained from the previous step. It also involves in scrutinizing the data for any discrepancy observed while data gathering related to the market. The data is collected with consideration to the heterogeneity of sources. Robust scientific techniques are in place for synthesizing disparate data sets and provide the essential contextual information that can orient market strategies. The Brainy Insights has extensive experience in data synthesis where the data passes through various stages:


Market Deduction & Formulation: The final stage comprises of assigning data points at appropriate market spaces so as to deduce feasible conclusions. Analyst perspective & subject matter expert based holistic form of market sizing coupled with industry analysis also plays a crucial role in this stage.
This stage involves in finalization of the market size and numbers that we have collected from data integration step. With data interpolation, it is made sure that there is no gap in the market data. Successful trend analysis is done by our analysts using extrapolation techniques, which provide the best possible forecasts for the market.
Data Validation & Market Feedback: Validation is the most important step in the process. Validation & re-validation via an intricately designed process helps us finalize data-points to be used for final calculations.

The Brainy Insights interacts with leading companies and experts of the concerned domain to develop the analyst team’s market understanding and expertise. It improves and substantiates every single data presented in the market reports. The data validation interview and discussion panels are typically composed of the most experienced industry members. The participants include, however, are not limited to:
Moreover, we always validate our data and findings through primary respondents from all the major regions we are working on.


Free Customization
Fortune 500 Clients
Free Yearly Update On Purchase Of Multi/Corporate License
Companies Served Till Date