- +1-315-215-1633
- sales@thebrainyinsights.com

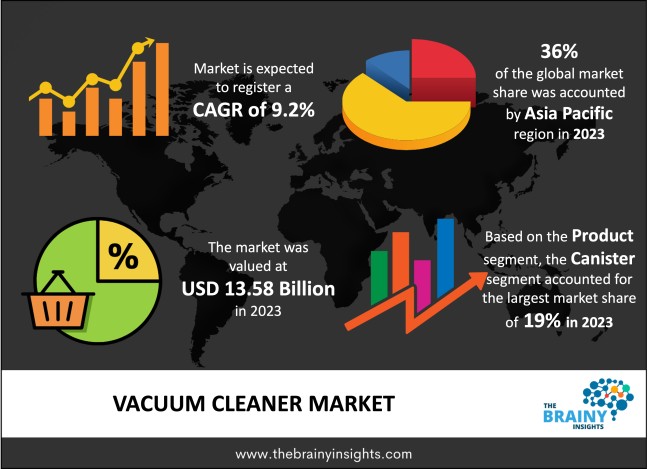
The global vacuum cleaner market was valued at USD 13.58 billion in 2023 and growing at a CAGR of 9.2% from 2024 to 2033. The market is expected to reach USD 32.74 billion by 2033. The advancement in need for automatic & fastest cleaning solutions, risen disposable income, and more appropriate infrastructural facilities push the market. The growth in urban population and high cost of living in developing economies improve the vacuum cleaners market growth. The developing interest of tech-savvy people and the invention of traditional vacuum cleaners are expected to propel the demand for energy-efficient products in the market.
The demand for vacuum cleaners can be credited to growing usage across residential, commercial, and industrial environments. This growth is further boosted by changing lifestyles, higher disposable income, and a larger workforce. Moreover, technological advancements that provide ease of use with minimal human intervention have substantially boosted the market's expansion; an illustrative example is robotic vacuum cleaners, which autonomously clean spaces with high-efficiency levels.
Vacuum cleaners are easy yet effective designs that have done away with cleaning dust and other small particles off surfaces by hand and turned house cleaning into a more efficient and relatively quick job. Using nothing but suction, the vacuum removes dirt and stores it for disposal. The easiest method to describe the working of vacuum cleaners that can suck up debris is to consider each like a straw. Like taking a sip of a drink through a straw, sucking forms a negative air pressure inside the straw, a pressure lower than that of the surrounding atmosphere. The vacuum cleaner forms a negative pressure inside, which causes air to flow into it. Vacuum cleaners use an electric motor that rotates a fan, sucking in the air and any small particles caught up in it and pushing it out the other side into a bag or a canister to form negative pressure. The vacuum has an exhaust port that vents the air out the other side, allowing the motor to continue to function naturally. The power of a vacuum cleaner is defined not just by the power of its motor but also by the size of the intake port, the part that sucks up dirt. The smaller the size of the intake, the more suction power is produced, as squeezing the same amount of air through a narrower passage means that the air must move faster. The reason is that vacuum cleaner attachments with narrow, small entry ports seem to have a much higher suction than a bigger one. There are numerous distinct types of vacuum cleaners, but all of them work on the same principle of creating negative pressure using a fan, trapping the sucked-up dirt, cleaning the exhaust air, and then releasing it.
The outbreak of the COVID-19 pandemic has led to a rise in demand for vacuum cleaners. With the heightened use of these appliances within healthcare facilities and homes alike, there is a greater need for efficient dust and odor removal solutions through increased production levels. Despite the temporary halt of other manufacturing industries, vacuum cleaner production continued unabated. Consequently, these factors have positively impacted the target product's production side. During the COVID-19 era, vacuum cleaners have experienced exponential growth in usage within both residential and commercial sectors. Additionally, there has been an increased emphasis on health and hygiene standards among hospitals and households alike. However, manufacturing and supply chains were disrupted due to pandemic-related lockdown measures.
Get an overview of this study by requesting a free sample
In March 2022, Creative Newtech Ltd., an India-based company working in the designing and developing of cleaning equipment, established Dustor, a next-gen robotic vacuum cleaner with light detection and ranging (LIDAR) technology. The Dustor is a next-generation robotic vacuum cleaner that is competent in tracing the smallest particles of dust where human eyes cannot see them, cleaning surroundings with the intervention of humans, and crossing obstacles while cleaning.
A vacuum cleaner is a low-cost device- Since a vacuum cleaner is a low-cost device, the person will always get advancement towards any term. Thus, one can always get the benefit of saving time and energy by spending less. The average cost of a vacuum cleaner depends on the size and the type of the cleaner. A person can get good vacuum cleaners in the range of rupees 5,000 to 10,000 in India. Euro Clean, Eureka Forbes, Karcher, Bissell, and Black & Decker are well-known and trending vacuum cleaner manufacturers in India.
Heavy to lift- Vacuum cleaners are hefty, bulky machine that is usually hard to move around the home. Regardless, in the case of an upright vacuum cleaner, it is almost impossible to move up and down stairs. The vacuum cleaner was manufactured in a fairly large size, although not heavy. Moving and keeping the device will need a big place.
Recognize Dirt Amount and Set Parameters- By using a robotic cleaner, the person will have the advantage of automating the available options. Furthermore, the vacuum cleaner will sense the amount of dirt and adjust its job. As a result, individuals do not require to manually run the machine to clean their homes which brings a tremendous opportunity for market growth.
The regions analyzed for the market include North America, Europe, South America, Asia Pacific, the Middle East, and Africa. Asia Pacific emerged as the largest market for the global vacuum cleaner market, with a 36% share of the market revenue in 2023.
Asia Pacific region dominated the global vacuum cleaner market in 2023, with the biggest market in the region being China. The powerful presence of regional companies, the advanced purchasing power of customers, and the availability of inexpensive products are some essential elements pushing the need for vacuum cleaners in the Asia Pacific region. The increasing high spirits of rural areas and the overall usability of online sales channels in growing countries like India support the need for vacuum cleaners.
Asia Pacific Region Vacuum Cleaner Market Share in 2023 - 36%
www.thebrainyinsights.com
Check the geographical analysis of this market by requesting a free sample
The product segment is divided into drum, robotic, wet & dry, canister, upright, central, and others. The canister segment dominated the market, with a market share of around 19% in 2023. Canister vacuum cleaners deliver better suction and flow rate. The canister vacuums cleaner segment dominated the vacuum cleaner market and is assessed to grow at a more rapid pace. Canister vacuum cleaners are the most expensive among others. The robotic vacuum cleaners’ market is anticipated to grow relatively, with products designed by top companies that use sophisticated features and smart programming.
The application segment is divided into residential, commercial, and industrial. The residential segment dominated the market, with a market share of around 37% in 2023. Implementing the work-from-home model around the globe has restricted people to their homes, necessitating the convenient management of daily routine tasks and raising the need for home appliances, particularly cleaning equipment.
The distribution channel segment is divided into online channel, and offline channel. The online channel segment dominated the market, with a market share of around 56% in 2023. The increasing online purchasing trend after covid also contributes to market growth. The online channel helps manufacturers to decrease the rental prices of offline stores and the workforce. Due to the expansion of online sales, the unit cost of vacuum cleaners is expected to decline, further increasing the sales of the machines.
| Attribute | Description |
|---|---|
| Market Size | Revenue (USD Billion) |
| Market size value in 2023 | USD 13.58 Billion |
| Market size value in 2033 | USD 32.74 Billion |
| CAGR (2024 to 2033) | 9.2% |
| Historical data | 2020-2022 |
| Base Year | 2023 |
| Forecast | 2024-2033 |
| Region | The regions analyzed for the market are Asia Pacific, Europe, South America, North America, and Middle East & Africa. Furthermore, the regions are further analyzed at the country level. |
| Segments | Product, Application, Distribution Channel |
As per The Brainy Insights, the size of the vacuum cleaner market was valued at USD 13.58 billion in 2023 to USD 32.74 billion by 2033.
Global vacuum cleaner market is growing at a CAGR of 9.2% during the forecast period 2024-2033.
Asia Pacific region emerged as the largest market for the vacuum cleaner market.
A vacuum cleaner is a low-cost device which propels market growth.
1. Introduction
1.1. Objectives of the Study
1.2. Market Definition
1.3. Research Scope
1.4. Currency
1.5. Key Target Audience
2. Research Methodology and Assumptions
3. Executive Summary
4. Premium Insights
4.1. Porter’s Five Forces Analysis
4.2. Value Chain Analysis
4.3. Top Investment Pockets
4.3.1. Market Attractiveness Analysis by Product
4.3.2. Market Attractiveness Analysis by Application
4.3.3. Market Attractiveness Analysis by Distribution Channel
4.3.4. Market Attractiveness Analysis by Region
4.4. Industry Trends
5. Market Dynamics
5.1. Market Evaluation
5.2. Drivers
5.2.1. Increasing demand for Vacuum Cleaners
5.3. Restraints
5.3.1. High Costs Associated
5.4. Opportunities
5.4.1. Technological Advancements
6. Global Vacuum Cleaner Market Analysis and Forecast, By Product:
6.1. Segment Overview
6.2. Drum
6.3. Robotic
6.4. Wet & Dry
6.5. Canister
6.6. Upright
6.7. Central
6.8. Others
7. Global Vacuum Cleaner Market Analysis and Forecast, By Application
7.1. Segment Overview
7.2. Residential
7.3. Commercial
7.4. Industrial
8. Global Vacuum Cleaner Market Analysis and Forecast, By Distribution Channel
8.1. Segment Overview
8.2. Online Channel
8.3. Offline Channel
9. Global Vacuum Cleaner Market Analysis and Forecast, By Regional Analysis
9.1. Segment Overview
9.2. North America
9.2.1. U.S.
9.2.2. Canada
9.2.3. Mexico
9.3. Europe
9.3.1. Germany
9.3.2. France
9.3.3. U.K.
9.3.4. Italy
9.3.5. Spain
9.4. Asia-Pacific
9.4.1. Japan
9.4.2. China
9.4.3. India
9.5. South America
9.5.1. Brazil
9.6. Middle East and Africa
9.6.1. UAE
9.6.2. South Africa
10. Global Vacuum Cleaner Market-Competitive Landscape
10.1. Overview
10.2. Market Share of Key Players in the Vacuum Cleaner Market
10.2.1. Global Company Market Share
10.2.2. North America Company Market Share
10.2.3. Europe Company Market Share
10.2.4. APAC Company Market Share
10.3. Competitive Situations and Trends
10.3.1. Product Launches and Developments
10.3.2. Partnerships, Collaborations, and Agreements
10.3.3. Mergers & Acquisitions
10.3.4. Expansions
11. Company Profiles
11.1. Snow Joe LLC
11.1.1. Business Overview
11.1.2. Company Snapshot
11.1.3. Company Market Share Analysis
11.1.4. Company Product Portfolio
11.1.5. Recent Developments
11.1.6. SWOT Analysis
11.2. Panasonic Holdings Corporation.
11.2.1. Business Overview
11.2.2. Company Snapshot
11.2.3. Company Market Share Analysis
11.2.4. Company Product Portfolio
11.2.5. Recent Developments
11.2.6. SWOT Analysis
11.3. Nilfisk Group
11.3.1. Business Overview
11.3.2. Company Snapshot
11.3.3. Company Market Share Analysis
11.3.4. Company Product Portfolio
11.3.5. Recent Developments
11.3.6. SWOT Analysis
11.4. Neato Robotics, Inc.
11.4.1. Business Overview
11.4.2. Company Snapshot
11.4.3. Company Market Share Analysis
11.4.4. Company Product Portfolio
11.4.5. Recent Developments
11.4.6. SWOT Analysis
11.5. iRobot Corporation
11.5.1. Business Overview
11.5.2. Company Snapshot
11.5.3. Company Market Share Analysis
11.5.4. Company Product Portfolio
11.5.5. Recent Developments
11.5.6. SWOT Analysis
11.6. Haier Group
11.6.1. Business Overview
11.6.2. Company Snapshot
11.6.3. Company Market Share Analysis
11.6.4. Company Product Portfolio
11.6.5. Recent Developments
11.6.6. SWOT Analysis
11.7. Emerson Electric Co.
11.7.1. Business Overview
11.7.2. Company Snapshot
11.7.3. Company Market Share Analysis
11.7.4. Company Product Portfolio
11.7.5. Recent Developments
11.7.6. SWOT Analysis
11.8. ECOVACS
11.8.1. Business Overview
11.8.2. Company Snapshot
11.8.3. Company Market Share Analysis
11.8.4. Company Product Portfolio
11.8.5. Recent Developments
11.8.6. SWOT Analysis
11.9. Dyson
11.9.1. Business Overview
11.9.2. Company Snapshot
11.9.3. Company Market Share Analysis
11.9.4. Company Product Portfolio
11.9.5. Recent Developments
11.9.6. SWOT Analysis
11.10. DEWALT
11.10.1. Business Overview
11.10.2. Company Snapshot
11.10.3. Company Market Share Analysis
11.10.4. Company Product Portfolio
11.10.5. Recent Developments
11.10.6. SWOT Analysis
11.11. CRAFTSMAN
11.11.1. Business Overview
11.11.2. Company Snapshot
11.11.3. Company Market Share Analysis
11.11.4. Company Product Portfolio
11.11.5. Recent Developments
11.11.6. SWOT Analysis
11.12. BISSELL Inc.,
11.12.1. Business Overview
11.12.2. Company Snapshot
11.12.3. Company Market Share Analysis
11.12.4. Company Product Portfolio
11.12.5. Recent Developments
11.12.6. SWOT Analysis
11.13. Alfred Karcher SE & Co. KG
11.13.1. Business Overview
11.13.2. Company Snapshot
11.13.3. Company Market Share Analysis
11.13.4. Company Product Portfolio
11.13.5. Recent Developments
11.13.6. SWOT Analysis
List of Table
1. Global Vacuum Cleaner Market, By Product, 2020-2033 (USD Billion)
2. Global Drum Vacuum Cleaner Market, By Region, 2020-2033 (USD Billion)
3. Global Robotic Vacuum Cleaner Market, By Region, 2020-2033 (USD Billion)
4. Global Wet & Dry Vacuum Cleaner Market, By Region, 2020-2033 (USD Billion)
5. Global Canister Vacuum Cleaner Market, By Region, 2020-2033 (USD Billion)
6. Global Upright Vacuum Cleaner Market, By Region, 2020-2033 (USD Billion)
7. Global Central Vacuum Cleaner Market, By Region, 2020-2033 (USD Billion)
8. Global Others Vacuum Cleaner Market, By Region, 2020-2033 (USD Billion)
9. Global Vacuum Cleaner Market, By Application, 2020-2033 (USD Billion)
10. Global Residential Vacuum Cleaner Market, By Region, 2020-2033 (USD Billion)
11. Global Commercial Vacuum Cleaner Market, By Region, 2020-2033 (USD Billion)
12. Global Industrial Vacuum Cleaner Market, By Region, 2020-2033 (USD Billion)
13. Global Vacuum Cleaner Market, By Distribution Channel, 2020-2033 (USD Billion)
14. Global Online Channel Vacuum Cleaner Market, By Region, 2020-2033 (USD Billion)
15. Global Offline Channel Vacuum Cleaner Market, By Region, 2020-2033 (USD Billion)
16. North America Vacuum Cleaner Market, By Product, 2020-2033 (USD Billion)
17. North America Vacuum Cleaner Market, By Application, 2020-2033 (USD Billion)
18. North America Vacuum Cleaner Market, By Distribution Channel, 2020-2033 (USD Billion)
19. U.S. Vacuum Cleaner Market, By Product, 2020-2033 (USD Billion)
20. U.S. Vacuum Cleaner Market, By Application, 2020-2033 (USD Billion)
21. U.S. Vacuum Cleaner Market, By Distribution Channel, 2020-2033 (USD Billion)
22. Canada Vacuum Cleaner Market, By Product, 2020-2033 (USD Billion)
23. Canada Vacuum Cleaner Market, By Application, 2020-2033 (USD Billion)
24. Canada Vacuum Cleaner Market, By Distribution Channel, 2020-2033 (USD Billion)
25. Mexico Vacuum Cleaner Market, By Product, 2020-2033 (USD Billion)
26. Mexico Vacuum Cleaner Market, By Application, 2020-2033 (USD Billion)
27. Mexico Vacuum Cleaner Market, By Distribution Channel, 2020-2033 (USD Billion)
28. Europe Vacuum Cleaner Market, By Product, 2020-2033 (USD Billion)
29. Europe Vacuum Cleaner Market, By Application, 2020-2033 (USD Billion)
30. Europe Vacuum Cleaner Market, By Distribution Channel, 2020-2033 (USD Billion)
31. Germany Vacuum Cleaner Market, By Product, 2020-2033 (USD Billion)
32. Germany Vacuum Cleaner Market, By Application, 2020-2033 (USD Billion)
33. Germany Vacuum Cleaner Market, By Distribution Channel, 2020-2033 (USD Billion)
34. France Vacuum Cleaner Market, By Product 2020-2033 (USD Billion)
35. France Vacuum Cleaner Market, By Application, 2020-2033 (USD Billion)
36. France Vacuum Cleaner Market, By Distribution Channel, 2020-2033 (USD Billion)
37. U.K. Vacuum Cleaner Market, By Product, 2020-2033 (USD Billion)
38. U.K. Vacuum Cleaner Market, By Application, 2020-2033 (USD Billion)
39. U.K. Vacuum Cleaner Market, By Distribution Channel, 2020-2033 (USD Billion)
40. Italy Vacuum Cleaner Market, By Product, 2020-2033 (USD Billion)
41. Italy Vacuum Cleaner Market, By Application, 2020-2033 (USD Billion)
42. Italy Vacuum Cleaner Market, By Distribution Channel, 2020-2033 (USD Billion)
43. Spain Vacuum Cleaner Market, By Product, 2020-2033 (USD Billion)
44. Spain Vacuum Cleaner Market, By Application, 2020-2033 (USD Billion)
45. Spain Vacuum Cleaner Market, By Distribution Channel, 2020-2033 (USD Billion)
46. Asia Pacific Vacuum Cleaner Market, By Product, 2020-2033 (USD Billion)
47. Asia Pacific Vacuum Cleaner Market, By Application, 2020-2033 (USD Billion)
48. Asia Pacific Vacuum Cleaner Market, By Distribution Channel, 2020-2033 (USD Billion)
49. Japan Vacuum Cleaner Market, By Product, 2020-2033 (USD Billion)
50. Japan Vacuum Cleaner Market, By Application, 2020-2033 (USD Billion)
51. Japan Vacuum Cleaner Market, By Distribution Channel, 2020-2033 (USD Billion)
52. China Vacuum Cleaner Market, By Product 2020-2033 (USD Billion)
53. China Vacuum Cleaner Market, By Application, 2020-2033 (USD Billion)
54. China Vacuum Cleaner Market, By Distribution Channel, 2020-2033 (USD Billion)
55. India Vacuum Cleaner Market, By Product 2020-2033 (USD Billion)
56. India Vacuum Cleaner Market, By Application, 2020-2033 (USD Billion)
57. India Vacuum Cleaner Market, By Distribution Channel, 2020-2033 (USD Billion)
58. South America Vacuum Cleaner Market, By Product, 2020-2033 (USD Billion)
59. South America Vacuum Cleaner Market, By Application, 2020-2033 (USD Billion)
60. South America Vacuum Cleaner Market, By Distribution Channel, 2020-2033 (USD Billion)
61. Brazil Vacuum Cleaner Market, By Product 2020-2033 (USD Billion)
62. Brazil Vacuum Cleaner Market, By Application, 2020-2033 (USD Billion)
63. Brazil Vacuum Cleaner Market, By Distribution Channel, 2020-2033 (USD Billion)
64. Middle East and Africa Vacuum Cleaner Market, By Product, 2020-2033 (USD Billion)
65. Middle East and Africa Vacuum Cleaner Market, By Application, 2020-2033 (USD Billion)
66. Middle East and Africa Vacuum Cleaner Market, By Distribution Channel, 2020-2033 (USD Billion)
67. UAE Vacuum Cleaner Market, By Product, 2020-2033 (USD Billion)
68. UAE Vacuum Cleaner Market, By Application, 2020-2033 (USD Billion)
69. UAE Vacuum Cleaner Market, By Distribution Channel, 2020-2033 (USD Billion)
70. South Africa Vacuum Cleaner Market, By Product 2020-2033 (USD Billion)
71. South Africa Vacuum Cleaner Market, By Application, 2020-2033 (USD Billion)
72. South Africa Vacuum Cleaner Market, By Distribution Channel, 2020-2033 (USD Billion)
List of Figures
1. Global Vacuum Cleaner Market Segmentation
2. Vacuum Cleaner Market: Research Methodology
3. Market Size Estimation Methodology: Bottom-Up Approach
4. Market Size Estimation Methodology: Top-Down Approach
5. Data Triangulation
6. Porter’s Five Forces Analysis
7. Value Chain Analysis
8. Global Vacuum Cleaner Market Attractiveness Analysis by Product
9. Global Vacuum Cleaner Market Attractiveness Analysis by Application
10. Global Vacuum Cleaner Market Attractiveness Analysis by Distribution Channel
11. Global Vacuum Cleaner Market Attractiveness Analysis by Region
12. Global Vacuum Cleaner Market: Dynamics
13. Global Vacuum Cleaner Market Share by Product (2023 & 2033)
14. Global Vacuum Cleaner Market Share by Application (2023 & 2033)
15. Global Vacuum Cleaner Market Share by Distribution Channel (2023 & 2033)
16. Global Vacuum Cleaner Market Share by Regions (2023 & 2033)
Global Vacuum Cleaner Market Share by Company (2023)
This study forecasts revenue at global, regional, and country levels from 2020 to 2033. The Brainy Insights has segmented the global vacuum cleaner market based on below mentioned segments:
Global Vacuum Cleaner Market Product:
Global Vacuum Cleaner Market Application:
Global Vacuum Cleaner Market Distribution Channel:
Global Vacuum Cleaner Market by Region:
Research has its special purpose to undertake marketing efficiently. In this competitive scenario, businesses need information across all industry verticals; the information about customer wants, market demand, competition, industry trends, distribution channels etc. This information needs to be updated regularly because businesses operate in a dynamic environment. Our organization, The Brainy Insights incorporates scientific and systematic research procedures in order to get proper market insights and industry analysis for overall business success. The analysis consists of studying the market from a miniscule level wherein we implement statistical tools which helps us in examining the data with accuracy and precision.
Our research reports feature both; quantitative and qualitative aspects for any market. Qualitative information for any market research process are fundamental because they reveal the customer needs and wants, usage and consumption for any product/service related to a specific industry. This in turn aids the marketers/investors in knowing certain perceptions of the customers. Qualitative research can enlighten about the different product concepts and designs along with unique service offering that in turn, helps define marketing problems and generate opportunities. On the other hand, quantitative research engages with the data collection process through interviews, e-mail interactions, surveys and pilot studies. Quantitative aspects for the market research are useful to validate the hypotheses generated during qualitative research method, explore empirical patterns in the data with the help of statistical tools, and finally make the market estimations.
The Brainy Insights offers comprehensive research and analysis, based on a wide assortment of factual insights gained through interviews with CXOs and global experts and secondary data from reliable sources. Our analysts and industry specialist assume vital roles in building up statistical tools and analysis models, which are used to analyse the data and arrive at accurate insights with exceedingly informative research discoveries. The data provided by our organization have proven precious to a diverse range of companies, facilitating them to address issues such as determining which products/services are the most appealing, whether or not customers use the product in the manner anticipated, the purchasing intentions of the market and many others.
Our research methodology encompasses an idyllic combination of primary and secondary initiatives. Key phases involved in this process are listed below:

The phase involves the gathering and collecting of market data and its related information with the help of different sources & research procedures.

The data procurement stage involves in data gathering and collecting through various data sources.
This stage involves in extensive research. These data sources includes:
Purchased Database: Purchased databases play a crucial role in estimating the market sizes irrespective of the domain. Our purchased database includes:
Primary Research: The Brainy Insights interacts with leading companies and experts of the concerned domain to develop the analyst team’s market understanding and expertise. It improves and substantiates every single data presented in the market reports. Primary research mainly involves in telephonic interviews, E-mail interactions and face-to-face interviews with the raw material providers, manufacturers/producers, distributors, & independent consultants. The interviews that we conduct provides valuable data on market size and industry growth trends prevailing in the market. Our organization also conducts surveys with the various industry experts in order to gain overall insights of the industry/market. For instance, in healthcare industry we conduct surveys with the pharmacists, doctors, surgeons and nurses in order to gain insights and key information of a medical product/device/equipment which the customers are going to usage. Surveys are conducted in the form of questionnaire designed by our own analyst team. Surveys plays an important role in primary research because surveys helps us to identify the key target audiences of the market. Additionally, surveys helps to identify the key target audience engaged with the market. Our survey team conducts the survey by targeting the key audience, thus gaining insights from them. Based on the perspectives of the customers, this information is utilized to formulate market strategies. Moreover, market surveys helps us to understand the current competitive situation of the industry. To be precise, our survey process typically involve with the 360 analysis of the market. This analytical process begins by identifying the prospective customers for a product or service related to the market/industry to obtain data on how a product/service could fit into customers’ lives.

Secondary Research: The secondary data sources includes information published by the on-profit organizations such as World bank, WHO, company fillings, investor presentations, annual reports, national government documents, statistical databases, blogs, articles, white papers and others. From the annual report, we analyse a company’s revenue to understand the key segment and market share of that organization in a particular region. We analyse the company websites and adopt the product mapping technique which is important for deriving the segment revenue. In the product mapping method, we select and categorize the products offered by the companies catering to domain specific market, deduce the product revenue for each of the companies so as to get overall estimation of the market size. We also source data and analyses trends based on information received from supply side and demand side intermediaries in the value chain. The supply side denotes the data gathered from supplier, distributor, wholesaler and the demand side illustrates the data gathered from the end customers for respective market domain.

The supply side for a domain specific market is analysed by:
The demand side for the market is estimated through:
In-house Library: Apart from these third-party sources, we have our in-house library of qualitative and quantitative information. Our in-house database includes market data for various industry and domains. These data are updated on regular basis as per the changing market scenario. Our library includes, historic databases, internal audit reports and archives.
Sometimes there are instances where there is no metadata or raw data available for any domain specific market. For those cases, we use our expertise to forecast and estimate the market size in order to generate comprehensive data sets. Our analyst team adopt a robust research technique in order to produce the estimates:
Data Synthesis: This stage involves the analysis & mapping of all the information obtained from the previous step. It also involves in scrutinizing the data for any discrepancy observed while data gathering related to the market. The data is collected with consideration to the heterogeneity of sources. Robust scientific techniques are in place for synthesizing disparate data sets and provide the essential contextual information that can orient market strategies. The Brainy Insights has extensive experience in data synthesis where the data passes through various stages:


Market Deduction & Formulation: The final stage comprises of assigning data points at appropriate market spaces so as to deduce feasible conclusions. Analyst perspective & subject matter expert based holistic form of market sizing coupled with industry analysis also plays a crucial role in this stage.
This stage involves in finalization of the market size and numbers that we have collected from data integration step. With data interpolation, it is made sure that there is no gap in the market data. Successful trend analysis is done by our analysts using extrapolation techniques, which provide the best possible forecasts for the market.
Data Validation & Market Feedback: Validation is the most important step in the process. Validation & re-validation via an intricately designed process helps us finalize data-points to be used for final calculations.

The Brainy Insights interacts with leading companies and experts of the concerned domain to develop the analyst team’s market understanding and expertise. It improves and substantiates every single data presented in the market reports. The data validation interview and discussion panels are typically composed of the most experienced industry members. The participants include, however, are not limited to:
Moreover, we always validate our data and findings through primary respondents from all the major regions we are working on.


Free Customization
Fortune 500 Clients
Free Yearly Update On Purchase Of Multi/Corporate License
Companies Served Till Date