- +1-315-215-1633
- sales@thebrainyinsights.com

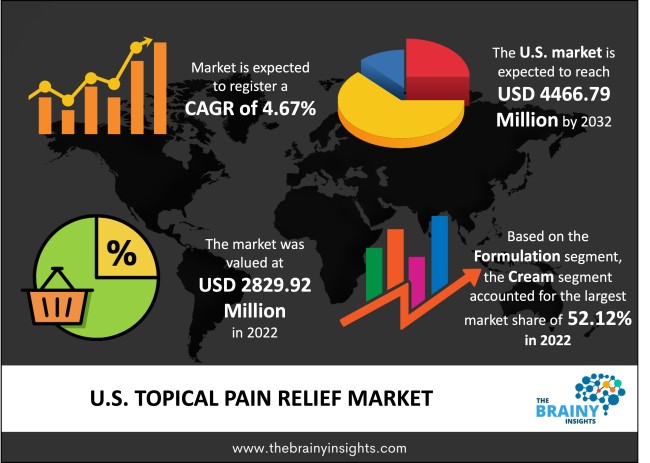
The US Topical Pain Relief market was valued at USD 2,829.92 million in 2022 and growing at a CAGR of 4.67% from 2023 to 2032. The market is expected to reach USD 4,466.79 million by 2032. Topical pain relief is a medicated product applied to the skin to get rid of or reduce the pain. These are pain relief products. They are available in the form of lotions, creams, gels and sprays, among others. The surge in the prevalence of joint pains and arthritis is one reason for the growth of the topical pain relief market in the US. There are also growing geriatric cases, which require more pain relief products. Also, topical pain relief causes fewer side effects than oral pain relief, and there is more demand for topical pain relief in sports. Also, there is more availability of such pain-relieving drugs. Thus the demand for such a market is growing.
Topical pain relievers offer some crucial advantages over oral pain medications like they offer targeted relief as they are applied directly to the hurt spot. The oral medication goes throughout the body; hence, only a little medication reaches the target. Topical pain relief medications are used directly on the epidermal layer of the skin in the area of hurt or pain. These products are designed to relieve the pain and use the skin as the tool for drug administration and take action at the desired spot and in the central nervous system. Also, these offer lesser side effects in comparison to oral medications. Generally, topical pain medication offers a heat or cooling effect to the area that helps decrease the pain sensation. Some of the key advantages of using topical pain relievers are that they have fewer adverse effects and zero drug tolerance, which means topical pain relief escapes the drug tolerance effects as they use a targeted, specialized approach that avoids the circulatory system. Also, topical pain relief creams are easily available over the counter and give quick relief without a prescription. In the US, this market is primarily driven due to surge in the prevalence of arthritis and several bone-related conditions. Diabetic neuropathy also leads to pain. Moreover, there is a growing adoption of topical pain relief products because of their lesser side effects, and the senior population is also growing in the US. These products are also getting in demand by sports players. Also, there is a surge in the development of online platforms for topical therapeutics. All these factors eventually drive the topical pain relief market in the US. There is an increase in the number of people having joint pain-related problems. These topical pain reliefs offer instant comfort to such people with injuries, and thus this market seems to grow further with time.
Get an overview of this study by requesting a free sample
Growing arthritis cases in the US – It has been observed that arthritis has become the primary cause of disability in the US. Based on one of the studies, around 59 million US adults were diagnosed with arthritis, which makes up around 1 in 4 US adults. It is making an increase of over 4 million since 2013-2015. Arthritis is affecting people’s overall functionality and mobility and thus restricting their activities. Another study suggests that the total number of US adults with limitations in activity due to arthritis has increased significantly from 23.7 million between 2013 to 2015 to 25.7 million from 2016 to 2018. All these factors eventually drive the topical pain relief market in the US.
The growing geriatric population in the US – Based on one of the studies, the US population aged 65 and over was around 54.1 million in 2019, which was around 16% of the total US population that comprised more than one in seven Americans. It has been observed that the older US population has increased by 36% since 2009, which makes 14.4 million when compared to an increase of 3% of the under-65 population. By 2040, it was estimated that the older people population in the US would be around 80.8 million, which would be more than twice the older population in 2000. Moreover, the population of older people aged 85 and older was estimated to more than double from around 6.6 million in 2019 to around 14.4 million in 2040. These factors are eventually driving the US topical pain relief market.
Unpleasant smell and side effects – The topical pain relief market is growing in the US, but it could cause side effects and can lead to irritated skin. Also, these products have an unpleasant smell or strong odours, which could cause discomfort to users and around them. All these factors are acting as restraints for the market.
Growing e-commerce platform – The advent of e-commerce platforms has played a crucial role in the expansion of the medical industry due to the availability of online pharmacies. Online pharmacies are growing, and it is becoming easy to access medication such as topical pain relief medication that does not often require a prescription. Hence topical pain relief medicines are easy to order online. The recent trend suggests that online pharmacies are growing as there is a surge in the demand for pain relief medicines. Also, many new innovative products are available online. All these factors would eventually drive the US topical pain relief market in the forecasting period.
The therapeutic class segment is divided into non-opioids and opioids. The non-opioids segment dominated the market, with a market share of around 78.45% in 2022. This factor is attributed to the fact that there are many non-opioid pain medications present in the market which could be prescribed or over the counter. Topical pain relief is getting popular in many sports injuries or accidents.
The type segment is divided into prescription pain relief and over-the-counter pain relief. The over-the-counter pain relief segment dominated the market, with a market share of around 61.44% in 2022. There are many options for over-the-counter (OTC) topical pain medication in the market. Secondly, topical pain relief medications are in demand, especially when people have difficulty swallowing the medications. Topical pain relief medications are available in patches, gels, creams or sprays, among others.
The formulation segment is divided into cream, gel and others. The cream segment dominated the market, with a market share of around 52.12% in 2022. This factor is attributed to topical pain relief creams being the easily available over-the-counter medication for pain relief. These are used to cure both acute and chronic pain in adults. These products are in demand as they can be directly applied to the target area, which can help provide instant relief.
The distribution channel segment is divided into online and offline. The offline segment dominated the market, with a market share of around 56.87% in 2022. This factor is due to the broad availability of topical pain relief medications and the easy accessibility of such medicines to patients. Another factor is that these topical pain relief medications are also used in many hospitals to treat hospitalized patients. However, online pharmacies are growing at a significant pace, and this would increase the sales of topical pain relief medicines online with time.
| Attribute | Description |
|---|---|
| Market Size | Revenue (USD Billion) |
| Market size value in 2022 | USD 2,829.92 Million |
| Market size value in 2032 | USD 4,466.79 Million |
| CAGR (2023 to 2032) | 4.67% |
| Historical data | 2019-2021 |
| Base Year | 2022 |
| Forecast | 2023-2032 |
| Segments | Therapeutic class, Type, Formulation, Distribution Channel |
The market's growth will be influenced by growing arthritis cases in the US and surge in the geriatric population.
Unpleasant smell and side effects could hamper the market growth.
Growing e-commerce platform will provide huge opportunities to the market.
Key players are GlaxosmithklinePlc (GSK), Reckitt Benckiser Group Plc., AdvacarePharma, Topical Biomedics, Inc., Johnson & Johnson, Sun Pharmaceutical Industries Ltd., Nestlé S.A., Sanofi, Novartis AG and Pfizer Inc. among others.
1. Introduction
1.1. Objectives of the Study
1.2. Market Definition
1.3. Research Scope
1.4. Currency
1.5. Key Target Audience
2. Research Methodology and Assumptions
3. Executive Summary
4. Premium Insights
4.1. Porter’s Five Forces Analysis
4.2. Value Chain Analysis
4.3. Top Investment Pockets
4.3.1. Market Attractiveness Analysis By Therapeutic Class
4.3.2. Market Attractiveness Analysis By Type
4.3.3. Market Attractiveness Analysis By Formulation
4.3.4. Market Attractiveness Analysis By Distribution Channel
4.3.5. Market Attractiveness Analysis By Country
4.4. Industry Trends
5. Market Dynamics
5.1. Market Evaluation
5.2. Drivers
5.2.1. Growing arthritis cases in the US
5.2.2. The growing geriatric population in the US
5.3. Restraints
5.3.1. Unpleasant smell and side effects
5.4. Opportunities
5.4.1. Growing e-commerce platform
5.5. Challenges
5.5.1. Economic slowdown
6. US Topical Pain Relief Market Analysis and Forecast, By Therapeutic Class
6.1. Segment Overview
6.2. Non-Opioids
6.3. Opioids
7. US Topical Pain Relief Market Analysis and Forecast, By Type
7.1. Segment Overview
7.2. Prescription Pain Relief
7.3. Over the Counter Pain Relief
8. US Topical Pain Relief Market Analysis and Forecast, By Formulation
8.1. Segment Overview
8.2. Cream
8.3. Gel
8.4. Others
9. US Topical Pain Relief Market Analysis and Forecast, By Distribution Channel
9.1. Segment Overview
9.2. Online
9.3. Offline
10. US Topical Pain Relief Market-Competitive Landscape
10.1. Overview
10.2. Market Share of Key Players in US Topical Pain Relief Market
10.2.1. US Company Market Share
10.2.2. North America Company Market Share
10.2.3. Europe Company Market Share
10.2.4. APAC Company Market Share
10.3. Competitive Situations and Trends
10.3.1. Product Launches and Developments
10.3.2. Partnerships, Collaborations, and Agreements
10.3.3. Mergers & Acquisitions
10.3.4. Expansions
11. Company Profiles
11.1. GlaxosmithklinePlc (GSK)
11.1.1. Business Overview
11.1.2. Company Snapshot
11.1.3. Company Market Share Analysis
11.1.4. Company Product Portfolio
11.1.5. Recent Developments
11.1.6. SWOT Analysis
11.2. Reckitt Benckiser Group Plc
11.2.1. Business Overview
11.2.2. Company Snapshot
11.2.3. Company Market Share Analysis
11.2.4. Company Product Portfolio
11.2.5. Recent Developments
11.2.6. SWOT Analysis
11.3. AdvacarePharma
11.3.1. Business Overview
11.3.2. Company Snapshot
11.3.3. Company Market Share Analysis
11.3.4. Company Product Portfolio
11.3.5. Recent Developments
11.3.6. SWOT Analysis
11.4. Topical Biomedics, Inc
11.4.1. Business Overview
11.4.2. Company Snapshot
11.4.3. Company Market Share Analysis
11.4.4. Company Product Portfolio
11.4.5. Recent Developments
11.4.6. SWOT Analysis
11.5. Johnson & Johnson
11.5.1. Business Overview
11.5.2. Company Snapshot
11.5.3. Company Market Share Analysis
11.5.4. Company Product Portfolio
11.5.5. Recent Developments
11.5.6. SWOT Analysis
11.6. Sun Pharmaceutical Industries Ltd.
11.6.1. Business Overview
11.6.2. Company Snapshot
11.6.3. Company Market Share Analysis
11.6.4. Company Product Portfolio
11.6.5. Recent Developments
11.6.6. SWOT Analysis
11.7. Nestlé S.A.
11.7.1. Business Overview
11.7.2. Company Snapshot
11.7.3. Company Market Share Analysis
11.7.4. Company Product Portfolio
11.7.5. Recent Developments
11.7.6. SWOT Analysis
11.8. Sanofi
11.8.1. Business Overview
11.8.2. Company Snapshot
11.8.3. Company Market Share Analysis
11.8.4. Company Product Portfolio
11.8.5. Recent Developments
11.8.6. SWOT Analysis
11.9. Novartis AG
11.9.1. Business Overview
11.9.2. Company Snapshot
11.9.3. Company Market Share Analysis
11.9.4. Company Product Portfolio
11.9.5. Recent Developments
11.9.6. SWOT Analysis
11.10. Pfizer Inc.
11.10.1. Business Overview
11.10.2. Company Snapshot
11.10.3. Company Market Share Analysis
11.10.4. Company Product Portfolio
11.10.5. Recent Developments
11.10.6. SWOT Analysis
List of Table
1. US Topical Pain Relief Market, By Therapeutic Class, 2019-2032 (USD Million)
2. US Non-Opioids, Topical Pain Relief Market, By Country, 2019-2032 (USD Million)
3. US Opioids, Topical Pain Relief Market, By Country, 2019-2032 (USD Million)
4. US Topical Pain Relief Market, By Type, 2019-2032 (USD Million)
5. US Prescription Pain Relief, Topical Pain Relief Market, By Country, 2019-2032 (USD Million)
6. US Over the Counter Pain Relief, Topical Pain Relief Market, By Country, 2019-2032 (USD Million)
7. US Topical Pain Relief Market, By Formulation, 2019-2032 (USD Million)
8. US Cream, Topical Pain Relief Market, By Country, 2019-2032 (USD Million)
9. US Gel, Topical Pain Relief Market, By Country, 2019-2032 (USD Million)
10. US Others, Topical Pain Relief Market, By Country, 2019-2032 (USD Million)
11. US Topical Pain Relief Market, By Distribution Channel, 2019-2032 (USD Million)
12. US Online, Topical Pain Relief Market, By Country, 2019-2032 (USD Million)
13. US Offline, Topical Pain Relief Market, By Country, 2019-2032 (USD Million)
List of Figures
1. US Topical Pain Relief Market Segmentation
2. US Topical Pain Relief Market: Research Methodology
3. Market Size Estimation Methodology: Bottom-Up Approach
4. Market Size Estimation Methodology: Top-Down Approach
5. Data Triangulation
6. Porter’s Five Forces Analysis
7. Value Chain Analysis
8. US Topical Pain Relief Market Attractiveness Analysis By Therapeutic Class
9. US Topical Pain Relief Market Attractiveness Analysis By Type
10. US Topical Pain Relief Market Attractiveness Analysis By Formulation
11. US Topical Pain Relief Market Attractiveness Analysis By Distribution Channel
12. US Topical Pain Relief Market Attractiveness Analysis By Country
13. US Topical Pain Relief Market: Dynamics
14. US Topical Pain Relief Market Share By Therapeutic Class (2023 & 2032)
15. US Topical Pain Relief Market Share By Type (2023 & 2032)
16. US Topical Pain Relief Market Share By Formulation (2023 & 2032)
17. US Topical Pain Relief Market Share By Distribution Channel (2023 & 2032)
18. US Topical Pain Relief Market Share By Country (2023 & 2032)
19. US Topical Pain Relief Market Share By Company (2022)
This study forecasts revenue at country level from 2019 to 2032. The Brainy Insights has segmented the US topical pain relief market based on below mentioned segments:
US Topical Pain Relief Market by Therapeutic Class:
US Topical Pain Relief Market by Type:
US Topical Pain Relief Market by Formulation:
US Topical Pain Relief Market by Distribution Channel:
Research has its special purpose to undertake marketing efficiently. In this competitive scenario, businesses need information across all industry verticals; the information about customer wants, market demand, competition, industry trends, distribution channels etc. This information needs to be updated regularly because businesses operate in a dynamic environment. Our organization, The Brainy Insights incorporates scientific and systematic research procedures in order to get proper market insights and industry analysis for overall business success. The analysis consists of studying the market from a miniscule level wherein we implement statistical tools which helps us in examining the data with accuracy and precision.
Our research reports feature both; quantitative and qualitative aspects for any market. Qualitative information for any market research process are fundamental because they reveal the customer needs and wants, usage and consumption for any product/service related to a specific industry. This in turn aids the marketers/investors in knowing certain perceptions of the customers. Qualitative research can enlighten about the different product concepts and designs along with unique service offering that in turn, helps define marketing problems and generate opportunities. On the other hand, quantitative research engages with the data collection process through interviews, e-mail interactions, surveys and pilot studies. Quantitative aspects for the market research are useful to validate the hypotheses generated during qualitative research method, explore empirical patterns in the data with the help of statistical tools, and finally make the market estimations.
The Brainy Insights offers comprehensive research and analysis, based on a wide assortment of factual insights gained through interviews with CXOs and global experts and secondary data from reliable sources. Our analysts and industry specialist assume vital roles in building up statistical tools and analysis models, which are used to analyse the data and arrive at accurate insights with exceedingly informative research discoveries. The data provided by our organization have proven precious to a diverse range of companies, facilitating them to address issues such as determining which products/services are the most appealing, whether or not customers use the product in the manner anticipated, the purchasing intentions of the market and many others.
Our research methodology encompasses an idyllic combination of primary and secondary initiatives. Key phases involved in this process are listed below:

The phase involves the gathering and collecting of market data and its related information with the help of different sources & research procedures.

The data procurement stage involves in data gathering and collecting through various data sources.
This stage involves in extensive research. These data sources includes:
Purchased Database: Purchased databases play a crucial role in estimating the market sizes irrespective of the domain. Our purchased database includes:
Primary Research: The Brainy Insights interacts with leading companies and experts of the concerned domain to develop the analyst team’s market understanding and expertise. It improves and substantiates every single data presented in the market reports. Primary research mainly involves in telephonic interviews, E-mail interactions and face-to-face interviews with the raw material providers, manufacturers/producers, distributors, & independent consultants. The interviews that we conduct provides valuable data on market size and industry growth trends prevailing in the market. Our organization also conducts surveys with the various industry experts in order to gain overall insights of the industry/market. For instance, in healthcare industry we conduct surveys with the pharmacists, doctors, surgeons and nurses in order to gain insights and key information of a medical product/device/equipment which the customers are going to usage. Surveys are conducted in the form of questionnaire designed by our own analyst team. Surveys plays an important role in primary research because surveys helps us to identify the key target audiences of the market. Additionally, surveys helps to identify the key target audience engaged with the market. Our survey team conducts the survey by targeting the key audience, thus gaining insights from them. Based on the perspectives of the customers, this information is utilized to formulate market strategies. Moreover, market surveys helps us to understand the current competitive situation of the industry. To be precise, our survey process typically involve with the 360 analysis of the market. This analytical process begins by identifying the prospective customers for a product or service related to the market/industry to obtain data on how a product/service could fit into customers’ lives.

Secondary Research: The secondary data sources includes information published by the on-profit organizations such as World bank, WHO, company fillings, investor presentations, annual reports, national government documents, statistical databases, blogs, articles, white papers and others. From the annual report, we analyse a company’s revenue to understand the key segment and market share of that organization in a particular region. We analyse the company websites and adopt the product mapping technique which is important for deriving the segment revenue. In the product mapping method, we select and categorize the products offered by the companies catering to domain specific market, deduce the product revenue for each of the companies so as to get overall estimation of the market size. We also source data and analyses trends based on information received from supply side and demand side intermediaries in the value chain. The supply side denotes the data gathered from supplier, distributor, wholesaler and the demand side illustrates the data gathered from the end customers for respective market domain.

The supply side for a domain specific market is analysed by:
The demand side for the market is estimated through:
In-house Library: Apart from these third-party sources, we have our in-house library of qualitative and quantitative information. Our in-house database includes market data for various industry and domains. These data are updated on regular basis as per the changing market scenario. Our library includes, historic databases, internal audit reports and archives.
Sometimes there are instances where there is no metadata or raw data available for any domain specific market. For those cases, we use our expertise to forecast and estimate the market size in order to generate comprehensive data sets. Our analyst team adopt a robust research technique in order to produce the estimates:
Data Synthesis: This stage involves the analysis & mapping of all the information obtained from the previous step. It also involves in scrutinizing the data for any discrepancy observed while data gathering related to the market. The data is collected with consideration to the heterogeneity of sources. Robust scientific techniques are in place for synthesizing disparate data sets and provide the essential contextual information that can orient market strategies. The Brainy Insights has extensive experience in data synthesis where the data passes through various stages:


Market Deduction & Formulation: The final stage comprises of assigning data points at appropriate market spaces so as to deduce feasible conclusions. Analyst perspective & subject matter expert based holistic form of market sizing coupled with industry analysis also plays a crucial role in this stage.
This stage involves in finalization of the market size and numbers that we have collected from data integration step. With data interpolation, it is made sure that there is no gap in the market data. Successful trend analysis is done by our analysts using extrapolation techniques, which provide the best possible forecasts for the market.
Data Validation & Market Feedback: Validation is the most important step in the process. Validation & re-validation via an intricately designed process helps us finalize data-points to be used for final calculations.

The Brainy Insights interacts with leading companies and experts of the concerned domain to develop the analyst team’s market understanding and expertise. It improves and substantiates every single data presented in the market reports. The data validation interview and discussion panels are typically composed of the most experienced industry members. The participants include, however, are not limited to:
Moreover, we always validate our data and findings through primary respondents from all the major regions we are working on.


Free Customization
Fortune 500 Clients
Free Yearly Update On Purchase Of Multi/Corporate License
Companies Served Till Date