- +1-315-215-1633
- sales@thebrainyinsights.com

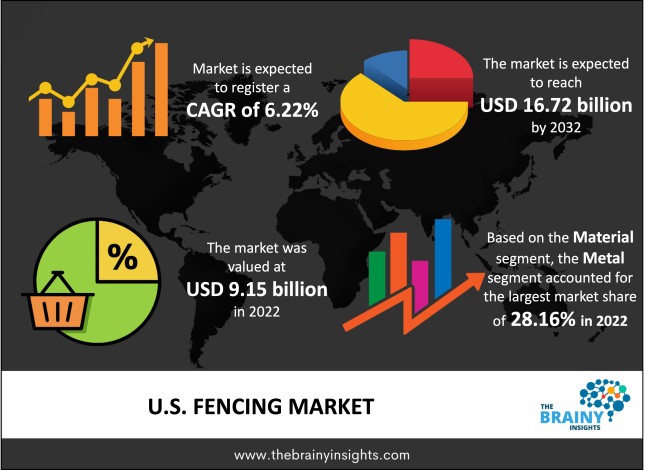
The U.S. fencing market was valued at USD 9.15 billion in 2022 and grew at a CAGR of 6.22% from 2023 to 2032. The market is expected to reach USD 16.72 billion by 2032. The substantial growth can be attributed to the accessibility of high-quality materials, customer affordability, and the range of available designs. The demand from end-user industries, including the residential, industrial, and agricultural sectors, and rising residence buildings, are the main drivers of the growth. Due to its low maintenance requirements, durability, and eco-friendliness, vinyl fencing is primarily favoured in the residential market. While wire fences are prevalent in the industrial sector because they offer more protection, wooden fences are more common in areas close to forests.
Fencing is a method of enclosing any property that needs security and protection from trespassers. Fences are put in place to protect commercial, agricultural, and residential buildings. The two most popular wire fences are used for commerce and agriculture. Commercial wire fencing is frequently used to protect parks, homes, and other structures, whereas agriculture wire fencing is frequently used to protect livestock. Building fences serves the dual purposes of preventing cattle from exiting the designated area and ensuring that no trespassers or undesirable objects reach the guarded property. Eco-friendly fence materials are anticipated to grow in popularity as people become more environmentally conscious. But vinyl fences and other low-maintenance options are becoming more popular because of their high-maintenance needs. Other environmentally friendly choices, including wood, composite, and organic recycled materials, are also highly favoured. The natural beauty of wood makes it a popular choice for residential applications. The usage of several technologies in fencing operations includes detection systems, which have sensors built in to detect any disruption caused by attempts to climb or hack the fence. Threats can be found using various techniques, such as infrared sensors, concealed cable detection, and alarm monitoring & control systems. The solar fence is an advanced and innovative technology that ensures one's property is protected and uses sustainable solar energy. When people or animals come in contact with a solar fence, it works similarly to an electric fence by shocking them quickly but intensely. The shock has a minor effect and prevents any fatalities. One of the many technologies used in fences is the electric security fencing system, a type of wired barrier prohibiting animals and people from crossing borders by shocking them with electricity. These technologies may also protect agricultural areas against unforeseen threats. Furthermore, the wires quickly warn the security officials posted in the area.
Get an overview of this study by requesting a free sample
Increasing preference for fencing– Due to a robust economy and a well-established marketplace, the U.S. fencing market is expanding. Due to increasing construction activity and consumer demand for attractive residential products, the market is expanding in the United States. Market expansion is anticipated to be further fuelled by consumer interest in home improvement and decoration. Additionally, the demand for safety and security is rising due to increasing security breaches. The expansion of the real estate industry and a rise in remodelling jobs, the availability of a wide range of products with various styles, features, and colours, as well as readily available customisable items, helps the market flourish. Fencing is frequently utilised in industrial enterprises, colleges, and schools to increase security and safety.
High costs– High energy costs and unpredictable raw material prices are two examples of market expansion constraints. For fencing manufacturers, the cost of electricity and gas is costly and makes up more than 30% of the overall manufacturing expense. By raising the overall cost of the products, multiple companies are aiming to cut losses. Additionally, more metal components must be purchased, which is expensive and challenging to acquire to build strong, multicoloured walls.
Development of eco-friendly material: Market fluctuations are frequently impacted by price variations and the availability of basic materials. A significant product trend is anticipated to improve eco-friendly, robust, durable, and long-lasting materials. Because of their advantages in terms of performance, aesthetics, and preferences, consumers in the U.S. prefer using these materials.
The material segment is divided into wood, concrete, metal, and plastic & composites. The metal segment dominated the market, with a share of around 28.16% in 2022. Steel, aluminium, and other materials like cast iron and wrought iron are all suitable options for metal fences. Inexpensive materials, cost efficiency, security, and aesthetic appeal are some factors driving demand.
The second-largest revenue share of 21.48% in 2022 was contributed by the wood segment. Lattice, picket, rail, and chain link wooden-framed fences are only a few examples of wood fencing. The market is anticipated to expand due to its growing acceptance in residential applications and popularity due to its distinctive visual appeal and affordable pricing.
The application segment is divided into residential and others. The residential segment dominated the market, with a share of around 53.71% in 2022. It is because there are so many people building homes all around the world. Investments in residential fence systems are driven by households' strong emphasis on security and privacy and increased disposable income. Metal and PVC fences generate the majority of the revenue for the residential fence market. Due to the proximity of many homes, privacy fences are becoming more and more common in this market. This makes them more relevant for ease and comfort in daily life.
| Attribute | Description |
|---|---|
| Market Size | Revenue (USD Billion) |
| Market size value in 2022 | USD 9.15 Billion |
| Market size value in 2032 | USD 16.72 Billion |
| CAGR (2023 to 2032) | 6.22% |
| Historical data | 2019-2021 |
| Base Year | 2022 |
| Forecast | 2023-2032 |
| Segments | Material, Application |
As per The Brainy Insights, the size of the U.S. fencing market was valued USD 9.15 Billion in 2022 to USD 16.72 Billion by 2032.
U.S. fencing market is growing at a CAGR of 6.22% during the forecast period 2023-2032.
The U.S. fencing market has been segmented based on material and application. The metal segment led the market in 2022 in the material segment. The residential segment led the market in 2022 in the application segment.
The market's growth will be influenced by the increasing preference for fencing.
High costs could hamper the market growth.
Development of eco-friendly material is providing huge opportunities to the market.
1. Introduction
1.1. Objectives of the Study
1.2. Market Definition
1.3. Research Scope
1.4. Currency
1.5. Key Target Audience
2. Research Methodology and Assumptions
3. Executive Summary
4. Premium Insights
4.1. Porter’s Five Forces Analysis
4.2. Value Chain Analysis
4.3. Top Investment Pockets
4.3.1. Market Attractiveness Analysis By Material
4.3.2. Market Attractiveness Analysis By Application
4.4. Industry Trends
5. Market Dynamics
5.1. Market Evaluation
5.2. Drivers
5.2.1. Increasing preference for fencing
5.3. Restraints
5.3.1. High costs
5.4. Opportunities
5.4.1. Development of eco-friendly material
6. U.S. Fencing Market Analysis and Forecast, By Material
6.1. Segment Overview
6.2. Wood
6.3. Concrete
6.4. Metal
6.5. Plastic & Composites
7. U.S. Fencing Market Analysis and Forecast, By Application
7.1. Segment Overview
7.2. Residential
7.3. Others
8. U.S. Fencing Market-Competitive Landscape
8.1. Overview
8.2. Market Share of Key Players in the Fencing Market
8.2.1. U.S. Company Market Share
8.3. Competitive Situations and Trends
8.3.1. Product Launches and Developments
8.3.2. Partnerships, Collaborations, and Agreements
8.3.3. Mergers & Acquisitions
8.3.4. Expansions
9. Company Profiles
9.1. Ameristar Fence Products Incorporated
9.1.1. Business Overview
9.1.2. Company Snapshot
9.1.3. Company Market Share Analysis
9.1.4. Company Product Portfolio
9.1.5. Recent Developments
9.1.6. SWOT Analysis
9.2. Bekaert
9.2.1. Business Overview
9.2.2. Company Snapshot
9.2.3. Company Market Share Analysis
9.2.4. Company Product Portfolio
9.2.5. Recent Developments
9.2.6. SWOT Analysis
9.3. Gregory Industries
9.3.1. Business Overview
9.3.2. Company Snapshot
9.3.3. Company Market Share Analysis
9.3.4. Company Product Portfolio
9.3.5. Recent Developments
9.3.6. SWOT Analysis
9.4. Long Fence Company Inc.
9.4.1. Business Overview
9.4.2. Company Snapshot
9.4.3. Company Market Share Analysis
9.4.4. Company Product Portfolio
9.4.5. Recent Developments
9.4.6. SWOT Analysis
9.5. Poly Vinyl Creations
9.5.1. Business Overview
9.5.2. Company Snapshot
9.5.3. Company Market Share Analysis
9.5.4. Company Product Portfolio
9.5.5. Recent Developments
9.5.6. SWOT Analysis
9.6. Allied Tube & Conduit
9.6.1. Business Overview
9.6.2. Company Snapshot
9.6.3. Company Market Share Analysis
9.6.4. Company Product Portfolio
9.6.5. Recent Developments
9.6.6. SWOT Analysis
9.7. CERTAINTEED
9.7.1. Business Overview
9.7.2. Company Snapshot
9.7.3. Company Market Share Analysis
9.7.4. Company Product Portfolio
9.7.5. Recent Developments
9.7.6. SWOT Analysis
9.8. Ply Gem Residential Solutions
1.1.1. Business Overview
1.1.2. Company Snapshot
1.1.3. Company Market Share Analysis
1.1.4. Company Product Portfolio
1.1.5. Recent Developments
1.1.6. SWOT Analysis
9.9. Associated Materials LLC
9.9.1. Business Overview
9.9.2. Company Snapshot
9.9.3. Company Market Share Analysis
9.9.4. Company Product Portfolio
9.9.5. Recent Developments
9.9.6. SWOT Analysis
9.10. Jerith Manufacturing
9.10.1. Business Overview
9.10.2. Company Snapshot
9.10.3. Company Market Share Analysis
9.10.4. Company Product Portfolio
9.10.5. Recent Developments
9.10.6. SWOT Analysis
List of Table
1. U.S. Fencing Market, By Material, 2019-2032 (USD Billion)
2. U.S. Wood, Fencing Market, 2019-2032 (USD Billion)
3. U.S. Concrete, Fencing Market, 2019-2032 (USD Billion)
4. U.S. Metal, 2019-2032 (USD Billion)
5. U.S. Plastic & Composites, 2019-2032 (USD Billion)
6. U.S. Fencing Market, By Application, 2019-2032 (USD Billion)
7. U.S. Residential, Fencing Market, 2019-2032 (USD Billion)
8. U.S. Others, Fencing Market, 2019-2032 (USD Billion)
List of Figures
1. U.S. Fencing Market Segmentation
2. Fencing Market: Research Methodology
3. Market Size Estimation Methodology: Bottom-Up Approach
4. Market Size Estimation Methodology: Top-Down Approach
5. Data Triangulation
6. Porter’s Five Forces Analysis
7. Value Chain Analysis
8. U.S. Fencing Market Attractiveness Analysis By Material
9. U.S. Fencing Market Attractiveness Analysis By Application
10. U.S. Fencing Market: Dynamics
11. U.S. Fencing Market Share By Material (2023 & 2032)
12. U.S. Fencing Market Share by Application (2023 & 2032)
13. U.S. Fencing Market Share by Company (2022)
This study forecasts revenue at the country level from 2019 to 2032. The Brainy Insights has segmented the U.S. fencing market based on below mentioned segments:
U.S. Fencing Market by Material:
U.S. Fencing Market by Application:
Research has its special purpose to undertake marketing efficiently. In this competitive scenario, businesses need information across all industry verticals; the information about customer wants, market demand, competition, industry trends, distribution channels etc. This information needs to be updated regularly because businesses operate in a dynamic environment. Our organization, The Brainy Insights incorporates scientific and systematic research procedures in order to get proper market insights and industry analysis for overall business success. The analysis consists of studying the market from a miniscule level wherein we implement statistical tools which helps us in examining the data with accuracy and precision.
Our research reports feature both; quantitative and qualitative aspects for any market. Qualitative information for any market research process are fundamental because they reveal the customer needs and wants, usage and consumption for any product/service related to a specific industry. This in turn aids the marketers/investors in knowing certain perceptions of the customers. Qualitative research can enlighten about the different product concepts and designs along with unique service offering that in turn, helps define marketing problems and generate opportunities. On the other hand, quantitative research engages with the data collection process through interviews, e-mail interactions, surveys and pilot studies. Quantitative aspects for the market research are useful to validate the hypotheses generated during qualitative research method, explore empirical patterns in the data with the help of statistical tools, and finally make the market estimations.
The Brainy Insights offers comprehensive research and analysis, based on a wide assortment of factual insights gained through interviews with CXOs and global experts and secondary data from reliable sources. Our analysts and industry specialist assume vital roles in building up statistical tools and analysis models, which are used to analyse the data and arrive at accurate insights with exceedingly informative research discoveries. The data provided by our organization have proven precious to a diverse range of companies, facilitating them to address issues such as determining which products/services are the most appealing, whether or not customers use the product in the manner anticipated, the purchasing intentions of the market and many others.
Our research methodology encompasses an idyllic combination of primary and secondary initiatives. Key phases involved in this process are listed below:

The phase involves the gathering and collecting of market data and its related information with the help of different sources & research procedures.

The data procurement stage involves in data gathering and collecting through various data sources.
This stage involves in extensive research. These data sources includes:
Purchased Database: Purchased databases play a crucial role in estimating the market sizes irrespective of the domain. Our purchased database includes:
Primary Research: The Brainy Insights interacts with leading companies and experts of the concerned domain to develop the analyst team’s market understanding and expertise. It improves and substantiates every single data presented in the market reports. Primary research mainly involves in telephonic interviews, E-mail interactions and face-to-face interviews with the raw material providers, manufacturers/producers, distributors, & independent consultants. The interviews that we conduct provides valuable data on market size and industry growth trends prevailing in the market. Our organization also conducts surveys with the various industry experts in order to gain overall insights of the industry/market. For instance, in healthcare industry we conduct surveys with the pharmacists, doctors, surgeons and nurses in order to gain insights and key information of a medical product/device/equipment which the customers are going to usage. Surveys are conducted in the form of questionnaire designed by our own analyst team. Surveys plays an important role in primary research because surveys helps us to identify the key target audiences of the market. Additionally, surveys helps to identify the key target audience engaged with the market. Our survey team conducts the survey by targeting the key audience, thus gaining insights from them. Based on the perspectives of the customers, this information is utilized to formulate market strategies. Moreover, market surveys helps us to understand the current competitive situation of the industry. To be precise, our survey process typically involve with the 360 analysis of the market. This analytical process begins by identifying the prospective customers for a product or service related to the market/industry to obtain data on how a product/service could fit into customers’ lives.

Secondary Research: The secondary data sources includes information published by the on-profit organizations such as World bank, WHO, company fillings, investor presentations, annual reports, national government documents, statistical databases, blogs, articles, white papers and others. From the annual report, we analyse a company’s revenue to understand the key segment and market share of that organization in a particular region. We analyse the company websites and adopt the product mapping technique which is important for deriving the segment revenue. In the product mapping method, we select and categorize the products offered by the companies catering to domain specific market, deduce the product revenue for each of the companies so as to get overall estimation of the market size. We also source data and analyses trends based on information received from supply side and demand side intermediaries in the value chain. The supply side denotes the data gathered from supplier, distributor, wholesaler and the demand side illustrates the data gathered from the end customers for respective market domain.

The supply side for a domain specific market is analysed by:
The demand side for the market is estimated through:
In-house Library: Apart from these third-party sources, we have our in-house library of qualitative and quantitative information. Our in-house database includes market data for various industry and domains. These data are updated on regular basis as per the changing market scenario. Our library includes, historic databases, internal audit reports and archives.
Sometimes there are instances where there is no metadata or raw data available for any domain specific market. For those cases, we use our expertise to forecast and estimate the market size in order to generate comprehensive data sets. Our analyst team adopt a robust research technique in order to produce the estimates:
Data Synthesis: This stage involves the analysis & mapping of all the information obtained from the previous step. It also involves in scrutinizing the data for any discrepancy observed while data gathering related to the market. The data is collected with consideration to the heterogeneity of sources. Robust scientific techniques are in place for synthesizing disparate data sets and provide the essential contextual information that can orient market strategies. The Brainy Insights has extensive experience in data synthesis where the data passes through various stages:


Market Deduction & Formulation: The final stage comprises of assigning data points at appropriate market spaces so as to deduce feasible conclusions. Analyst perspective & subject matter expert based holistic form of market sizing coupled with industry analysis also plays a crucial role in this stage.
This stage involves in finalization of the market size and numbers that we have collected from data integration step. With data interpolation, it is made sure that there is no gap in the market data. Successful trend analysis is done by our analysts using extrapolation techniques, which provide the best possible forecasts for the market.
Data Validation & Market Feedback: Validation is the most important step in the process. Validation & re-validation via an intricately designed process helps us finalize data-points to be used for final calculations.

The Brainy Insights interacts with leading companies and experts of the concerned domain to develop the analyst team’s market understanding and expertise. It improves and substantiates every single data presented in the market reports. The data validation interview and discussion panels are typically composed of the most experienced industry members. The participants include, however, are not limited to:
Moreover, we always validate our data and findings through primary respondents from all the major regions we are working on.


Free Customization
Fortune 500 Clients
Free Yearly Update On Purchase Of Multi/Corporate License
Companies Served Till Date