- +1-315-215-1633
- sales@thebrainyinsights.com

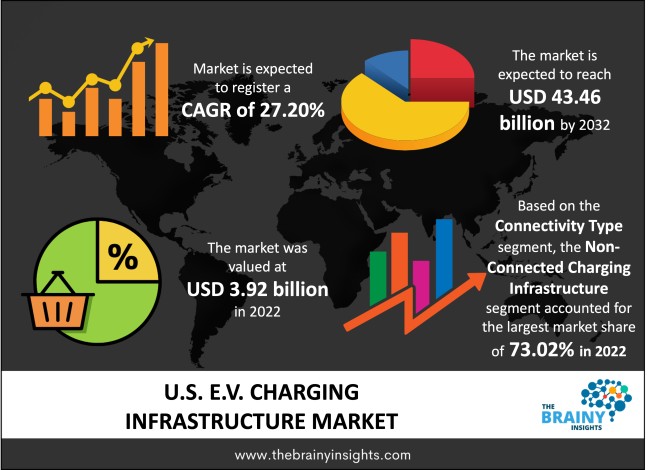
The U.S. Electronic Vehicle (EV) charging infrastructure market was valued at USD 3.92 billion in 2022 and grew at a CAGR of 27.20% from 2023 to 2032. The market is expected to reach USD 43.46 billion by 2032. The increasing market share can be attributed to the high growth rate of electric vehicles and rising initiatives for constructing EV charging infrastructure in commercial places.
A charging station called a charge point or electric vehicle supply equipment, is a piece of machinery that provides electricity for plug-in electric vehicle charging. Connectors that adhere to several international standards are offered by charging stations. In order to be able to charge a variety of automobiles that use conflicting standards, D.C. charging stations consist of numerous ports. Governmental buildings, retail shopping malls, and other parking lots are the traditional locations for public charging stations. Residences, businesses, and hotels are places where one can find private charging outlets. D.C. charging stations and A.C. charging stations are the two main categories. Since alternating current is the predominant kind of electricity transmitted from the power grid, batteries can only be charged with direct current electricity. Due to this, the majority of electric cars come equipped with an onboard charger, also known as an integrated AC-to-DC converter. For charging technologies, a number of standards have been established to allow for vendor interoperability. There are standards for connectors, power, and terminology.
Get an overview of this study by requesting a free sample
Increased sales of electric hybrid vehicles – Electric car sales surpassed 2.1 million worldwide in 2019. Electric vehicles accounted for 2.6 per cent of global car sales in 2019 and about 1% of global car stock, representing a 40 per cent rise year over year. Electric vehicles are becoming more common as technological advancements in the electrification of two/three-wheelers, buses, and trucks progress, and the demand for them expands. In recent years, bold policy announcements have been instrumental in accelerating the adoption of electric vehicles in major vehicle markets. Electric cars are quickly becoming one of the most popular modes of transportation in countries like the USA. Fuel prices continue to rise year after year, but an electric lease will drastically reduce operating costs, saving money in the long term.
The fluctuating cost of components– The development of EV charging infrastructure faces the inherent difficulty of installation cost fluctuation. This is primarily because several factors affect how much it will cost to install a charger. While there is considerable variation in the price of the equipment, it is clear that the installation cost mainly determines the variety in the deployment's overall cost.
A growing number of smart city initiatives - Many people worldwide, including those in the United States, are flocking to cities, causing a surge in demand for resources and services in these areas. By 2025, 34 cities throughout the world will have populations of more than 10 million people. Cities currently utilise two-thirds of global energy and the vast majority of other resources. Mayors from the country said they are more interested in expediting the implementation of digital city services than before the outbreak. Most mayors want to invest in technology like EV charging infrastructure to promote the sales of EVs.
The connectivity type segment is divided into connected charging infrastructure and non-connected charging infrastructure. The non-connected charging infrastructure segment dominated the market, with a share of around 73.02% in 2022. These non-connected chargers enable the users to offer secure and safe charging without paying recurring charges.
The connector type segment is divided into combined charging systems, CHAdeMO and others. The combined charging system segment dominated the market, with a share of around 65.28% in 2022. Combined charging systems are primarily deployed in commercial places due to their easy compatibility with most electric vehicle models available in the U.S. market.
The components segment is divided into protective devices, circuit breakers, I/O modules, A.C. couplers and others. The other segment dominated the market, with a share of around 42.10% in 2022. Different types of connectors are available such as JI772, GB/T, etc. These components should be of global standard in order to be used in different electric vehicles.
The end-user segment is divided into residential and commercial. The commercial segment further includes fleet charging systems, destination charging systems, bus charging systems, highway charging systems and others. The commercial segment dominated the market, with a share of around 66.42% in 2022. The rising funding for deploying electric vehicle charging systems in different commercial places has led to a high market share of the segment.
| Attribute | Description |
|---|---|
| Market Size | Revenue (USD Billion) |
| Market size value in 2022 | USD 3.92 Billion |
| Market size value in 2032 | USD 43.46 Billion |
| CAGR (2023 to 2032) | 27.20% |
| Historical data | 2019-2021 |
| Base Year | 2022 |
| Forecast | 2023-2032 |
| Segments | Connectivity Type, Connector Type, Components, and End-Use |
As per The Brainy Insights, the size of the U.S. EV charging infrastructure market was valued USD 3.92 Billion in 2022 to USD 43.46 Billion by 2032.
U.S. EV Charging Infrastructure market is growing at a CAGR of 27.20% during the forecast period 2023-2032.
The market's growth will be influenced by the growing demand for EVs in the country.
The high cost of setting up an EV charging infrastructure is restraining the market growth.
The smart city initiatives are providing huge opportunities to the market.
Key players are ChargePoint, Inc., SemaConnect Inc., Tesla, Inc., Leviton Manufacturing Co., Inc., ClipperCreek, Inc., Delta Electronics, Inc., General Electric Company, ABB Ltd., Webasto Group, BP pulse among others.
1. Introduction
1.1. Objectives of the Study
1.2. Market Definition
1.3. Research Scope
1.4. Currency
1.5. Key Target Audience
2. Research Methodology and Assumptions
3. Executive Summary
4. Premium Insights
4.1. Porter’s Five Forces Analysis
4.2. Value Chain Analysis
4.3. Top Investment Pockets
4.3.1. Market Attractiveness Analysis By Connectivity Type
4.3.2. Market Attractiveness Analysis By Connector Type
4.3.3. Market Attractiveness Analysis By Components
4.3.4. Market Attractiveness Analysis By End-use
4.4. Industry Trends
5. Market Dynamics
5.1. Market Evaluation
5.2. Drivers
5.2.1. Increasing sales of electric vehicles
5.3. Restraints
5.3.1. High cost of infrastructure
5.4. Opportunities
5.4.1. Increasing investment in smart city initiatives
5.5. Challenges
5.5.1. Dependency on fossil fuels
6. U.S. EV Charging Infrastructure Market Analysis and Forecast, By Connectivity Type
6.1. Segment Overview
6.2. Connected Charging Infrastructure
6.3. Non-Connected Charging Infrastructure
7. U.S. EV Charging Infrastructure Market Analysis and Forecast, By Connector Type
7.1. Segment Overview
7.2. Combined Charging System
7.3. CHAdeMO
7.4. Others
8. U.S. EV Charging Infrastructure Market Analysis and Forecast, By Components
8.1. Segment Overview
8.2. Protective Devices
8.3. Circuit Breakers
8.4. I/O Modules
8.5. AC Couplers
8.6. Others
9. U.S. EV Charging Infrastructure Market Analysis and Forecast, By End-use
9.1. Segment Overview
9.2. Residential
9.3. Commercial
9.3.1. Fleet Charging Systems
9.3.2. Destination Charging Systems
9.3.3. Bus Charging Systems
9.3.4. Highway Charging Systems
9.3.5. Others
10. U.S. EV Charging Infrastructure Market-Competitive Landscape
10.1. Overview
10.2. Market Share of Key Players in the EV Charging Infrastructure Market
10.2.1. U.S. Company Market Share
10.2.2. North America Company Market Share
10.2.3. Europe Company Market Share
10.2.4. APAC Company Market Share
10.3. Competitive Situations and Trends
10.3.1. Product Launches and Developments
10.3.2. Partnerships, Collaborations, and Agreements
10.3.3. Mergers & Acquisitions
10.3.4. Expansions
11. Company Profiles
11.1. ChargePoint, Inc.
11.1.1. Business Overview
11.1.2. Company Snapshot
11.1.3. Company Market Share Analysis
11.1.4. Company Product Portfolio
11.1.5. Recent Developments
11.1.6. SWOT Analysis
11.2. SemaConnect Inc.
11.2.1. Business Overview
11.2.2. Company Snapshot
11.2.3. Company Market Share Analysis
11.2.4. Company Product Portfolio
11.2.5. Recent Developments
11.2.6. SWOT Analysis
11.3. Tesla, Inc.
11.3.1. Business Overview
11.3.2. Company Snapshot
11.3.3. Company Market Share Analysis
11.3.4. Company Product Portfolio
11.3.5. Recent Developments
11.3.6. SWOT Analysis
11.4. Leviton Manufacturing Co., Inc.
11.4.1. Business Overview
11.4.2. Company Snapshot
11.4.3. Company Market Share Analysis
11.4.4. Company Product Portfolio
11.4.5. Recent Developments
11.4.6. SWOT Analysis
11.5. ClipperCreek, Inc.
11.5.1. Business Overview
11.5.2. Company Snapshot
11.5.3. Company Market Share Analysis
11.5.4. Company Product Portfolio
11.5.5. Recent Developments
11.5.6. SWOT Analysis
11.6. Delta Electronics, Inc.
11.6.1. Business Overview
11.6.2. Company Snapshot
11.6.3. Company Market Share Analysis
11.6.4. Company Product Portfolio
11.6.5. Recent Developments
11.6.6. SWOT Analysis
11.7. General Electric Company
11.7.1. Business Overview
11.7.2. Company Snapshot
11.7.3. Company Market Share Analysis
11.7.4. Company Product Portfolio
11.7.5. Recent Developments
11.7.6. SWOT Analysis
11.8. ABB Ltd.
1.1.1. Business Overview
1.1.2. Company Snapshot
1.1.3. Company Market Share Analysis
1.1.4. Company Product Portfolio
1.1.5. Recent Developments
1.1.6. SWOT Analysis
11.9. Webasto Group
11.9.1. Business Overview
11.9.2. Company Snapshot
11.9.3. Company Market Share Analysis
11.9.4. Company Product Portfolio
11.9.5. Recent Developments
11.9.6. SWOT Analysis
11.10. BP pulse
11.10.1. Business Overview
11.10.2. Company Snapshot
11.10.3. Company Market Share Analysis
11.10.4. Company Product Portfolio
11.10.5. Recent Developments
11.10.6. SWOT Analysis
List of Table
1. U.S. EV Charging Infrastructure Market, By Connectivity Type, 2019-2032 (USD Billion)
2. U.S. Connected Charging Infrastructure, EV Charging Infrastructure Market, 2019-2032 (USD Billion)
3. U.S. Non-Connected Charging Infrastructure, EV Charging Infrastructure Market, 2019-2032 (USD Billion)
4. U.S. EV Charging Infrastructure Market, By Connector Type, 2019-2032 (USD Billion)
5. U.S. Combined Charging System, EV Charging Infrastructure Market, 2019-2032 (USD Billion)
6. U.S. CHAdeMO, EV Charging Infrastructure Market, 2019-2032 (USD Billion)
7. U.S. Others, EV Charging Infrastructure Market, 2019-2032 (USD Billion)
8. U.S. EV Charging Infrastructure Market, By Components, 2019-2032 (USD Billion)
9. U.S. Protective Devices, EV Charging Infrastructure Market, 2019-2032 (USD Billion)
10. U.S. Circuit Breakers, EV Charging Infrastructure Market, 2019-2032 (USD Billion)
11. U.S. I/O Modules, EV Charging Infrastructure Market, 2019-2032 (USD Billion)
12. U.S. AC Couplers, EV Charging Infrastructure Market, 2019-2032 (USD Billion)
13. U.S. Others, EV Charging Infrastructure Market, 2019-2032 (USD Billion)
14. U.S. EV Charging Infrastructure Market, By End-use, 2019-2032 (USD Billion)
15. U.S. Residential, EV Charging Infrastructure Market, 2019-2032 (USD Billion)
16. U.S. Commercial, EV Charging Infrastructure Market, 2019-2032 (USD Billion)
List of Figures
1. U.S. EV Charging Infrastructure Market Segmentation
2. EV Charging Infrastructure Market: Research Methodology
3. Market Size Estimation Methodology: Bottom-Up Approach
4. Market Size Estimation Methodology: Top-Down Approach
5. Data Triangulation
6. Porter’s Five Forces Analysis
7. Value Chain Analysis
8. U.S. EV Charging Infrastructure Market Attractiveness Analysis By Connectivity Type
9. U.S. EV Charging Infrastructure Market Attractiveness Analysis By Connector Type
10. U.S. EV Charging Infrastructure Market Attractiveness Analysis By Components
11. U.S. EV Charging Infrastructure Market Attractiveness Analysis By End-use
12. U.S. EV Charging Infrastructure Market: Dynamics
13. U.S. EV Charging Infrastructure Market Share By Connectivity Type (2022 & 2032)
14. U.S. EV Charging Infrastructure Market Share by Connector Type (2022 & 2032)
15. U.S. EV Charging Infrastructure Market Share by Components (2022 & 2032)
16. U.S. EV Charging Infrastructure Market Share by End-use (2022 & 2032)
17. U.S. EV Charging Infrastructure Market Share by Company (2022)
This study forecasts revenue at the country level from 2019 to 2032. The Brainy Insights has segmented the U.S. EV charging infrastructure market based on below mentioned segments:
U.S. EV Charging Infrastructure Market by Connectivity Type:
U.S. EV Charging Infrastructure Market by Connector Type:
U.S. EV Charging Infrastructure Market by Components:
U.S. EV Charging Infrastructure Market by End-use:
Research has its special purpose to undertake marketing efficiently. In this competitive scenario, businesses need information across all industry verticals; the information about customer wants, market demand, competition, industry trends, distribution channels etc. This information needs to be updated regularly because businesses operate in a dynamic environment. Our organization, The Brainy Insights incorporates scientific and systematic research procedures in order to get proper market insights and industry analysis for overall business success. The analysis consists of studying the market from a miniscule level wherein we implement statistical tools which helps us in examining the data with accuracy and precision.
Our research reports feature both; quantitative and qualitative aspects for any market. Qualitative information for any market research process are fundamental because they reveal the customer needs and wants, usage and consumption for any product/service related to a specific industry. This in turn aids the marketers/investors in knowing certain perceptions of the customers. Qualitative research can enlighten about the different product concepts and designs along with unique service offering that in turn, helps define marketing problems and generate opportunities. On the other hand, quantitative research engages with the data collection process through interviews, e-mail interactions, surveys and pilot studies. Quantitative aspects for the market research are useful to validate the hypotheses generated during qualitative research method, explore empirical patterns in the data with the help of statistical tools, and finally make the market estimations.
The Brainy Insights offers comprehensive research and analysis, based on a wide assortment of factual insights gained through interviews with CXOs and global experts and secondary data from reliable sources. Our analysts and industry specialist assume vital roles in building up statistical tools and analysis models, which are used to analyse the data and arrive at accurate insights with exceedingly informative research discoveries. The data provided by our organization have proven precious to a diverse range of companies, facilitating them to address issues such as determining which products/services are the most appealing, whether or not customers use the product in the manner anticipated, the purchasing intentions of the market and many others.
Our research methodology encompasses an idyllic combination of primary and secondary initiatives. Key phases involved in this process are listed below:

The phase involves the gathering and collecting of market data and its related information with the help of different sources & research procedures.

The data procurement stage involves in data gathering and collecting through various data sources.
This stage involves in extensive research. These data sources includes:
Purchased Database: Purchased databases play a crucial role in estimating the market sizes irrespective of the domain. Our purchased database includes:
Primary Research: The Brainy Insights interacts with leading companies and experts of the concerned domain to develop the analyst team’s market understanding and expertise. It improves and substantiates every single data presented in the market reports. Primary research mainly involves in telephonic interviews, E-mail interactions and face-to-face interviews with the raw material providers, manufacturers/producers, distributors, & independent consultants. The interviews that we conduct provides valuable data on market size and industry growth trends prevailing in the market. Our organization also conducts surveys with the various industry experts in order to gain overall insights of the industry/market. For instance, in healthcare industry we conduct surveys with the pharmacists, doctors, surgeons and nurses in order to gain insights and key information of a medical product/device/equipment which the customers are going to usage. Surveys are conducted in the form of questionnaire designed by our own analyst team. Surveys plays an important role in primary research because surveys helps us to identify the key target audiences of the market. Additionally, surveys helps to identify the key target audience engaged with the market. Our survey team conducts the survey by targeting the key audience, thus gaining insights from them. Based on the perspectives of the customers, this information is utilized to formulate market strategies. Moreover, market surveys helps us to understand the current competitive situation of the industry. To be precise, our survey process typically involve with the 360 analysis of the market. This analytical process begins by identifying the prospective customers for a product or service related to the market/industry to obtain data on how a product/service could fit into customers’ lives.

Secondary Research: The secondary data sources includes information published by the on-profit organizations such as World bank, WHO, company fillings, investor presentations, annual reports, national government documents, statistical databases, blogs, articles, white papers and others. From the annual report, we analyse a company’s revenue to understand the key segment and market share of that organization in a particular region. We analyse the company websites and adopt the product mapping technique which is important for deriving the segment revenue. In the product mapping method, we select and categorize the products offered by the companies catering to domain specific market, deduce the product revenue for each of the companies so as to get overall estimation of the market size. We also source data and analyses trends based on information received from supply side and demand side intermediaries in the value chain. The supply side denotes the data gathered from supplier, distributor, wholesaler and the demand side illustrates the data gathered from the end customers for respective market domain.

The supply side for a domain specific market is analysed by:
The demand side for the market is estimated through:
In-house Library: Apart from these third-party sources, we have our in-house library of qualitative and quantitative information. Our in-house database includes market data for various industry and domains. These data are updated on regular basis as per the changing market scenario. Our library includes, historic databases, internal audit reports and archives.
Sometimes there are instances where there is no metadata or raw data available for any domain specific market. For those cases, we use our expertise to forecast and estimate the market size in order to generate comprehensive data sets. Our analyst team adopt a robust research technique in order to produce the estimates:
Data Synthesis: This stage involves the analysis & mapping of all the information obtained from the previous step. It also involves in scrutinizing the data for any discrepancy observed while data gathering related to the market. The data is collected with consideration to the heterogeneity of sources. Robust scientific techniques are in place for synthesizing disparate data sets and provide the essential contextual information that can orient market strategies. The Brainy Insights has extensive experience in data synthesis where the data passes through various stages:


Market Deduction & Formulation: The final stage comprises of assigning data points at appropriate market spaces so as to deduce feasible conclusions. Analyst perspective & subject matter expert based holistic form of market sizing coupled with industry analysis also plays a crucial role in this stage.
This stage involves in finalization of the market size and numbers that we have collected from data integration step. With data interpolation, it is made sure that there is no gap in the market data. Successful trend analysis is done by our analysts using extrapolation techniques, which provide the best possible forecasts for the market.
Data Validation & Market Feedback: Validation is the most important step in the process. Validation & re-validation via an intricately designed process helps us finalize data-points to be used for final calculations.

The Brainy Insights interacts with leading companies and experts of the concerned domain to develop the analyst team’s market understanding and expertise. It improves and substantiates every single data presented in the market reports. The data validation interview and discussion panels are typically composed of the most experienced industry members. The participants include, however, are not limited to:
Moreover, we always validate our data and findings through primary respondents from all the major regions we are working on.


Free Customization
Fortune 500 Clients
Free Yearly Update On Purchase Of Multi/Corporate License
Companies Served Till Date