- +1-315-215-1633
- sales@thebrainyinsights.com

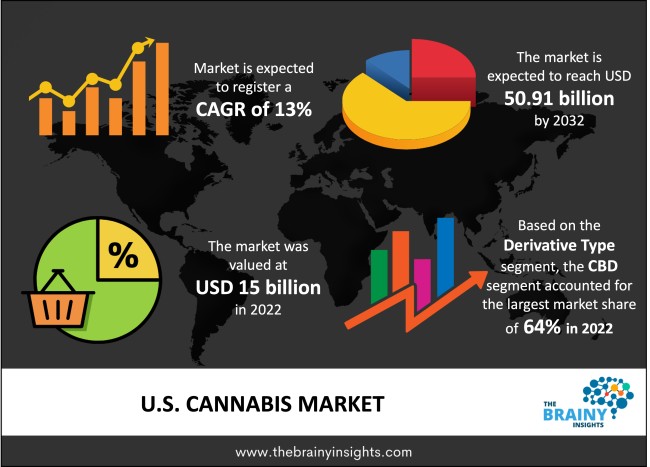
The US cannabis market was valued at USD 15 billion in 2022 and grew at a CAGR of 13% from 2023 to 2032. The market is expected to reach USD 50.91 billion by 2032. The growing legalization of cannabis in the US will drive the growth of the US cannabis market.
Sometimes referred to as marijuana, cannabis is a psychoactive drug made from the cannabis plant. It is indigenous to either Central or South Asia. It has been employed in conventional treatments for countless years. Additionally, it is a narcotic with entheogenic and recreational effects. In various slang terms, cannabis is also known as weed, herb, pot, grass, and ganja. Flowers from Cannabis sativa are a greenish-grey colour. Given its tremendous strength, the cannabis plant's stems, leaves, flowers, and stalks are chopped up and then smoked dry. It can be smoked as a joint, in a pipe or bong, or as a blunt. Cannabis can be used both medicinally and recreationally. Cannabis with a high THC content is used recreationally because it makes users feel relaxed and sleepy. Cannabis has many medical applications, from treating rare epilepsy to alleviating nausea and vomiting caused by cancer chemotherapy. It can be taken for weight loss and aids in regaining lost appetite. Cannabis has anti-inflammatory qualities that make it a highly effective pain reliever. It also aids in controlling sleep.
Get an overview of this study by requesting a free sample
The increasing number of US States legalizing cannabis for medicinal and recreational purposes – The young population of the United States has been increasingly consuming cannabis over the years, given the high it offers and its relaxing benefits for the body. However, the illegality attached to cannabis made the black market and smuggling flourish, causing devastating effects for the user and the US economy. Years of study and scientific exploration have underscored the medicinal and recreational benefits of cannabis when regulated and monitored. Therefore, the US states started legalizing the use of cannabis with specified limits that can be cultivated, sold, kept in possession and utilized personally. With more studies showing the several medicinal benefits of cannabis, more states have started legalizing cannabis, which will drive the US market's growth. Legalizing cannabis has also helped the states take control of the smuggling and black market and increase their income through legalized sales and purchases of cannabis.
The undesirable effects of cannabis – Low-dose and controlled use of cannabis for recreational purposes efficiently address various health concerns. Additionally, it is not advocated for use by healthy people regularly. It is used to manage chronic pain, sleep deprivation, and other conditions. However, the country's young population gravitated towards using it under peer pressure, which may lead to addiction. The consistent use of cannabis by a healthy individual over the long run is detrimental as the risks outweigh the benefits by a considerable margin. Therefore, some states have a prominent pushback against legalising cannabis or a more stringent regulation over its cultivation, sales, purchase and consumption. Therefore, the undesirable effects of cannabis will hinder the market’s growth.
The increasing research and development expenditure to explore the medicinal benefits of cannabis – The countries in the south and east of Asia have been using cannabis in their traditional medicines for centuries. They have mastered the cultivation, proper usage and controlled consumption of cannabis to derive the maximum benefits of the plant. They have also used their wisdom to utilize the plant in their food and beverages. Globalization led to the spread of this knowledge. The growing awareness about the medicinal benefits of cannabis has helped millions deal with chronic ailments. Therefore, the government and other private players have increased their research and development expenditure to explore the other potential benefits of cannabis in treating several illnesses/conditions. The increasing research and development expenditure on cannabis and its medicinal benefits will offer lucrative opportunities to the market players in the forecast period.
The derivative type segment is divided into THC, CBD and others. The CBD segment dominated the market, with a market share of around 64% in 2022. Cannabidiol (CBD) is a chemical found in cannabis. Both hemp and non-hemp plants can be used to produce CBD. All of the cannabis' therapeutic benefits are enhanced and made easier by CBD, which also lessens the psychotic effects associated with THC-dominant weed. Compared to cannabis with a high THC content, CBD has extremely little to no brain effects, making social acceptability and legalization easier. Cannabis with a high CDB content can control mental problems and relieve pain, inflammation, and migraines.
The source segment is divided into marijuana and hemp. The marijuana segment dominated the market, with a market share of around 56% in 2022. Marijuana is much more potent than hemp, which makes it effective for medical purposes. Furthermore, it is a more known form of cannabis, increasing its familiarity and adoption in the market. It can be found in Oils, concentrates, tinctures, isolates, flowers, edibles, etc. Furthermore, it can be infused into foods and drinks and therefore have a wide scope of application.
The end-use segment is divided into medical, recreational, and industrial. The medical segment dominated the market, with a market share of around 46% in 2022. Cannabis has several medical benefits and has been known to be used in traditional medicines worldwide. The medical use of cannabis makes its legalization easier when compared to its use for recreational purposes, thereby driving its dominance in the market. It is an effective treatment for chronic pain, given its anti-inflammatory characteristics that help patients. It is preferred over several other treatments, given the manageable side effects. The increase in the prevalence of chronic pain, the availability of cannabis for pain management on the open market, and the social acceptance of cannabis will all contribute to the segment’s growth.
| Attribute | Description |
|---|---|
| Market Size | Revenue (USD Billion) |
| Market size value in 2022 | USD 15 Billion |
| Market size value in 2032 | USD 50.91 Billion |
| CAGR (2023 to 2032) | 13% |
| Historical data | 2019-2021 |
| Base Year | 2022 |
| Forecast | 2023-2032 |
| Segments | Derivate Type, Source and End Use |
As per The Brainy Insights, the size of the US cannabis market was valued at USD 15 billion in 2022 to USD 50.91 billion by 2032.
US cannabis market is growing at a CAGR of 13% during the forecast period 2023-2032.
The market's growth will be influenced by the increasing number of US States legalizing cannabis for medicinal and recreational purposes.
The undesirable effects of cannabis could hamper the market growth.
1. Introduction
1.1. Objectives of the Study
1.2. Market Definition
1.3. Research Scope
1.4. Currency
1.5. Key Target Audience
2. Research Methodology and Assumptions
3. Executive Summary
4. Premium Insights
4.1. Porter’s Five Forces Analysis
4.2. Value Chain Analysis
4.3. Top Investment Pockets
4.3.1. Market Attractiveness Analysis by Derivative Type
4.3.2. Market Attractiveness Analysis by Source
4.3.3. Market Attractiveness Analysis by End Use
4.4. Industry Trends
5. Market Dynamics
5.1. Market Evaluation
5.2. Drivers
5.2.1. The increasing number of US States legalizing cannabis for medicinal and recreational purposes
5.3. Restraints
5.3.1. The undesirable effects of cannabis
5.4. Opportunities
5.4.1. The increasing research and development expenditure to explore the medicinal benefits of cannabis
5.5. Challenges
5.5.1. The lack of standard regulation.
6. US Cannabis Market Analysis and Forecast, By Derivative Type
6.1. Segment Overview
6.2. THC
6.3. CBD
6.4. Others
7. US Cannabis Market Analysis and Forecast, By Source
7.1. Segment Overview
7.2. Marijuana
7.3. Hemp
8. US Cannabis Market Analysis and Forecast, By End Use
8.1. Segment Overview
8.2. Medical
8.3. Recreational
8.4. Industrial
9. US Cannabis Market-Competitive Landscape
9.1. Overview
9.2. Market Share of Key Players in the US Cannabis Market
9.3. Competitive Situations and Trends
9.3.1. Product Launches and Developments
9.3.2. Partnerships, Collaborations, and Agreements
9.3.3. Mergers & Acquisitions
9.3.4. Expansions
10. Company Profiles
10.1. Aphria, Inc.
10.1.1. Business Overview
10.1.2. Company Snapshot
10.1.3. Company Market Share Analysis
10.1.4. Company Product Portfolio
10.1.5. Recent Developments
10.1.6. SWOT Analysis
10.2. Aurora Cannabis, Inc.
10.2.1. Business Overview
10.2.2. Company Snapshot
10.2.3. Company Market Share Analysis
10.2.4. Company Product Portfolio
10.2.5. Recent Developments
10.2.6. SWOT Analysis
10.3. Cannabis Sativa Inc.
10.3.1. Business Overview
10.3.2. Company Snapshot
10.3.3. Company Market Share Analysis
10.3.4. Company Product Portfolio
10.3.5. Recent Developments
10.3.6. SWOT Analysis
10.4. Canopy Growth Corporation
10.4.1. Business Overview
10.4.2. Company Snapshot
10.4.3. Company Market Share Analysis
10.4.4. Company Product Portfolio
10.4.5. Recent Developments
10.4.6. SWOT Analysis
10.5. Cronos Group
10.5.1. Business Overview
10.5.2. Company Snapshot
10.5.3. Company Market Share Analysis
10.5.4. Company Product Portfolio
10.5.5. Recent Developments
10.5.6. SWOT Analysis
10.6. Curaleaf
10.6.1. Business Overview
10.6.2. Company Snapshot
10.6.3. Company Market Share Analysis
10.6.4. Company Product Portfolio
10.6.5. Recent Developments
10.6.6. SWOT Analysis
10.7. Emerald Health Therapeutics Inc.
10.7.1. Business Overview
10.7.2. Company Snapshot
10.7.3. Company Market Share Analysis
10.7.4. Company Product Portfolio
10.7.5. Recent Developments
10.7.6. SWOT Analysis
10.8. GW Pharmaceuticals, plc
10.8.1. Business Overview
10.8.2. Company Snapshot
10.8.3. Company Market Share Analysis
10.8.4. Company Product Portfolio
10.8.5. Recent Developments
10.8.6. SWOT Analysis
10.9. The Cronos Group Inc.
10.9.1. Business Overview
10.9.2. Company Snapshot
10.9.3. Company Market Share Analysis
10.9.4. Company Product Portfolio
10.9.5. Recent Developments
10.9.6. SWOT Analysis
10.10. Tilray
10.10.1. Business Overview
10.10.2. Company Snapshot
10.10.3. Company Market Share Analysis
10.10.4. Company Product Portfolio
10.10.5. Recent Developments
10.10.6. SWOT Analysis
List of Table
1. US Cannabis Market, By Derivative Type, 2019-2032 (USD Billion)
2. US THC Cannabis Market, By Region, 2019-2032 (USD Billion)
3. US CBD Cannabis Market, By Region, 2019-2032 (USD Billion)
4. US Others Cannabis Market, By Region, 2019-2032 (USD Billion)
5. US Cannabis Market, By Source, 2019-2032 (USD Billion)
6. US Marijuana Cannabis Market, By Region, 2019-2032 (USD Billion)
7. US Hemp Cannabis Market, By Region, 2019-2032 (USD Billion)
8. US Cannabis Market, By End Use, 2019-2032 (USD Billion)
9. US Medical Cannabis Market, By Region, 2019-2032 (USD Billion)
10. US Recreational Cannabis Market, By Region, 2019-2032 (USD Billion)
11. US Industrial Cannabis Market, By Region, 2019-2032 (USD Billion)
List of Figures
1. US Cannabis Market Segmentation
2. Cannabis Market: Research Methodology
3. Market Size Estimation Methodology: Bottom-Up Approach
4. Market Size Estimation Methodology: Top-Down Approach
5. Data Triangulation
6. Porter’s Five Forces Analysis
7. Value Chain Analysis
8. US Cannabis Market Attractiveness Analysis by Derivative Type
9. US Cannabis Market Attractiveness Analysis by Source
10. US Cannabis Market Attractiveness Analysis by End Use
11. US Cannabis Market: Dynamics
12. US Cannabis Market Share by Derivative Type (2022 & 2032)
13. US Cannabis Market Share by Source (2022 & 2032)
14. US Cannabis Market Share by End Use (2022 & 2032)
15. US Cannabis Market Share by Company (2022)
This study forecasts revenue at global, regional, and country levels from 2019 to 2032. The Brainy Insights has segmented the US cannabis market based on below mentioned segments:
US Cannabis Market by Derivative Type:
US Cannabis Market by Source:
US Cannabis Market by End Use:
Research has its special purpose to undertake marketing efficiently. In this competitive scenario, businesses need information across all industry verticals; the information about customer wants, market demand, competition, industry trends, distribution channels etc. This information needs to be updated regularly because businesses operate in a dynamic environment. Our organization, The Brainy Insights incorporates scientific and systematic research procedures in order to get proper market insights and industry analysis for overall business success. The analysis consists of studying the market from a miniscule level wherein we implement statistical tools which helps us in examining the data with accuracy and precision.
Our research reports feature both; quantitative and qualitative aspects for any market. Qualitative information for any market research process are fundamental because they reveal the customer needs and wants, usage and consumption for any product/service related to a specific industry. This in turn aids the marketers/investors in knowing certain perceptions of the customers. Qualitative research can enlighten about the different product concepts and designs along with unique service offering that in turn, helps define marketing problems and generate opportunities. On the other hand, quantitative research engages with the data collection process through interviews, e-mail interactions, surveys and pilot studies. Quantitative aspects for the market research are useful to validate the hypotheses generated during qualitative research method, explore empirical patterns in the data with the help of statistical tools, and finally make the market estimations.
The Brainy Insights offers comprehensive research and analysis, based on a wide assortment of factual insights gained through interviews with CXOs and global experts and secondary data from reliable sources. Our analysts and industry specialist assume vital roles in building up statistical tools and analysis models, which are used to analyse the data and arrive at accurate insights with exceedingly informative research discoveries. The data provided by our organization have proven precious to a diverse range of companies, facilitating them to address issues such as determining which products/services are the most appealing, whether or not customers use the product in the manner anticipated, the purchasing intentions of the market and many others.
Our research methodology encompasses an idyllic combination of primary and secondary initiatives. Key phases involved in this process are listed below:

The phase involves the gathering and collecting of market data and its related information with the help of different sources & research procedures.

The data procurement stage involves in data gathering and collecting through various data sources.
This stage involves in extensive research. These data sources includes:
Purchased Database: Purchased databases play a crucial role in estimating the market sizes irrespective of the domain. Our purchased database includes:
Primary Research: The Brainy Insights interacts with leading companies and experts of the concerned domain to develop the analyst team’s market understanding and expertise. It improves and substantiates every single data presented in the market reports. Primary research mainly involves in telephonic interviews, E-mail interactions and face-to-face interviews with the raw material providers, manufacturers/producers, distributors, & independent consultants. The interviews that we conduct provides valuable data on market size and industry growth trends prevailing in the market. Our organization also conducts surveys with the various industry experts in order to gain overall insights of the industry/market. For instance, in healthcare industry we conduct surveys with the pharmacists, doctors, surgeons and nurses in order to gain insights and key information of a medical product/device/equipment which the customers are going to usage. Surveys are conducted in the form of questionnaire designed by our own analyst team. Surveys plays an important role in primary research because surveys helps us to identify the key target audiences of the market. Additionally, surveys helps to identify the key target audience engaged with the market. Our survey team conducts the survey by targeting the key audience, thus gaining insights from them. Based on the perspectives of the customers, this information is utilized to formulate market strategies. Moreover, market surveys helps us to understand the current competitive situation of the industry. To be precise, our survey process typically involve with the 360 analysis of the market. This analytical process begins by identifying the prospective customers for a product or service related to the market/industry to obtain data on how a product/service could fit into customers’ lives.

Secondary Research: The secondary data sources includes information published by the on-profit organizations such as World bank, WHO, company fillings, investor presentations, annual reports, national government documents, statistical databases, blogs, articles, white papers and others. From the annual report, we analyse a company’s revenue to understand the key segment and market share of that organization in a particular region. We analyse the company websites and adopt the product mapping technique which is important for deriving the segment revenue. In the product mapping method, we select and categorize the products offered by the companies catering to domain specific market, deduce the product revenue for each of the companies so as to get overall estimation of the market size. We also source data and analyses trends based on information received from supply side and demand side intermediaries in the value chain. The supply side denotes the data gathered from supplier, distributor, wholesaler and the demand side illustrates the data gathered from the end customers for respective market domain.

The supply side for a domain specific market is analysed by:
The demand side for the market is estimated through:
In-house Library: Apart from these third-party sources, we have our in-house library of qualitative and quantitative information. Our in-house database includes market data for various industry and domains. These data are updated on regular basis as per the changing market scenario. Our library includes, historic databases, internal audit reports and archives.
Sometimes there are instances where there is no metadata or raw data available for any domain specific market. For those cases, we use our expertise to forecast and estimate the market size in order to generate comprehensive data sets. Our analyst team adopt a robust research technique in order to produce the estimates:
Data Synthesis: This stage involves the analysis & mapping of all the information obtained from the previous step. It also involves in scrutinizing the data for any discrepancy observed while data gathering related to the market. The data is collected with consideration to the heterogeneity of sources. Robust scientific techniques are in place for synthesizing disparate data sets and provide the essential contextual information that can orient market strategies. The Brainy Insights has extensive experience in data synthesis where the data passes through various stages:


Market Deduction & Formulation: The final stage comprises of assigning data points at appropriate market spaces so as to deduce feasible conclusions. Analyst perspective & subject matter expert based holistic form of market sizing coupled with industry analysis also plays a crucial role in this stage.
This stage involves in finalization of the market size and numbers that we have collected from data integration step. With data interpolation, it is made sure that there is no gap in the market data. Successful trend analysis is done by our analysts using extrapolation techniques, which provide the best possible forecasts for the market.
Data Validation & Market Feedback: Validation is the most important step in the process. Validation & re-validation via an intricately designed process helps us finalize data-points to be used for final calculations.

The Brainy Insights interacts with leading companies and experts of the concerned domain to develop the analyst team’s market understanding and expertise. It improves and substantiates every single data presented in the market reports. The data validation interview and discussion panels are typically composed of the most experienced industry members. The participants include, however, are not limited to:
Moreover, we always validate our data and findings through primary respondents from all the major regions we are working on.


Free Customization
Fortune 500 Clients
Free Yearly Update On Purchase Of Multi/Corporate License
Companies Served Till Date