- +1-315-215-1633
- sales@thebrainyinsights.com

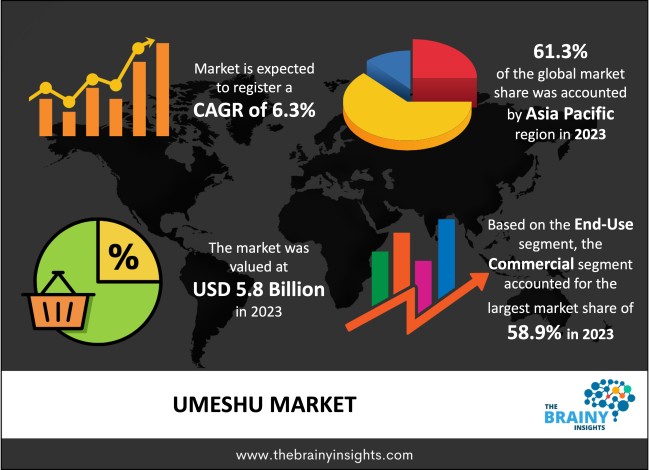
The Umeshu Market was valued at USD 5.8 billion in 2023 and grew at a CAGR of 6.3% from 2024 to 2033. The rise in the number of young adults worldwide, an increase in disposable money, and an increase in customer demand for regular, premium and super premium items are all contributing to the enormous expansion of the umeshu (plum wine) industry globally. Additionally, it is anticipated that the manufacturers of plum wine will keep working to expand and fortify their channels of distribution, as well as to open up new avenues for sales such as convenience stores and online stores.
In Japan, umeshu is a widely consumed traditional alcoholic beverage. A fruity and sweet liquor is produced by brewing green ume fruits, or Japanese plums, in sugar and alcohol. Since Umeshu is a well-known and popular beverage in Japan, the market for it has mostly focused on it. Furthermore, Umeshu is connected to traditional events and festivals in Japan, where it has cultural significance.
Get an overview of this study by requesting a free sample
Umeshu is deeply ingrained in Japanese culture and is frequently connected to customary rituals and festivities. Its continued appeal among Japanese customers is partly attributed to its cultural significance. Additionally, interest in Japanese drinks, like as Umeshu, has grown as a result of the success of Japanese food around the world. Consumers might find and enjoy conventional beverages like Umeshu as they delve further into various facets of Japanese culture.
In markets where there is little knowledge or comprehension of Japanese alcoholic beverages, Umeshu may encounter difficulties. In certain places, educating customers about the product's special features could be a barrier to entrance. Additionally, Umeshu can encounter fierce rivalry in some markets from other well-known liqueurs and spirits. It can be difficult to persuade customers to pick Umeshu over well-known brands or conventional drinks.
Producers of umeshu have a chance to go beyond their customary markets, particularly in areas where interest in Japanese food and drink is growing. New international markets should be investigated and tapped into in order to boost the market as a whole. Additionally, expanding the range of flavors, variants, and packaging choices can draw in more customers. Manufacturers can try aging methods, fruit infusions, or partnerships with other companies to make unique Umeshu items that are distinctive in the marketplace.
Asia Pacific led the market in 2023 with the largest market share of 61.3%. Traditionally, Japan and a few other Asian nations have been big fans of umeshu. Because of its regional tastes and cultural linkages, Umeshu finds that the Asia-Pacific area is a big market. Japan has strong cultural ties to umeshu, and drinking it is connected to many customs and traditional festivals. Umeshu's appeal as a traditional and genuine Japanese beverage adds to its popularity throughout the Asia Pacific area, wherein cultural interaction with Japan is strong. Additionally, areas that see a large number of Japanese tourists may see a rise in demand for Umeshu. Travelers frequently look for real experiences, and sampling traditional Japanese drinks like umeshu can be a part of that gastronomic adventure.
Asia Pacific Region Umeshu Market Share in 2023 - 61.3%
www.thebrainyinsights.com
Check the geographical analysis of this market by requesting a free sample
The Commercial segment dominated the global market in 2023 with a market share of 58.9%. Given its versatility, umeshu's appeal in commercial settings may be influenced by culinary tastes and the custom of matching alcoholic drinks with food. Umeshu can be found on menus at restaurants and pubs, where it can be paired with different foods to improve the dining experience. Additionally, Umeshu now has commercial venues where it can be used thanks to the global boom in cocktail culture. Bartenders frequently experiment with various ingredients, and Umeshu's distinct flavor can be highlighted in creative cocktails to draw in customers looking for novel and interesting drink selections.
The Supermarkets/hypermarkets segment dominated the global market in 2023 with a market share of 54.6%. Supermarkets and hypermarkets give customers the convenience of a single place to shop. Customers may readily access and buy Umeshu together with other goods and items thanks to its accessibility in these retail environments. Additionally, supermarkets and hypermarkets usually have a wide distribution network that reaches a large number of customers. This broad availability helps Umeshu by enabling a wider audience to access it. The fact that Umeshu is stocked in supermarkets and hypermarkets further enhances the brand's visibility. Strategic placement combined with eye-catching packaging can draw customers and encourage impulsive purchases.
| Attribute | Description |
|---|---|
| Market Size | Revenue (USD Billion) |
| Market size value in 2023 | USD 5.8 Billion |
| Market size value in 2033 | USD 10.1 Billion |
| CAGR (2024 to 2033) | 6.3% |
| Historical data | 2020-2022 |
| Base Year | 2023 |
| Forecast | 2024-2033 |
| Region | The regions analyzed for the market are Asia Pacific, Europe, South America, North America, and Middle East & Africa. Furthermore, the regions are further analyzed at the country level. |
| Segments | End-User, Distribution Channel |
As per The Brainy Insights, the size of the umeshu market was valued at USD 5.8 billion in 2023 to USD 10.1 billion by 2033.
The global umeshu market is growing at a CAGR of 6.3% during the forecast period 2024-2033.
The Asia Pacific region emerged as the largest market for the umeshu.
The rising consumer interest in unique flavors will influence the market's growth.
1. Introduction
1.1. Objectives of the Study
1.2. Market Definition
1.3. Research Scope
1.4. Currency
1.5. Key Target Audience
2. Research Methodology and Assumptions
3. Executive Summary
4. Premium Insights
4.1. Porter’s Five Forces Analysis
4.2. Value Chain Analysis
4.3. Top Investment Pockets
4.3.1. Market Attractiveness Analysis by End-User
4.3.2. Market Attractiveness Analysis by Distribution Channel
4.3.3. Market Attractiveness Analysis by Region
4.4. Industry Trends
5. Market Dynamics
5.1. Market Evaluation
5.2. Drivers
5.2.1. Growing Popularity of Japanese Cuisine
5.2.2. Rising Consumer Interest in Unique Flavors
5.3. Restraints
5.3.1. Limited Awareness Outside Asia
5.4. Opportunities
5.4.1. Cultural Experiences and Tourism
5.5. Challenges
5.5.1. Cultural Adaptation
6. Global Umeshu Market Analysis and Forecast, By End-User
6.1. Segment Overview
6.2. Residential
6.3. Commercial
7. Global Umeshu Market Analysis and Forecast, By Distribution Channel
7.1. Segment Overview
7.2. Supermarkets/hypermarkets
7.3. Convenience Stores
7.4. Retailers
7.5. Online
8. Global Umeshu Market Analysis and Forecast, By Regional Analysis
8.1. Segment Overview
8.2. North America
8.2.1. U.S.
8.2.2. Canada
8.2.3. Mexico
8.3. Europe
8.3.1. Germany
8.3.2. France
8.3.3. U.K.
8.3.4. Italy
8.3.5. Spain
8.4. Asia-Pacific
8.4.1. Japan
8.4.2. China
8.4.3. India
8.5. South America
8.5.1. Brazil
8.6. Middle East and Africa
8.6.1. UAE
8.6.2. South Africa
9. Global Umeshu Market-Competitive Landscape
9.1. Overview
9.2. Market Share of Key Players in the Umeshu Market
9.2.1. Global Company Market Share
9.2.2. North America Company Market Share
9.2.3. Europe Company Market Share
9.2.4. APAC Company Market Share
9.3. Competitive Situations and Trends
9.3.1. Product Launches and Developments
9.3.2. Partnerships, Collaborations, and Agreements
9.3.3. Mergers & Acquisitions
9.3.4. Expansions
10. Company Profiles
10.1. Choya Umeshu
10.1.1. Business Overview
10.1.2. Company Snapshot
10.1.3. Company Market Share Analysis
10.1.4. Company Product Portfolio
10.1.5. Recent Developments
10.1.6. SWOT Analysis
10.2. Ozeki
10.2.1. Business Overview
10.2.2. Company Snapshot
10.2.3. Company Market Share Analysis
10.2.4. Company Product Portfolio
10.2.5. Recent Developments
10.2.6. SWOT Analysis
10.3. Xsens Technologies BV
10.3.1. Business Overview
10.3.2. Company Snapshot
10.3.3. Company Market Share Analysis
10.3.4. Company Product Portfolio
10.3.5. Recent Developments
10.3.6. SWOT Analysis
10.4. Umenoyado
10.4.1. Business Overview
10.4.2. Company Snapshot
10.4.3. Company Market Share Analysis
10.4.4. Company Product Portfolio
10.4.5. Recent Developments
10.4.6. SWOT Analysis
10.5. Takara Sake
10.5.1. Business Overview
10.5.2. Company Snapshot
10.5.3. Company Market Share Analysis
10.5.4. Company Product Portfolio
10.5.5. Recent Developments
10.5.6. SWOT Analysis
10.6. Jinro
10.6.1. Business Overview
10.6.2. Company Snapshot
10.6.3. Company Market Share Analysis
10.6.4. Company Product Portfolio
10.6.5. Recent Developments
10.6.6. SWOT Analysis
10.7. Creation Food
10.7.1. Business Overview
10.7.2. Company Snapshot
10.7.3. Company Market Share Analysis
10.7.4. Company Product Portfolio
10.7.5. Recent Developments
10.7.6. SWOT Analysis
10.8. Suntory
10.8.1. Business Overview
10.8.2. Company Snapshot
10.8.3. Company Market Share Analysis
10.8.4. Company Product Portfolio
10.8.5. Recent Developments
10.8.6. SWOT Analysis
10.9. Lotte
10.9.1. Business Overview
10.9.2. Company Snapshot
10.9.3. Company Market Share Analysis
10.9.4. Company Product Portfolio
10.9.5. Recent Developments
10.9.6. SWOT Analysis
10.10. Uisuki
10.10.1. Business Overview
10.10.2. Company Snapshot
10.10.3. Company Market Share Analysis
10.10.4. Company Product Portfolio
10.10.5. Recent Developments
10.10.6. SWOT Analysis
10.11. Kiku Masamune
10.11.1. Business Overview
10.11.2. Company Snapshot
10.11.3. Company Market Share Analysis
10.11.4. Company Product Portfolio
10.11.5. Recent Developments
10.11.6. SWOT Analysis
List of Table
1. Global Umeshu Market, By End-User, 2020-2033 (USD Billion)
2. Global Residential Umeshu Market, By Region, 2020-2033 (USD Billion)
3. Global Commercial Umeshu Market, By Region, 2020-2033 (USD Billion)
4. Global Umeshu Market, By Distribution Channel, 2020-2033 (USD Billion)
5. Global Supermarkets/hypermarkets Umeshu Market, By Region, 2020-2033 (USD Billion)
6. Global Convenience Stores Umeshu Market, By Region, 2020-2033 (USD Billion)
7. Global Retailers Umeshu Market, By Region, 2020-2033 (USD Billion)
8. Global Online Umeshu Market, By Region, 2020-2033 (USD Billion)
9. Global Umeshu Market, By Region, 2020-2033 (USD Billion)
10. North America Umeshu Market, By End-User, 2020-2033 (USD Billion)
11. North America Umeshu Market, By Distribution Channel, 2020-2033 (USD Billion)
12. U.S. Umeshu Market, By End-User, 2020-2033 (USD Billion)
13. U.S. Umeshu Market, By Distribution Channel, 2020-2033 (USD Billion)
14. Canada Umeshu Market, By End-User, 2020-2033 (USD Billion)
15. Canada Umeshu Market, By Distribution Channel, 2020-2033 (USD Billion)
16. Mexico Umeshu Market, By End-User, 2020-2033 (USD Billion)
17. Mexico Umeshu Market, By Distribution Channel, 2020-2033 (USD Billion)
18. Europe Umeshu Market, By End-User, 2020-2033 (USD Billion)
19. Europe Umeshu Market, By Distribution Channel, 2020-2033 (USD Billion)
20. Germany Umeshu Market, By End-User, 2020-2033 (USD Billion)
21. Germany Umeshu Market, By Distribution Channel, 2020-2033 (USD Billion)
22. France Umeshu Market, By End-User, 2020-2033 (USD Billion)
23. France Umeshu Market, By Distribution Channel, 2020-2033 (USD Billion)
24. U.K. Umeshu Market, By End-User, 2020-2033 (USD Billion)
25. U.K. Umeshu Market, By Distribution Channel, 2020-2033 (USD Billion)
26. Italy Umeshu Market, By End-User, 2020-2033 (USD Billion)
27. Italy Umeshu Market, By Distribution Channel, 2020-2033 (USD Billion)
28. Spain Umeshu Market, By End-User, 2020-2033 (USD Billion)
29. Spain Umeshu Market, By Distribution Channel, 2020-2033 (USD Billion)
30. Asia Pacific Umeshu Market, By End-User, 2020-2033 (USD Billion)
31. Asia Pacific Umeshu Market, By Distribution Channel, 2020-2033 (USD Billion)
32. Japan Umeshu Market, By End-User, 2020-2033 (USD Billion)
33. Japan Umeshu Market, By Distribution Channel, 2020-2033 (USD Billion)
34. China Umeshu Market, By End-User, 2020-2033 (USD Billion)
35. China Umeshu Market, By Distribution Channel, 2020-2033 (USD Billion)
36. India Umeshu Market, By End-User, 2020-2033 (USD Billion)
37. India Umeshu Market, By Distribution Channel, 2020-2033 (USD Billion)
38. South America Umeshu Market, By End-User, 2020-2033 (USD Billion)
39. South America Umeshu Market, By Distribution Channel, 2020-2033 (USD Billion)
40. Brazil Umeshu Market, By End-User, 2020-2033 (USD Billion)
41. Brazil Umeshu Market, By Distribution Channel, 2020-2033 (USD Billion)
42. Middle East and Africa Umeshu Market, By End-User, 2020-2033 (USD Billion)
43. Middle East and Africa Umeshu Market, By Distribution Channel, 2020-2033 (USD Billion)
44. UAE Umeshu Market, By End-User, 2020-2033 (USD Billion)
45. UAE Umeshu Market, By Distribution Channel, 2020-2033 (USD Billion)
46. South Africa Umeshu Market, By End-User, 2020-2033 (USD Billion)
47. South Africa Umeshu Market, By Distribution Channel, 2020-2033 (USD Billion)
List of Figures
1. Global Umeshu Market Segmentation
2. Umeshu Market: Research Methodology
3. Market Size Estimation Methodology: Bottom-Up Approach
4. Market Size Estimation Methodology: Top-Down Approach
5. Data Triangulation
6. Porter’s Five Forces Analysis
7. Value Chain Analysis
8. Global Umeshu Market Attractiveness Analysis by End-User
9. Global Umeshu Market Attractiveness Analysis by Distribution Channel
10. Global Umeshu Market Attractiveness Analysis by Region
11. Global Umeshu Market: Dynamics
12. Global Umeshu Market Share by End-User (2023 & 2033)
13. Global Umeshu Market Share by Distribution Channel (2023 & 2033)
14. Global Umeshu Market Share by Regions (2023 & 2033)
15. Global Umeshu Market Share by Company (2023)
This study forecasts revenue at global, regional, and country levels from 2020 to 2033. The Brainy Insights has segmented the global umeshu market based on below-mentioned segments:
Global Umeshu Market by End-User:
Global Umeshu Market by Distribution Channel:
Global Umeshu Market by Region:
Research has its special purpose to undertake marketing efficiently. In this competitive scenario, businesses need information across all industry verticals; the information about customer wants, market demand, competition, industry trends, distribution channels etc. This information needs to be updated regularly because businesses operate in a dynamic environment. Our organization, The Brainy Insights incorporates scientific and systematic research procedures in order to get proper market insights and industry analysis for overall business success. The analysis consists of studying the market from a miniscule level wherein we implement statistical tools which helps us in examining the data with accuracy and precision.
Our research reports feature both; quantitative and qualitative aspects for any market. Qualitative information for any market research process are fundamental because they reveal the customer needs and wants, usage and consumption for any product/service related to a specific industry. This in turn aids the marketers/investors in knowing certain perceptions of the customers. Qualitative research can enlighten about the different product concepts and designs along with unique service offering that in turn, helps define marketing problems and generate opportunities. On the other hand, quantitative research engages with the data collection process through interviews, e-mail interactions, surveys and pilot studies. Quantitative aspects for the market research are useful to validate the hypotheses generated during qualitative research method, explore empirical patterns in the data with the help of statistical tools, and finally make the market estimations.
The Brainy Insights offers comprehensive research and analysis, based on a wide assortment of factual insights gained through interviews with CXOs and global experts and secondary data from reliable sources. Our analysts and industry specialist assume vital roles in building up statistical tools and analysis models, which are used to analyse the data and arrive at accurate insights with exceedingly informative research discoveries. The data provided by our organization have proven precious to a diverse range of companies, facilitating them to address issues such as determining which products/services are the most appealing, whether or not customers use the product in the manner anticipated, the purchasing intentions of the market and many others.
Our research methodology encompasses an idyllic combination of primary and secondary initiatives. Key phases involved in this process are listed below:

The phase involves the gathering and collecting of market data and its related information with the help of different sources & research procedures.

The data procurement stage involves in data gathering and collecting through various data sources.
This stage involves in extensive research. These data sources includes:
Purchased Database: Purchased databases play a crucial role in estimating the market sizes irrespective of the domain. Our purchased database includes:
Primary Research: The Brainy Insights interacts with leading companies and experts of the concerned domain to develop the analyst team’s market understanding and expertise. It improves and substantiates every single data presented in the market reports. Primary research mainly involves in telephonic interviews, E-mail interactions and face-to-face interviews with the raw material providers, manufacturers/producers, distributors, & independent consultants. The interviews that we conduct provides valuable data on market size and industry growth trends prevailing in the market. Our organization also conducts surveys with the various industry experts in order to gain overall insights of the industry/market. For instance, in healthcare industry we conduct surveys with the pharmacists, doctors, surgeons and nurses in order to gain insights and key information of a medical product/device/equipment which the customers are going to usage. Surveys are conducted in the form of questionnaire designed by our own analyst team. Surveys plays an important role in primary research because surveys helps us to identify the key target audiences of the market. Additionally, surveys helps to identify the key target audience engaged with the market. Our survey team conducts the survey by targeting the key audience, thus gaining insights from them. Based on the perspectives of the customers, this information is utilized to formulate market strategies. Moreover, market surveys helps us to understand the current competitive situation of the industry. To be precise, our survey process typically involve with the 360 analysis of the market. This analytical process begins by identifying the prospective customers for a product or service related to the market/industry to obtain data on how a product/service could fit into customers’ lives.

Secondary Research: The secondary data sources includes information published by the on-profit organizations such as World bank, WHO, company fillings, investor presentations, annual reports, national government documents, statistical databases, blogs, articles, white papers and others. From the annual report, we analyse a company’s revenue to understand the key segment and market share of that organization in a particular region. We analyse the company websites and adopt the product mapping technique which is important for deriving the segment revenue. In the product mapping method, we select and categorize the products offered by the companies catering to domain specific market, deduce the product revenue for each of the companies so as to get overall estimation of the market size. We also source data and analyses trends based on information received from supply side and demand side intermediaries in the value chain. The supply side denotes the data gathered from supplier, distributor, wholesaler and the demand side illustrates the data gathered from the end customers for respective market domain.

The supply side for a domain specific market is analysed by:
The demand side for the market is estimated through:
In-house Library: Apart from these third-party sources, we have our in-house library of qualitative and quantitative information. Our in-house database includes market data for various industry and domains. These data are updated on regular basis as per the changing market scenario. Our library includes, historic databases, internal audit reports and archives.
Sometimes there are instances where there is no metadata or raw data available for any domain specific market. For those cases, we use our expertise to forecast and estimate the market size in order to generate comprehensive data sets. Our analyst team adopt a robust research technique in order to produce the estimates:
Data Synthesis: This stage involves the analysis & mapping of all the information obtained from the previous step. It also involves in scrutinizing the data for any discrepancy observed while data gathering related to the market. The data is collected with consideration to the heterogeneity of sources. Robust scientific techniques are in place for synthesizing disparate data sets and provide the essential contextual information that can orient market strategies. The Brainy Insights has extensive experience in data synthesis where the data passes through various stages:


Market Deduction & Formulation: The final stage comprises of assigning data points at appropriate market spaces so as to deduce feasible conclusions. Analyst perspective & subject matter expert based holistic form of market sizing coupled with industry analysis also plays a crucial role in this stage.
This stage involves in finalization of the market size and numbers that we have collected from data integration step. With data interpolation, it is made sure that there is no gap in the market data. Successful trend analysis is done by our analysts using extrapolation techniques, which provide the best possible forecasts for the market.
Data Validation & Market Feedback: Validation is the most important step in the process. Validation & re-validation via an intricately designed process helps us finalize data-points to be used for final calculations.

The Brainy Insights interacts with leading companies and experts of the concerned domain to develop the analyst team’s market understanding and expertise. It improves and substantiates every single data presented in the market reports. The data validation interview and discussion panels are typically composed of the most experienced industry members. The participants include, however, are not limited to:
Moreover, we always validate our data and findings through primary respondents from all the major regions we are working on.


Free Customization
Fortune 500 Clients
Free Yearly Update On Purchase Of Multi/Corporate License
Companies Served Till Date