- +1-315-215-1633
- sales@thebrainyinsights.com

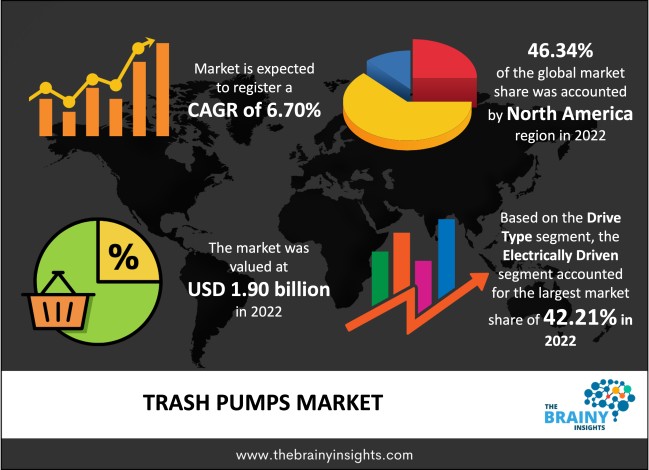
The global trash pumps market was valued at USD 1.90 Billion in 2022, increasing at a CAGR of 6.70% from 2023 to 2032 and anticipated to reach USD 3.63 Billion by 2032. Asia Pacific is expected to grow the fastest during the forecast period. Also, the increasing applications of pumps in multiple end-use industries such as mining, oil & gas, industrial, agriculture, residential, and municipal water are expected to drive market growth during the forecast period.
Trash pumps are portable pumps and are generally for dewatering applications. Trash pumps are created to pump large amounts of water that include hard & soft solids like leaves, mud, twigs, sand, and sludge. Trash pumps are utilized in various municipal, industrial, and speciality applications. Examples include construction, agriculture and horticulture, oil and gas production, flood control, mining, and pulp and paper production. Petrochemical & hydrocarbon pumps are rated for materials such as paraffin wax, diesel oil, kerosene, gasoline, lubricating oil, and asphalt. There are four kinds of trash pumps: sanitary pumps, syringe pumps, progressive cavity pumps, and positive displacement pumps. Sanitary pumps are utilized in applications of progressive cavity trash pumps that need a higher level of sanitation, like in food, breweries, and biotech firms. This type of pump can also move slurries & meter solutions. Also, sanitary pumps deliver a variety of pump types & features. Advanced cavity pumps are utilized for moving slurries & fluids with suspended solids. The liquids are transferred from one side of the pump to another side (discharge) and then to a storage tank or via a pipeline. Cavity pumps can efficiently move slower-moving viscous materials, and fluids from these pumps can be moved continuously. They can be utilized in applications requiring greater sterility & sanitation since they can be easily cleaned. Syringe pumps are operated for processing materials that need an exact flow amount at identical intervals. There are two kinds of syringe pumps: withdrawal pumps remove the fluid & infusion pumps process fluid at highly controlled pressures.
Get an overview of this study by requesting a free sample
Rapid urbanization and industrialization: The increasing use of water pumps in several household applications, including an in-house water fountains, gardening, and water coolers, is one of the driving factors of the market growth. Moreover, the high electricity demand, industrialization, and investments in renewable power generation in countries are expected to propel market growth over the forecast period. Further, the increasing use of pumps in various applications coupled with stormwater, cooling water, land drainage, wastewater, and dock dewatering is expected to propel the market growth over the forecast period.
The high initial cost: The customer's preference for low-priced water pumps instead of reputed brands is one of the restraining factors of the market growth. Additionally, the high initial cost, the non-uniform flow of liquid, and increased maintenance price due to a higher degree of tear and wear are also hindering the market growth.
The increasing applications of pumps in multiple end-use industries: The increasing applications of pumps in various end-use industries like residential, oil & gas, mining, agriculture, industrial, and municipal water are the driving factor of the market growth. Further, the rapid growth trend of solar-powered irrigation in developing countries is strengthening water, energy, and food security. The increasing R&D activities and constant technological advancements are also helping to stimulate market growth during the forecast period. Apart from this, an increase in manufacturing & industrial activities worldwide leads to a rise in demand for more electric pumps worldwide and is expected to promote market growth over the forthcoming year.
The regions analyzed for the market include Europe, South America, Asia Pacific, North America, the Middle East, and Africa. Asia Pacific emerged as the most significant global trash pumps market, with a 46.34% market revenue share in 2022. Asia Pacific dominates the trash pumps market due to the economic expansion in countries like China, Japan, India, South Korea, Australia, and Singapore. Moreover, the increasing dependency on groundwater for irrigation & other agricultural objectives instead of monsoons in developing nations such as India and the presence of prominent players operating in countries are also helping to drive market growth in this region. Additionally, the increasing demand for automation systems with the installation of smart sensors and increased spending on infrastructure development across several countries, including Japan, India, China & South Korea, are anticipated to drive market growth in this region. North America is expected to grow the fastest during the forecast period due to the increasing demand for water pump from the oil & gas industry. Moreover, the growing extraction of hydrocarbons from unconventional and conventional reserves, coupled with expanding mining and construction activities, is also helping to boost the market growth in this region over the forecast period. However, integrating IoT sensors in centrifugal pumps, increasing urbanization and infrastructure developments, and growing energy efficiency by using pumps are expected to promote market growth.
Asia Pacific Region Trash Pumps Market Share in 2022 - 46.34%
www.thebrainyinsights.com
Check the geographical analysis of this market by requesting a free sample
The application segment is divided into government, enterprise, personal, and others. The enterprise segment dominated, with a market share of around 37.16% in 2022. This growth is attributed to the growing demand for enterprise mobility solutions. However, the enterprise applications include large-scale government or municipal corporations, hospitals or medical centers, educational institutions (K-12), corporate offices, and IT parks.
The drive type segment is divided into engine driven, electrically driven, and gas driven. In 2022, the electrically driven segment dominated the market with 42.21% and a revenue of USD 89.88 million. This growth is attributed to the rapidly increasing trend of solar-powered irrigation. Further, by 2032, the engine-driven segment will likely dominate the market due to municipalities' rising demand for centrifugal pumps in different applications.
The type segment is divided into sewage water-removal pumps, sump pumps, and others. In 2022, the sewage water-removal pumps segment dominated the market with 45.17% and a revenue of USD 89.88 million. This growth is attributed to rapid industrialization and technological advancements, such as intelligent pump systems in the water pump industry. Additionally, sewage water-removal pumps are a type of trash pump designed for pumping out raw sewage and wastewater from residential and commercial properties. These pumps are usually installed in the basement or other areas of a home or business where wastewater collects.
Further, by 2032, the sump pumps segment will likely dominate the market due to rapid urbanization and the increasing demand for residential properties. A significant rise in infrastructural developments and global urban industrialization is also helping boost the segment’s market growth. Moreover, the sump pumps in trash pumps refer to pumps used to pump out wastewater from sump pits. They generally pump out water from flooded basements and other areas where water has accumulated. Trash pumps pump out solid waste from drainage areas, such as leaves and debris.
The material type segment is divided into cast iron body and aluminum body. In 2022, the aluminum body segment dominated the market with 56.15% and a revenue of USD 89.88 million. This growth is attributed to the rising investment in infrastructural development. Further, by 2032, the cast iron body segment will likely dominate the market due to the increasing investments by market players in deploying space heating and cooling system.
| Attribute | Description |
|---|---|
| Market Size | Revenue (USD Billion) |
| Market size value in 2022 | USD 1.90 Billion |
| Market size value in 2032 | USD 3.63 Billion |
| CAGR (2023 to 2032) | 6.70% |
| Historical data | 2019-2021 |
| Base Year | 2022 |
| Forecast | 2023-2032 |
| Regional Segments | The key regions are North America, South America, Europe, Asia Pacific, and Middle East & Africa. |
| Segments | Key Segments are application, drive type, type, material and regions |
Asia Pacific region emerged as the largest market for trash pumps.
The market's growth will be influenced by the rapid urbanization and industrialization.
The limited installation space for sump pump systems could hamper the market growth.
The technological advancements for the development of low-cost solar water pumps will provide huge opportunities to the market.
Key players Gorman-Rupp, Champion, Little Giant, Dayton Wire Wheels, Tsurumi Pump, Wacker Neuson, Northstar, Kohler, Generac, Yamaha, Stanley, Honda, Subaru, Wayne, Flotec, and among others.
1. Introduction
1.1. Objectives of the Study
1.2. Market Definition
1.3. Research Scope
1.4. Currency
1.5. Key Target Audience
2. Research Methodology and Assumptions
3. Executive Summary
4. Premium Insights
4.1. Porter’s Five Forces Analysis
4.2. Value Chain Analysis
4.3. Top Investment Pockets
4.3.1. Market Attractiveness Analysis By Application
4.3.2. Market Attractiveness Analysis By Drive Type
4.3.3. Market Attractiveness Analysis By Type
4.3.4. Market Attractiveness Analysis By Material Type
4.3.5. Market Attractiveness Analysis By Region
4.4. Industry Trends
5. Market Dynamics
5.1. Market Evaluation
5.2. Drivers
5.2.1. The rapid urbanization and industrialization
5.2.2. The rising demand for industrial pumps
5.2.3. The high population density
5.2.4. The high demand for energy-efficient pumps
5.3. Restraints
5.3.1. The limited installation space for sump pump systems
5.3.2. The growing concerns over environmental pollution and sustainability
5.4. Opportunities
5.4.1. The technological advancements for the development of low-cost solar water pumps
1. Global Trash Pumps Market Analysis and Forecast, By Application
1.1. Segment Overview
1.2. Government
1.3. Enterprise
1.4. Personal
1.5. Others
2. Global Trash Pumps Market Analysis and Forecast, By Drive Type
2.1. Segment Overview
2.2. Engine Driven
2.3. Electrically Driven
2.4. Gas Driven
3. Global Trash Pumps Market Analysis and Forecast, By Type
3.1. Segment Overview
3.2. Sewage Water-Removal Pumps
3.3. Sump Pumps
3.4. Others
4. Global Trash Pumps Market Analysis and Forecast, By Material Type
5.5. Segment Overview
5.6. Cast Iron Body
5.7. Aluminum Body
5. Global Trash Pumps Market Analysis and Forecast, By Regional Analysis
5.1. Segment Overview
5.2. North America
5.2.1. U.S.
5.2.2. Canada
5.2.3. Mexico
5.3. Europe
5.3.1. Germany
5.3.2. France
5.3.3. U.K.
5.3.4. Italy
5.3.5. Spain
5.4. Asia-Pacific
5.4.1. Japan
5.4.2. China
5.4.3. India
5.5. South America
5.5.1. Brazil
5.6. Middle East and Africa
5.6.1. UAE
5.6.2. South Africa
6. Global Trash Pumps Market-Competitive Landscape
6.1. Overview
6.2. Market Share of Key Players in Global Trash Pumps Market
6.2.1. Global Company Market Share
6.2.2. North America Company Market Share
6.2.3. Europe Company Market Share
6.2.4. APAC Company Market Share
6.3. Competitive Situations and Trends
6.3.1. Product Launches and Developments
6.3.2. Partnerships, Collaborations, and Agreements
6.3.3. Mergers & Acquisitions
6.3.4. Expansions
7. Company Profiles
7.1. Gorman-Rupp
7.1.1. Business Overview
7.1.2. Company Snapshot
7.1.3. Company Market Share Analysis
7.1.4. Company Product Portfolio
7.1.5. Recent Developments
7.1.6. SWOT Analysis
7.2. Champion
7.2.1. Business Overview
7.2.2. Company Snapshot
7.2.3. Company Market Share Analysis
7.2.4. Company Product Portfolio
7.2.5. Recent Developments
7.2.6. SWOT Analysis
7.3. Little Giant
7.3.1. Business Overview
7.3.2. Company Snapshot
7.3.3. Company Market Share Analysis
7.3.4. Company Product Portfolio
7.3.5. Recent Developments
7.3.6. SWOT Analysis
7.4. Dayton Wire Wheels
7.4.1. Business Overview
7.4.2. Company Snapshot
7.4.3. Company Market Share Analysis
7.4.4. Company Product Portfolio
7.4.5. Recent Developments
7.4.6. SWOT Analysis
7.5. Tsurumi Pump
7.5.1. Business Overview
7.5.2. Company Snapshot
7.5.3. Company Market Share Analysis
7.5.4. Company Product Portfolio
7.5.5. Recent Developments
7.5.6. SWOT Analysis
7.6. Wacker Neuson
7.6.1. Business Overview
7.6.2. Company Snapshot
7.6.3. Company Market Share Analysis
7.6.4. Company Product Portfolio
7.6.5. Recent Developments
7.6.6. SWOT Analysis
7.7. Northstar
7.7.1. Business Overview
7.7.2. Company Snapshot
7.7.3. Company Market Share Analysis
7.7.4. Company Product Portfolio
7.7.5. Recent Developments
7.7.6. SWOT Analysis
7.8. Kohler
7.8.1. Business Overview
7.8.2. Company Snapshot
7.8.3. Company Market Share Analysis
7.8.4. Company Product Portfolio
7.8.5. Recent Developments
7.8.6. SWOT Analysis
7.9. Generac
7.9.1. Business Overview
7.9.2. Company Snapshot
7.9.3. Company Market Share Analysis
7.9.4. Company Product Portfolio
7.9.5. Recent Developments
7.9.6. SWOT Analysis
7.10. Yamaha
7.10.1. Business Overview
7.10.2. Company Snapshot
7.10.3. Company Market Share Analysis
7.10.4. Company Product Portfolio
7.10.5. Recent Developments
7.10.6. SWOT Analysis
7.11. Stanley
7.11.1. Business Overview
7.11.2. Company Snapshot
7.11.3. Company Market Share Analysis
7.11.4. Company Product Portfolio
7.11.5. Recent Developments
7.11.6. SWOT Analysis
7.12. Honda
7.12.1. Business Overview
7.12.2. Company Snapshot
7.12.3. Company Market Share Analysis
7.12.4. Company Product Portfolio
7.12.5. Recent Developments
7.12.6. SWOT Analysis
7.13. Subaru
7.13.1. Business Overview
7.13.2. Company Snapshot
7.13.3. Company Market Share Analysis
7.13.4. Company Product Portfolio
7.13.5. Recent Developments
7.13.6. SWOT Analysis
7.14. Wayne
7.14.1. Business Overview
7.14.2. Company Snapshot
7.14.3. Company Market Share Analysis
7.14.4. Company Product Portfolio
7.14.5. Recent Developments
7.14.6. SWOT Analysis
7.15. Flotec
7.15.1. Business Overview
7.15.2. Company Snapshot
7.15.3. Company Market Share Analysis
7.15.4. Company Product Portfolio
7.15.5. Recent Developments
7.15.6. SWOT Analysis
List of Table
1. Global Trash Pumps Market, By Application, 2019-2032 (USD Billion)
2. Global Government, Trash Pumps Market, By Region, 2019-2032 (USD Billion)
3. Global Enterprise, Trash Pumps Market, By Region, 2019-2032 (USD Billion)
4. Global Personal, Trash Pumps Market, By Region, 2019-2032 (USD Billion)
5. Global Others, Trash Pumps Market, By Region, 2019-2032 (USD Billion)
6. Global Trash Pumps Market, By Drive Type, 2019-2032 (USD Billion)
7. Global Engine Driven, Trash Pumps Market, By Region, 2019-2032 (USD Billion)
8. Global Electrically Driven, Trash Pumps Market, By Region, 2019-2032 (USD Billion)
9. Global Gas Driven, Trash Pumps Market, By Region, 2019-2032 (USD Billion)
10. Global Trash Pumps Market, By Type, 2019-2032 (USD Billion)
11. Global Sewage Water-Removal Pumps, Trash Pumps Market, By Region, 2019-2032 (USD Billion)
12. Global Sump Pumps, Trash Pumps Market, By Region, 2019-2032 (USD Billion)
13. Global Others, Trash Pumps Market, By Region, 2019-2032 (USD Billion)
14. Global Trash Pumps Market, By Material Type, 2019-2032 (USD Billion)
15. Global Cast Iron Body, Trash Pumps Market, By Region, 2019-2032 (USD Billion)
16. Global Aluminum Body, Trash Pumps Market, By Region, 2019-2032 (USD Billion)
17. North America Trash Pumps Market, By Application, 2019-2032 (USD Billion)
18. North America Trash Pumps Market, By Drive Type, 2019-2032 (USD Billion)
19. North America Trash Pumps Market, By Type, 2019-2032 (USD Billion)
20. North America Trash Pumps Market, By Material Type, 2019-2032 (USD Billion)
21. U.S. Trash Pumps Market, By Application, 2019-2032 (USD Billion)
22. U.S. Trash Pumps Market, By Drive Type, 2019-2032 (USD Billion)
23. U.S. Trash Pumps Market, By Type, 2019-2032 (USD Billion)
24. U.S. Trash Pumps Market, By Material Type, 2019-2032 (USD Billion)
25. Canada Trash Pumps Market, By Application, 2019-2032 (USD Billion)
26. Canada Trash Pumps Market, By Drive Type, 2019-2032 (USD Billion)
27. Canada Trash Pumps Market, By Type, 2019-2032 (USD Billion)
28. Canada Trash Pumps Market, By Material Type, 2019-2032 (USD Billion)
29. Mexico Trash Pumps Market, By Application, 2019-2032 (USD Billion)
30. Mexico Trash Pumps Market, By Drive Type, 2019-2032 (USD Billion)
31. Mexico Trash Pumps Market, By Type, 2019-2032 (USD Billion)
32. Mexico Trash Pumps Market, By Material Type, 2019-2032 (USD Billion)
33. Europe Trash Pumps Market, By Application, 2019-2032 (USD Billion)
34. Europe Trash Pumps Market, By Drive Type, 2019-2032 (USD Billion)
35. Europe Trash Pumps Market, By Type, 2019-2032 (USD Billion)
36. Europe Trash Pumps Market, By Material Type, 2019-2032 (USD Billion)
37. Germany Trash Pumps Market, By Application, 2019-2032 (USD Billion)
38. Germany Trash Pumps Market, By Drive Type, 2019-2032 (USD Billion)
39. Germany Trash Pumps Market, By Type, 2019-2032 (USD Billion)
40. Germany Trash Pumps Market, By Material Type, 2019-2032 (USD Billion)
41. France Trash Pumps Market, By Application, 2019-2032 (USD Billion)
42. France Trash Pumps Market, By Drive Type, 2019-2032 (USD Billion)
43. France Trash Pumps Market, By Type, 2019-2032 (USD Billion)
44. France Trash Pumps Market, By Material Type, 2019-2032 (USD Billion)
45. U.K. Trash Pumps Market, By Application, 2019-2032 (USD Billion)
46. U.K. Trash Pumps Market, By Drive Type, 2019-2032 (USD Billion)
47. U.K. Trash Pumps Market, By Type, 2019-2032 (USD Billion)
48. U.K. Trash Pumps Market, By Material Type, 2019-2032 (USD Billion)
49. Italy Trash Pumps Market, By Application, 2019-2032 (USD Billion)
50. Italy Trash Pumps Market, By Drive Type, 2019-2032 (USD Billion)
51. Italy Trash Pumps Market, By Type, 2019-2032 (USD Billion)
52. Italy Trash Pumps Market, By Material Type, 2019-2032 (USD Billion)
53. Spain Trash Pumps Market, By Application, 2019-2032 (USD Billion)
54. Spain Trash Pumps Market, By Drive Type, 2019-2032 (USD Billion)
55. Spain Trash Pumps Market, By Type, 2019-2032 (USD Billion)
56. Spain Trash Pumps Market, By Material Type, 2019-2032 (USD Billion)
57. Asia Pacific Trash Pumps Market, By Application, 2019-2032 (USD Billion)
58. Asia Pacific Trash Pumps Market, By Drive Type, 2019-2032 (USD Billion)
59. Asia Pacific Trash Pumps Market, By Type, 2019-2032 (USD Billion)
60. Asia Pacific Trash Pumps Market, By Material Type, 2019-2032 (USD Billion)
61. Japan Trash Pumps Market, By Application, 2019-2032 (USD Billion)
62. Japan Trash Pumps Market, By Drive Type, 2019-2032 (USD Billion)
63. Japan Trash Pumps Market, By Type, 2019-2032 (USD Billion)
64. Japan Trash Pumps Market, By Material Type, 2019-2032 (USD Billion)
65. China Trash Pumps Market, By Application, 2019-2032 (USD Billion)
66. China Trash Pumps Market, By Drive Type, 2019-2032 (USD Billion)
67. China Trash Pumps Market, By Type, 2019-2032 (USD Billion)
68. China Trash Pumps Market, By Material Type, 2019-2032 (USD Billion)
69. India Trash Pumps Market, By Application, 2019-2032 (USD Billion)
70. India Trash Pumps Market, By Drive Type, 2019-2032 (USD Billion)
71. India Trash Pumps Market, By Type, 2019-2032 (USD Billion)
72. India Trash Pumps Market, By Material Type, 2019-2032 (USD Billion)
73. South America Trash Pumps Market, By Application, 2019-2032 (USD Billion)
74. South America Trash Pumps Market, By Drive Type, 2019-2032 (USD Billion)
75. South America Trash Pumps Market, By Type, 2019-2032 (USD Billion)
76. South America Trash Pumps Market, By Material Type, 2019-2032 (USD Billion)
77. Brazil Trash Pumps Market, By Application, 2019-2032 (USD Billion)
78. Brazil Trash Pumps Market, By Drive Type, 2019-2032 (USD Billion)
79. Brazil Trash Pumps Market, By Type, 2019-2032 (USD Billion)
80. Brazil Trash Pumps Market, By Material Type, 2019-2032 (USD Billion)
81. Middle East and Africa Trash Pumps Market, By Application, 2019-2032 (USD Billion)
82. Middle East and Africa Trash Pumps Market, By Drive Type, 2019-2032 (USD Billion)
83. Middle East and Africa Trash Pumps Market, By Type, 2019-2032 (USD Billion)
84. Middle East and Africa Trash Pumps Market, By Material Type, 2019-2032 (USD Billion)
85. UAE Trash Pumps Market, By Application, 2019-2032 (USD Billion)
86. UAE Trash Pumps Market, By Drive Type, 2019-2032 (USD Billion)
87. UAE Trash Pumps Market, By Type, 2019-2032 (USD Billion)
88. UAE Trash Pumps Market, By Material Type, 2019-2032 (USD Billion)
89. South Africa Trash Pumps Market, By Application, 2019-2032 (USD Billion)
90. South Africa Trash Pumps Market, By Drive Type, 2019-2032 (USD Billion)
91. South Africa Trash Pumps Market, By Type, 2019-2032 (USD Billion)
92. South Africa Trash Pumps Market, By Material Type, 2019-2032 (USD Billion)
List of Figures
1. Global Trash Pumps Market Segmentation
2. Global Trash Pumps Market: Research Methodology
3. Market Size Estimation Methodology: Bottom-Up Approach
4. Market Size Estimation Methodology: Top-Down Approach
5. Data Triangulation
6. Porter’s Five Forces Analysis
7. Value Chain Analysis
8. Global Trash Pumps Market Attractiveness Analysis By Application
9. Global Trash Pumps Market Attractiveness Analysis By Drive Type
10. Global Trash Pumps Market Attractiveness Analysis By Type
11. Global Trash Pumps Market Attractiveness Analysis By Material Type
12. Global Trash Pumps Market Attractiveness Analysis By Region
13. Global Trash Pumps Market: Dynamics
14. Global Trash Pumps Market Share By Application (2023 & 2032)
15. Global Trash Pumps Market Share By Drive Type (2023 & 2032)
16. Global Trash Pumps Market Share By Type (2023 & 2032)
17. Global Trash Pumps Market Share By Material Type (2023 & 2032)
18. Global Trash Pumps Market Share By Regions (2023 & 2032)
19. Global Trash Pumps Market Share By Company (2022)
This study forecasts revenue at global, regional, and country levels from 2019 to 2032. The Brainy Insights has segmented the global Trash Pumps based on below mentioned segments:
Global Trash Pumps Market by Application:
Global Trash Pumps Market by Drive Type:
Global Trash Pumps Market by Type:
Global Trash Pumps Market by Material Type:
Global Trash Pumps by Region:
Research has its special purpose to undertake marketing efficiently. In this competitive scenario, businesses need information across all industry verticals; the information about customer wants, market demand, competition, industry trends, distribution channels etc. This information needs to be updated regularly because businesses operate in a dynamic environment. Our organization, The Brainy Insights incorporates scientific and systematic research procedures in order to get proper market insights and industry analysis for overall business success. The analysis consists of studying the market from a miniscule level wherein we implement statistical tools which helps us in examining the data with accuracy and precision.
Our research reports feature both; quantitative and qualitative aspects for any market. Qualitative information for any market research process are fundamental because they reveal the customer needs and wants, usage and consumption for any product/service related to a specific industry. This in turn aids the marketers/investors in knowing certain perceptions of the customers. Qualitative research can enlighten about the different product concepts and designs along with unique service offering that in turn, helps define marketing problems and generate opportunities. On the other hand, quantitative research engages with the data collection process through interviews, e-mail interactions, surveys and pilot studies. Quantitative aspects for the market research are useful to validate the hypotheses generated during qualitative research method, explore empirical patterns in the data with the help of statistical tools, and finally make the market estimations.
The Brainy Insights offers comprehensive research and analysis, based on a wide assortment of factual insights gained through interviews with CXOs and global experts and secondary data from reliable sources. Our analysts and industry specialist assume vital roles in building up statistical tools and analysis models, which are used to analyse the data and arrive at accurate insights with exceedingly informative research discoveries. The data provided by our organization have proven precious to a diverse range of companies, facilitating them to address issues such as determining which products/services are the most appealing, whether or not customers use the product in the manner anticipated, the purchasing intentions of the market and many others.
Our research methodology encompasses an idyllic combination of primary and secondary initiatives. Key phases involved in this process are listed below:

The phase involves the gathering and collecting of market data and its related information with the help of different sources & research procedures.

The data procurement stage involves in data gathering and collecting through various data sources.
This stage involves in extensive research. These data sources includes:
Purchased Database: Purchased databases play a crucial role in estimating the market sizes irrespective of the domain. Our purchased database includes:
Primary Research: The Brainy Insights interacts with leading companies and experts of the concerned domain to develop the analyst team’s market understanding and expertise. It improves and substantiates every single data presented in the market reports. Primary research mainly involves in telephonic interviews, E-mail interactions and face-to-face interviews with the raw material providers, manufacturers/producers, distributors, & independent consultants. The interviews that we conduct provides valuable data on market size and industry growth trends prevailing in the market. Our organization also conducts surveys with the various industry experts in order to gain overall insights of the industry/market. For instance, in healthcare industry we conduct surveys with the pharmacists, doctors, surgeons and nurses in order to gain insights and key information of a medical product/device/equipment which the customers are going to usage. Surveys are conducted in the form of questionnaire designed by our own analyst team. Surveys plays an important role in primary research because surveys helps us to identify the key target audiences of the market. Additionally, surveys helps to identify the key target audience engaged with the market. Our survey team conducts the survey by targeting the key audience, thus gaining insights from them. Based on the perspectives of the customers, this information is utilized to formulate market strategies. Moreover, market surveys helps us to understand the current competitive situation of the industry. To be precise, our survey process typically involve with the 360 analysis of the market. This analytical process begins by identifying the prospective customers for a product or service related to the market/industry to obtain data on how a product/service could fit into customers’ lives.

Secondary Research: The secondary data sources includes information published by the on-profit organizations such as World bank, WHO, company fillings, investor presentations, annual reports, national government documents, statistical databases, blogs, articles, white papers and others. From the annual report, we analyse a company’s revenue to understand the key segment and market share of that organization in a particular region. We analyse the company websites and adopt the product mapping technique which is important for deriving the segment revenue. In the product mapping method, we select and categorize the products offered by the companies catering to domain specific market, deduce the product revenue for each of the companies so as to get overall estimation of the market size. We also source data and analyses trends based on information received from supply side and demand side intermediaries in the value chain. The supply side denotes the data gathered from supplier, distributor, wholesaler and the demand side illustrates the data gathered from the end customers for respective market domain.

The supply side for a domain specific market is analysed by:
The demand side for the market is estimated through:
In-house Library: Apart from these third-party sources, we have our in-house library of qualitative and quantitative information. Our in-house database includes market data for various industry and domains. These data are updated on regular basis as per the changing market scenario. Our library includes, historic databases, internal audit reports and archives.
Sometimes there are instances where there is no metadata or raw data available for any domain specific market. For those cases, we use our expertise to forecast and estimate the market size in order to generate comprehensive data sets. Our analyst team adopt a robust research technique in order to produce the estimates:
Data Synthesis: This stage involves the analysis & mapping of all the information obtained from the previous step. It also involves in scrutinizing the data for any discrepancy observed while data gathering related to the market. The data is collected with consideration to the heterogeneity of sources. Robust scientific techniques are in place for synthesizing disparate data sets and provide the essential contextual information that can orient market strategies. The Brainy Insights has extensive experience in data synthesis where the data passes through various stages:


Market Deduction & Formulation: The final stage comprises of assigning data points at appropriate market spaces so as to deduce feasible conclusions. Analyst perspective & subject matter expert based holistic form of market sizing coupled with industry analysis also plays a crucial role in this stage.
This stage involves in finalization of the market size and numbers that we have collected from data integration step. With data interpolation, it is made sure that there is no gap in the market data. Successful trend analysis is done by our analysts using extrapolation techniques, which provide the best possible forecasts for the market.
Data Validation & Market Feedback: Validation is the most important step in the process. Validation & re-validation via an intricately designed process helps us finalize data-points to be used for final calculations.

The Brainy Insights interacts with leading companies and experts of the concerned domain to develop the analyst team’s market understanding and expertise. It improves and substantiates every single data presented in the market reports. The data validation interview and discussion panels are typically composed of the most experienced industry members. The participants include, however, are not limited to:
Moreover, we always validate our data and findings through primary respondents from all the major regions we are working on.


Free Customization
Fortune 500 Clients
Free Yearly Update On Purchase Of Multi/Corporate License
Companies Served Till Date