- +1-315-215-1633
- sales@thebrainyinsights.com

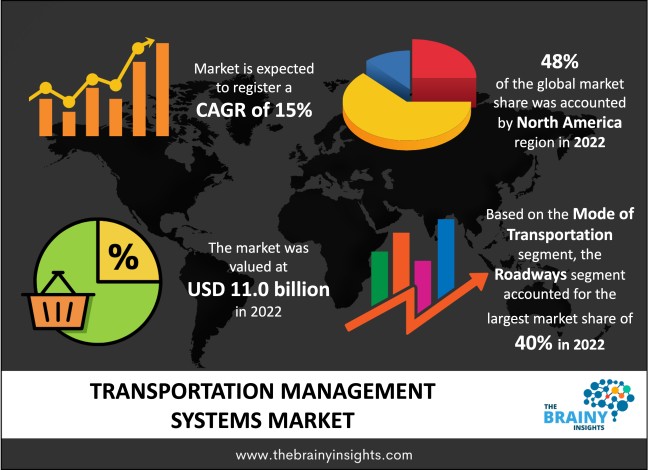
The global transportation management systems market was valued at USD 11.0 billion in 2022, growing at a CAGR of 15% from 2023 to 2032. The market is expected to reach USD 44.5 billion by 2032. The expansion of the retail and e-commerce sectors, the constant technological innovation that frequently results in the introduction of novel solutions, and the improvement of bilateral trade ties between various countries are the key drivers of the global transportation management systems market.
A transportation management system (TMS) platform is created to make the supply chain's transportation operation more efficient. From the time an order is placed until it is delivered, it deals with organizing, managing, and handling everything linked to the transportation of goods. The TMS platform's popularity is steadily rising. According to recent surveys, nearly 35% of organizations now use the platform to manage their transport network. Given the growing complexity of logistics and transportation, it is impossible to overstate the importance of transportation management systems as the organization expands. Technical advancements in TMS allow for better transactional and communication systems, make decisions more quickly, enable users to use massive real-time data and plan and strategize for the best transportation solutions. In addition, several important system manufacturers temporarily suspended operations as a result of disruptions in the component supply, which ultimately slowed down the adoption of transportation management systems (TMS) solutions. On the other hand, the transport management systems that are already in place around the world are being used extensively. The potential for TMS solutions to be employed in the future is also substantially expanded by the inescapable use of technology in disaster assistance and the growing significance of data-driven solutions in the transportation and logistics industry to lessen the extreme impacts of the pandemic. TMS helps market leaders in a number of business verticals reduce overall costs, boost shipment effectiveness, provide real-time supply chain data, and enhance customer service.
Get an overview of this study by requesting a free sample
In March 2022, A cooperation to change supply chain management's access to diverse data sources was announced by the data cloud company Snowflake and the provider of digital supply chain and omnichannel commerce fulfilment Blue Yonder.
In February 2020, Eaton acquired Power Distribution, a US-based supplier of mission-critical power distribution, static switching, and power monitoring tools and services for data centres, businesses, and industrial clients.
February 2022: To support its expansion and technological modernization, the largest supplier of refractory products globally, RHI Magnesita, selected Oracle Fusion Cloud Transportation Management, a part of Oracle Fusion Cloud Supply Chain & Manufacturing (SCM). After the deployment, a single, integrated transport management system is used by all of RHI Magnesita's shipping facilities for all logistical operations.
Rising Popularity- The urge for greater agility in transportation and logistics operations is driven by digital transformation, enabling businesses to offer better customer experiences. Many businesses are implementing emerging technologies in the digital transformation movement, opening up previously unimaginable opportunities for operational efficiency, sustainability, new business models, and a more comprehensive customer experience. Transportation operations are enhanced by digitalization, the Internet of Things (IoT), Artificial Intelligence (AI), and their predictive capabilities. Back-office automation, predictive operations, intelligent transportation equipment, and creative customer experience models, for instance, have all been made possible by AI. New technologies are entirely digitizing the management of orders, contracts, deliveries, and payments, revolutionizing the transportation industry.
Data Misuse- The hazards of data misuse and theft are rising as shippers, forwarders, transportation companies, and infrastructure owners digitize procedures. The study found that by 2025, the logistics sector might have lost $7 billion in income. Private information held by businesses must be safeguarded to prevent data breaches and theft, which can harm a company's financial stability. TMS systems are costly because they require automation tools, programmes, and hardware. Due to costly investment, TMS implementation could be higher in several emerging nations, which is considered a market growth constraint.
Growing Significance- The adoption rate of modern TMS solutions has also been influenced by the growing significance of anti-theft GPS, cloud-based, and IoT-enabled technologies for bringing security and transparency to the logistics industry. For instance, Oracle Corp. announced in February 2022 the addition of new logistics management tools to Oracle Fusion Cloud Supply Chain & Manufacturing (SCM) to assist organisations in maximising value and enhancing efficiency throughout their global supply chains. Oracle Fusion Cloud Global Trade Management and Oracle Fusion Cloud Transportation Management have been improved in order to assist businesses in lowering costs, lowering risks, raising customer happiness, and strengthening their ability to adapt to market changes.
The regions analyzed for the market include North America, Europe, South America, Asia Pacific, the Middle East, and Africa. North America emerged as the most significant global transportation management systems market, with a 48% market revenue share in 2022.
Due to the high number of participants and industry columns, North America commands the global transport management systems market. The TMS industry is one of the important sectors in the North American economy. The U.S. and Canada are working together to gain a more significant piece of the traffic management systems market. In addition, the market for transport management systems is expected to develop quickest in Canada. Expectations for a more robust transport management system have increased as North American nations become more competitive and consumer-oriented. Since the transportation industry primarily depends on transportation professionals to meet their financial objectives, customer delivery promises, and profit margins, it plays a significant role in the supply chain.
Descartes Systems Group, the industry leader in uniting logistically demanding businesses in commerce, said in June 2022 that it had acquired XPS Technologies, a provider of multi-carrier parcel shipping solutions for e-commerce. With this acquisition, all e-commerce shippers will have direct access to XPS' cloud-based multi-carrier package shipping capabilities regardless of size.
North America Region Transportation Management Systems Market Share in 2023 - 48%
www.thebrainyinsights.com
Check the geographical analysis of this market by requesting a free sample
The deployment segment is divided into on-premise and cloud. The on-premise segment dominated the market, with a market share of around 54.9% in 2022. Because of the demands for data security, easy access to the server, and greater customization flexibility, several sizable manufacturing and distribution organizations continue to favour on-premise TMS. Nevertheless, incumbents from various industries are anticipated to switch to cloud-based TMS over the forecast period as knowledge of its advantages continues to grow.
The mode of transportation segment is divided into roadways, railways, waterways and airways. The roadways segment dominated the market, with a market share of around 40% in 2022. One of the most popular ways of transportation worldwide is the road. Supporting loading and unloading at any location makes it versatile and cost-effective. Additionally, businesses had to improve their delivery alternatives in the roads category due to consumers' increased reliance on e-commerce during the COVID-19 epidemic.
The end-user segment is divided into retail & e-commerce, manufacturing, logistics, government organizations and others. The manufacturing segment dominated, with a market share of around 38% in 2022. The requirement for outsourcing inventory and raw materials has expanded due to the rising number of manufacturing facilities in developing nations like Mexico and India. For instance, the 'Make in India' effort of the Indian government greatly emphasizes the growth of the home manufacturing sector and may even stimulate indigenous production. Such activities encourage the manufacturing segment's growth during the projection period.
| Attribute | Description |
|---|---|
| Market Size | Revenue (USD Billion) |
| Market size value in 2022 | USD 11.0 Billion |
| Market size value in 2032 | USD 44.5 Billion |
| CAGR (2023 to 2032) | 15% |
| Historical data | 2019-2021 |
| Base Year | 2022 |
| Forecast | 2023-2032 |
| Region | The regions analyzed for the market are Asia Pacific, Europe, South America, North America, and Middle East & Africa. Furthermore, the regions are further analyzed at the country level. |
| Segments | Deployment, Mode of Transportation, End-User |
As per The Brainy Insights, the size of the transportation management systems market was valued at USD 11.0 billion in 2022 to USD 44.5 billion by 2032.
The global transportation management systems market is growing at a CAGR of 15% during the forecast period 2023-2032.
North America emerged as the largest transportation management systems market.
1. Introduction
1.1. Objectives of the Study
1.2. Market Definition
1.3. Research Scope
1.4. Currency
1.5. Key Target Audience
2. Research Methodology and Assumptions
3. Executive Summary
4. Premium Insights
4.1. Porter’s Five Forces Analysis
4.2. Value Chain Analysis
4.3. Top Investment Pockets
4.3.1. Market Attractiveness Analysis by Deployment
4.3.2. Market Attractiveness Analysis by Mode Of Transportation
4.3.3. Market Attractiveness Analysis by End-User
4.3.4. Market Attractiveness Analysis by Region
4.4. Industry Trends
5. Market Dynamics
5.1. Market Evaluation
5.2. Drivers
5.2.1. Rising Popularity
5.3. Restraints
5.3.1. Data Misuse
5.4. Opportunities
5.4.1. Growing Significance
5.5. Challenges
5.5.1. Slow Adoption
6. Global Transportation Management Systems Market Analysis and Forecast, By Deployment
6.1. Segment Overview
6.2. On-premise
6.3. Cloud
7. Global Transportation Management Systems Market Analysis and Forecast, By Mode Of Transportation
7.1. Segment Overview
7.2. Roadways
7.3. Railways
7.4. Waterways
7.5. Airways
8. Global Transportation Management Systems Market Analysis and Forecast, By End-User
8.1. Segment Overview
8.2. Retail & E-commerce
8.3. Manufacturing
8.4. Logistics
8.5. Government Organizations
8.6. Others
9. Global Transportation Management Systems Market Analysis and Forecast, By Regional Analysis
9.1. Segment Overview
9.2. North America
9.2.1. U.S.
9.2.2. Canada
9.2.3. Mexico
9.3. Europe
9.3.1. Germany
9.3.2. France
9.3.3. U.K.
9.3.4. Italy
9.3.5. Spain
9.4. Asia-Pacific
9.4.1. Japan
9.4.2. China
9.4.3. India
9.5. South America
9.5.1. Brazil
9.6. Middle East and Africa
9.6.1. UAE
9.6.2. South Africa
10. Global Transportation Management Systems Market-Competitive Landscape
10.1. Overview
10.2. Market Share of Key Players in Global Transportation Management Systems Market
10.2.1. Global Company Market Share
10.2.2. North America Company Market Share
10.2.3. Europe Company Market Share
10.2.4. APAC Company Market Share
10.3. Competitive Situations and Trends
10.3.1. Product Launches and Developments
10.3.2. Partnerships, Collaborations, and Agreements
10.3.3. Mergers & Acquisitions
10.3.4. Expansions
11. Company Profiles
11.1. 3GTMS
11.1.1. Business Overview
11.1.2. Company Snapshot
11.1.3. Company Market Share Analysis
11.1.4. Company Product Portfolio
11.1.5. Recent Developments
11.1.6. SWOT Analysis
11.2. BluJay Solutions Ltd.
11.2.1. Business Overview
11.2.2. Company Snapshot
11.2.3. Company Market Share Analysis
11.2.4. Company Product Portfolio
11.2.5. Recent Developments
11.2.6. SWOT Analysis
11.3. C.H. Robinson Worldwide, Inc.
11.3.1. Business Overview
11.3.2. Company Snapshot
11.3.3. Company Market Share Analysis
11.3.4. Company Product Portfolio
11.3.5. Recent Developments
11.3.6. SWOT Analysis
11.4. Cerasis, Inc.
11.4.1. Business Overview
11.4.2. Company Snapshot
11.4.3. Company Market Share Analysis
11.4.4. Company Product Portfolio
11.4.5. Recent Developments
11.4.6. SWOT Analysis
11.5. Inet-logistics GmbH
11.5.1. Business Overview
11.5.2. Company Snapshot
11.5.3. Company Market Share Analysis
11.5.4. Company Product Portfolio
11.5.5. Recent Developments
11.5.6. SWOT Analysis
11.6. Infor Inc.
11.6.1. Business Overview
11.6.2. Company Snapshot
11.6.3. Company Market Share Analysis
11.6.4. Company Product Portfolio
11.6.5. Recent Developments
11.6.6. SWOT Analysis
11.7. International Business Machines Corp.
11.7.1. Business Overview
11.7.2. Company Snapshot
11.7.3. Company Market Share Analysis
11.7.4. Company Product Portfolio
11.7.5. Recent Developments
11.7.6. SWOT Analysis
11.8. JDA Software Group, Inc.
11.8.1. Business Overview
11.8.2. Company Snapshot
11.8.3. Company Market Share Analysis
11.8.4. Company Product Portfolio
11.8.5. Recent Developments
11.8.6. SWOT Analysis
11.9. Manhattan Associates
11.9.1. Business Overview
11.9.2. Company Snapshot
11.9.3. Company Market Share Analysis
11.9.4. Company Product Portfolio
11.9.5. Recent Developments
11.9.6. SWOT Analysis
11.10. MercuryGate International, Inc.
11.10.1. Business Overview
11.10.2. Company Snapshot
11.10.3. Company Market Share Analysis
11.10.4. Company Product Portfolio
11.10.5. Recent Developments
11.10.6. SWOT Analysis
11.11. Oracle Corp.
11.11.1. Business Overview
11.11.2. Company Snapshot
11.11.3. Company Market Share Analysis
11.11.4. Company Product Portfolio
11.11.5. Recent Developments
11.11.6. SWOT Analysis
List of Table
1. Global Transportation Management Systems Market, By Deployment, 2019-2032 (USD Billion)
2. Global On-premise, Transportation Management Systems Market, By Region, 2019-2032 (USD Billion)
3. Global Cloud, Transportation Management Systems Market, By Region, 2019-2032 (USD Billion)
4. Global Transportation Management Systems Market, By Mode Of Transportation, 2019-2032 (USD Billion)
5. Global Roadways, Transportation Management Systems Market, By Region, 2019-2032 (USD Billion)
6. Global Railways, Transportation Management Systems Market, By Region, 2019-2032 (USD Billion)
7. Global Waterways, Transportation Management Systems Market, By Region, 2019-2032 (USD Billion)
8. Global Airways, Transportation Management Systems Market, By Region, 2019-2032 (USD Billion)
9. Global Transportation Management Systems Market, By End-User, 2019-2032 (USD Billion)
10. Global Retail & E-commerce, Transportation Management Systems Market, By Region, 2019-2032 (USD Billion)
11. Global Manufacturing, Transportation Management Systems Market, By Region, 2019-2032 (USD Billion)
12. Global Logistics, Transportation Management Systems Market, By Region, 2019-2032 (USD Billion)
13. Global Government Organizations, Transportation Management Systems Market, By Region, 2019-2032 (USD Billion)
14. Global Others, Transportation Management Systems Market, By Region, 2019-2032 (USD Billion)
15. North America Transportation Management Systems Market, By Deployment, 2019-2032 (USD Billion)
16. North America Transportation Management Systems Market, By Mode Of Transportation, 2019-2032 (USD Billion)
17. North America Transportation Management Systems Market, By End-User, 2019-2032 (USD Billion)
18. U.S. Transportation Management Systems Market, By Deployment, 2019-2032 (USD Billion)
19. U.S. Transportation Management Systems Market, By Mode Of Transportation, 2019-2032 (USD Billion)
20. U.S. Transportation Management Systems Market, By End-User, 2019-2032 (USD Billion)
21. Canada Transportation Management Systems Market, By Deployment, 2019-2032 (USD Billion)
22. Canada Transportation Management Systems Market, By Mode Of Transportation, 2019-2032 (USD Billion)
23. Canada Transportation Management Systems Market, By End-User, 2019-2032 (USD Billion)
24. Mexico Transportation Management Systems Market, By Deployment, 2019-2032 (USD Billion)
25. Mexico Transportation Management Systems Market, By Mode Of Transportation, 2019-2032 (USD Billion)
26. Mexico Transportation Management Systems Market, By End-User, 2019-2032 (USD Billion)
27. Europe Transportation Management Systems Market, By Deployment, 2019-2032 (USD Billion)
28. Europe Transportation Management Systems Market, By Mode Of Transportation, 2019-2032 (USD Billion)
29. Europe Transportation Management Systems Market, By End-User, 2019-2032 (USD Billion)
30. Germany Transportation Management Systems Market, By Deployment, 2019-2032 (USD Billion)
31. Germany Transportation Management Systems Market, By Mode Of Transportation, 2019-2032 (USD Billion)
32. Germany Transportation Management Systems Market, By End-User, 2019-2032 (USD Billion)
33. France Transportation Management Systems Market, By Deployment, 2019-2032 (USD Billion)
34. France Transportation Management Systems Market, By Mode Of Transportation, 2019-2032 (USD Billion)
35. France Transportation Management Systems Market, By End-User, 2019-2032 (USD Billion)
36. U.K. Transportation Management Systems Market, By Deployment, 2019-2032 (USD Billion)
37. U.K. Transportation Management Systems Market, By Mode Of Transportation, 2019-2032 (USD Billion)
38. U.K. Transportation Management Systems Market, By End-User, 2019-2032 (USD Billion)
39. Italy Transportation Management Systems Market, By Deployment, 2019-2032 (USD Billion)
40. Italy Transportation Management Systems Market, By Mode Of Transportation, 2019-2032 (USD Billion)
41. Italy Transportation Management Systems Market, By End-User, 2019-2032 (USD Billion)
42. Spain Transportation Management Systems Market, By Deployment, 2019-2032 (USD Billion)
43. Spain Transportation Management Systems Market, By Mode Of Transportation, 2019-2032 (USD Billion)
44. Spain Transportation Management Systems Market, By End-User, 2019-2032 (USD Billion)
45. Asia Pacific Transportation Management Systems Market, By Deployment, 2019-2032 (USD Billion)
46. Asia Pacific Transportation Management Systems Market, By Mode Of Transportation, 2019-2032 (USD Billion)
47. Asia Pacific Transportation Management Systems Market, By End-User, 2019-2032 (USD Billion)
48. Japan Transportation Management Systems Market, By Deployment, 2019-2032 (USD Billion)
49. Japan Transportation Management Systems Market, By Mode Of Transportation, 2019-2032 (USD Billion)
50. Japan Transportation Management Systems Market, By End-User, 2019-2032 (USD Billion)
51. China Transportation Management Systems Market, By Deployment, 2019-2032 (USD Billion)
52. China Transportation Management Systems Market, By Mode Of Transportation, 2019-2032 (USD Billion)
53. China Transportation Management Systems Market, By End-User, 2019-2032 (USD Billion)
54. India Transportation Management Systems Market, By Deployment, 2019-2032 (USD Billion)
55. India Transportation Management Systems Market, By Mode Of Transportation, 2019-2032 (USD Billion)
56. India Transportation Management Systems Market, By End-User, 2019-2032 (USD Billion)
57. South America Transportation Management Systems Market, By Deployment, 2019-2032 (USD Billion)
58. South America Transportation Management Systems Market, By Mode Of Transportation, 2019-2032 (USD Billion)
59. South America Transportation Management Systems Market, By End-User, 2019-2032 (USD Billion)
60. Brazil Transportation Management Systems Market, By Deployment, 2019-2032 (USD Billion)
61. Brazil Transportation Management Systems Market, By Mode Of Transportation, 2019-2032 (USD Billion)
62. Brazil Transportation Management Systems Market, By End-User, 2019-2032 (USD Billion)
63. Middle East and Africa Transportation Management Systems Market, By Deployment, 2019-2032 (USD Billion)
64. Middle East and Africa Transportation Management Systems Market, By Mode Of Transportation, 2019-2032 (USD Billion)
65. Middle East and Africa Transportation Management Systems Market, By End-User, 2019-2032 (USD Billion)
66. UAE Transportation Management Systems Market, By Deployment, 2019-2032 (USD Billion)
67. UAE Transportation Management Systems Market, By Mode Of Transportation, 2019-2032 (USD Billion)
68. UAE Transportation Management Systems Market, By End-User, 2019-2032 (USD Billion)
69. South Africa Transportation Management Systems Market, By Deployment, 2019-2032 (USD Billion)
70. South Africa Transportation Management Systems Market, By Mode Of Transportation, 2019-2032 (USD Billion)
71. South Africa Transportation Management Systems Market, By End-User, 2019-2032 (USD Billion)
List of Figures
1. Global Transportation Management Systems Market Segmentation
2. Global Transportation Management Systems Market: Research Methodology
3. Market Size Estimation Methodology: Bottom-Up Approach
4. Market Size Estimation Methodology: Top-Down Approach
5. Data Triangulation
6. Porter’s Five Forces Analysis
7. Value Chain Analysis
8. Global Transportation Management Systems Market Attractiveness Analysis by Deployment
9. Global Transportation Management Systems Market Attractiveness Analysis by Mode Of Transportation
10. Global Transportation Management Systems Market Attractiveness Analysis by End-User
11. Global Transportation Management Systems Market Attractiveness Analysis by Region
12. Global Transportation Management Systems Market: Dynamics
13. Global Transportation Management Systems Market Share by Deployment (2023 & 2032)
14. Global Transportation Management Systems Market Share by Mode Of Transportation (2023 & 2032)
15. Global Transportation Management Systems Market Share by End-User (2023 & 2032)
16. Global Transportation Management Systems Market Share by Regions (2023 & 2032)
17. Global Transportation Management Systems Market Share by Company (2022)
This study forecasts global, regional, and country revenue from 2019 to 2032. The Brainy Insights has segmented the global transportation management systems market based on the below-mentioned segments:
Global Transportation Management Systems Market By Deployment:
Global Transportation Management Systems Market By Mode Of Transportation:
Global Transportation Management Systems Market By End-User:
Global Transportation Management Systems Market By Region:
Research has its special purpose to undertake marketing efficiently. In this competitive scenario, businesses need information across all industry verticals; the information about customer wants, market demand, competition, industry trends, distribution channels etc. This information needs to be updated regularly because businesses operate in a dynamic environment. Our organization, The Brainy Insights incorporates scientific and systematic research procedures in order to get proper market insights and industry analysis for overall business success. The analysis consists of studying the market from a miniscule level wherein we implement statistical tools which helps us in examining the data with accuracy and precision.
Our research reports feature both; quantitative and qualitative aspects for any market. Qualitative information for any market research process are fundamental because they reveal the customer needs and wants, usage and consumption for any product/service related to a specific industry. This in turn aids the marketers/investors in knowing certain perceptions of the customers. Qualitative research can enlighten about the different product concepts and designs along with unique service offering that in turn, helps define marketing problems and generate opportunities. On the other hand, quantitative research engages with the data collection process through interviews, e-mail interactions, surveys and pilot studies. Quantitative aspects for the market research are useful to validate the hypotheses generated during qualitative research method, explore empirical patterns in the data with the help of statistical tools, and finally make the market estimations.
The Brainy Insights offers comprehensive research and analysis, based on a wide assortment of factual insights gained through interviews with CXOs and global experts and secondary data from reliable sources. Our analysts and industry specialist assume vital roles in building up statistical tools and analysis models, which are used to analyse the data and arrive at accurate insights with exceedingly informative research discoveries. The data provided by our organization have proven precious to a diverse range of companies, facilitating them to address issues such as determining which products/services are the most appealing, whether or not customers use the product in the manner anticipated, the purchasing intentions of the market and many others.
Our research methodology encompasses an idyllic combination of primary and secondary initiatives. Key phases involved in this process are listed below:

The phase involves the gathering and collecting of market data and its related information with the help of different sources & research procedures.

The data procurement stage involves in data gathering and collecting through various data sources.
This stage involves in extensive research. These data sources includes:
Purchased Database: Purchased databases play a crucial role in estimating the market sizes irrespective of the domain. Our purchased database includes:
Primary Research: The Brainy Insights interacts with leading companies and experts of the concerned domain to develop the analyst team’s market understanding and expertise. It improves and substantiates every single data presented in the market reports. Primary research mainly involves in telephonic interviews, E-mail interactions and face-to-face interviews with the raw material providers, manufacturers/producers, distributors, & independent consultants. The interviews that we conduct provides valuable data on market size and industry growth trends prevailing in the market. Our organization also conducts surveys with the various industry experts in order to gain overall insights of the industry/market. For instance, in healthcare industry we conduct surveys with the pharmacists, doctors, surgeons and nurses in order to gain insights and key information of a medical product/device/equipment which the customers are going to usage. Surveys are conducted in the form of questionnaire designed by our own analyst team. Surveys plays an important role in primary research because surveys helps us to identify the key target audiences of the market. Additionally, surveys helps to identify the key target audience engaged with the market. Our survey team conducts the survey by targeting the key audience, thus gaining insights from them. Based on the perspectives of the customers, this information is utilized to formulate market strategies. Moreover, market surveys helps us to understand the current competitive situation of the industry. To be precise, our survey process typically involve with the 360 analysis of the market. This analytical process begins by identifying the prospective customers for a product or service related to the market/industry to obtain data on how a product/service could fit into customers’ lives.

Secondary Research: The secondary data sources includes information published by the on-profit organizations such as World bank, WHO, company fillings, investor presentations, annual reports, national government documents, statistical databases, blogs, articles, white papers and others. From the annual report, we analyse a company’s revenue to understand the key segment and market share of that organization in a particular region. We analyse the company websites and adopt the product mapping technique which is important for deriving the segment revenue. In the product mapping method, we select and categorize the products offered by the companies catering to domain specific market, deduce the product revenue for each of the companies so as to get overall estimation of the market size. We also source data and analyses trends based on information received from supply side and demand side intermediaries in the value chain. The supply side denotes the data gathered from supplier, distributor, wholesaler and the demand side illustrates the data gathered from the end customers for respective market domain.

The supply side for a domain specific market is analysed by:
The demand side for the market is estimated through:
In-house Library: Apart from these third-party sources, we have our in-house library of qualitative and quantitative information. Our in-house database includes market data for various industry and domains. These data are updated on regular basis as per the changing market scenario. Our library includes, historic databases, internal audit reports and archives.
Sometimes there are instances where there is no metadata or raw data available for any domain specific market. For those cases, we use our expertise to forecast and estimate the market size in order to generate comprehensive data sets. Our analyst team adopt a robust research technique in order to produce the estimates:
Data Synthesis: This stage involves the analysis & mapping of all the information obtained from the previous step. It also involves in scrutinizing the data for any discrepancy observed while data gathering related to the market. The data is collected with consideration to the heterogeneity of sources. Robust scientific techniques are in place for synthesizing disparate data sets and provide the essential contextual information that can orient market strategies. The Brainy Insights has extensive experience in data synthesis where the data passes through various stages:


Market Deduction & Formulation: The final stage comprises of assigning data points at appropriate market spaces so as to deduce feasible conclusions. Analyst perspective & subject matter expert based holistic form of market sizing coupled with industry analysis also plays a crucial role in this stage.
This stage involves in finalization of the market size and numbers that we have collected from data integration step. With data interpolation, it is made sure that there is no gap in the market data. Successful trend analysis is done by our analysts using extrapolation techniques, which provide the best possible forecasts for the market.
Data Validation & Market Feedback: Validation is the most important step in the process. Validation & re-validation via an intricately designed process helps us finalize data-points to be used for final calculations.

The Brainy Insights interacts with leading companies and experts of the concerned domain to develop the analyst team’s market understanding and expertise. It improves and substantiates every single data presented in the market reports. The data validation interview and discussion panels are typically composed of the most experienced industry members. The participants include, however, are not limited to:
Moreover, we always validate our data and findings through primary respondents from all the major regions we are working on.


Free Customization
Fortune 500 Clients
Free Yearly Update On Purchase Of Multi/Corporate License
Companies Served Till Date