- +1-315-215-1633
- sales@thebrainyinsights.com

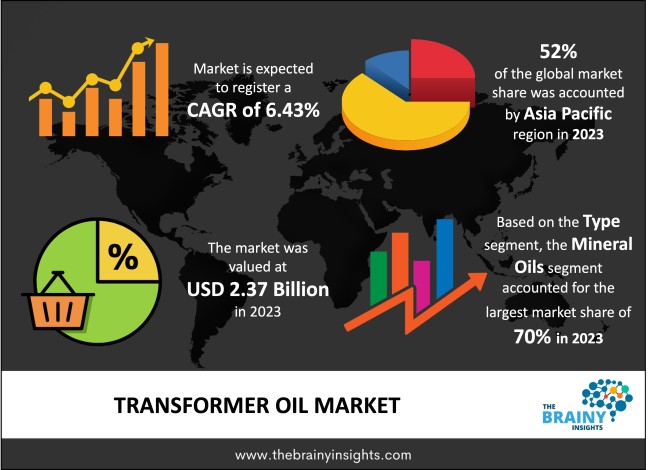
The global transformer oil market is expected to grow from USD 2.37 billion in 2023 to USD 4.42 billion by 2033, at a CARG of 6.43% during the forecast period 2024-2033.
Transformer oil, also known as insulating oil, is an oil which is steady at high temperatures and has superior electrical insulating characteristics. It is a derivative of mineral oils, but substitute composition with better chemical and physical properties are rising in demand. It's utilized in high-voltage capacitors, high-voltage switches and circuit breaks, oil-filled transformers and fluorescent lamp ballasts. Transformer oils are also utilized in the preservation of transformer’s winding and core as these are completely immersed into the oil.
Transformer oil serves two main functions in a transformer that is, dissipation of heat generated inside the transformers and suppression of arching. It is derived from the fractional distillation of crude oil and show significant insulating properties.
Get an overview of this study by requesting a free sample
The market of transformer oils is witnessing a stable growth because of rising power consumption, expansion of electrical grids in the developing region and increasing investment in the power sector which drives the market globally.
The study delivers a comprehensive analysis by type, application, end-user and region. The type segment includes bio-based transformer oil, mineral-based transformer oils and silicone-based transformer oils. Mineral oils have the largest share of 70% in 2023. It is due to its easy availability and low price compared to other transformer oils.
The application segment includes power transformer, small-scale transformers, distribution transformer, instrument transformer and others. Small scale distribution has the largest share of 32% in 2023. This system is used extensively to meet burgeoning electricity needs in rural areas.
The end-user segment includes power generation, transmission & distribution, railways & metros and others. In 2023 Transmission & distribution section is predicted to have a share of 45% in transformer oils market due to growing power requirements because of increasing urbanization along with a growing population which results an increase in the number of substations which is projected to boost the demand for transformer oils.
The transformer oil is regionally divided into South America, North America, Europe, Asia-Pacific and Middle East & Africa. Asia-Pacific region dominates the market followed by North America. Asia-Pacific have the largest share of 52% in 2023. The growth in this region is due to growing demand for power in developing countries like India and China. Rising power requirements, along with upgradation of the aging electrical infrastructure are projected to result in an increase in the number of substations.
The key players of this market are Ergon International, Apar Industries, Nynas AB, Petrochina Company Limited, Sinopec Lubricant, Cargill Inc., Valvoline and Dairen Chemical Corporation.
Global Transformer Oil Market Analysis And Forecast, By Type
Global Transformer Oil Market Analysis And Forecast, By Application
Global Transformer Oil Market Analysis And Forecast, By End-User
Global Transformer Oil Market Analysis And Forecast, By Region
As per The Brainy Insights, the size of the Transformer Oil market was valued at USD 2.37 Billion in 2023 & USD 4.42 Billion by 2033.
Global Transformer Oil market is growing at a CAGR of 6.43% during the forecast period 2024-2033.
Asia Pacific region emerged as the largest market for the Transformer Oil.
The high usage of transformer oil in the power generation sector is a significant driving factor for the growth of the Transformer Oil market.
A fluctuation in crude oil prices is a significant restraining factor for the growth of the Transformer Oil market.
The expansion of electric grid in emerging economies is a significant opportunity for the growth of the Transformer Oil market.
Key players are Ergon International, Apar Industries, Nynas AB, Petrochina Company Limited, Sinopec Lubricant, Cargill Inc., Valvoline and Dairen Chemical Corporation among others.
1. Introduction
1.1. Objectives of the Study
1.2. Market Definition
1.3. Research Scope
1.4. Currency
1.5. Key Target Audience
2. Research Methodology and Assumptions
3. Executive Summary
4. Premium Insights
4.1. Porter’s Five Forces Analysis
4.2. Value Chain Analysis
4.3. Top Investment Pockets
4.3.1. Market Attractiveness Analysis By Type
4.3.2. Market Attractiveness Analysis Application
4.3.3. Market Attractiveness Analysis By End User
4.3.4. Market Attractiveness Analysis By Region
4.4. Industry Trends
5. Market Dynamics
5.1. Market Evaluation
5.2. Drivers
5.3. Restrains
5.4. Opportunities
5.5. Challenges
6. Global Transformer Oil Market Analysis and Forecast, By Type
6.1. Segment Overview
6.2. Bio-Based Transformer Oil
6.3. Mineral-Based Transformer Oils
6.4. Silicone-Based Transformer Oils
7. Global Transformer Oil Market Analysis and Forecast, Application
7.1. Segment Overview
7.2. Power Transformer
7.3. Small-Scale Transformers
7.4. Distribution Transformer
7.5. Instrument Transformer
7.6. Others
8. Global Transformer Oil Market Analysis and Forecast, By End User
8.1. Segment Overview
8.2. Power Generation
8.3. Transmission & Distribution
8.4. Railways & Metros
8.5. Other
9. Global Transformer Oil Market Analysis and Forecast, By Regional Analysis
9.1. Segment Overview
9.2. North America
9.2.1. U.S.
9.2.2. Canada
9.2.3. Mexico
9.3. Europe
9.3.1. Germany
9.3.2. France
9.3.3. U.K.
9.3.4. Italy
9.3.5. Spain
9.4. Asia-Pacific
9.4.1. Japan
9.4.2. China
9.4.3. India
9.5. South America
9.5.1. Brazil
9.6. Middle East and Africa
9.6.1. UAE
9.6.2. South Africa
10. Global Transformer Oil Market-Competitive Landscape
10.1. Overview
10.2. Market Share of Key Players in Global Transformer Oil Market
10.2.1. Global Company Market Share
10.2.2. North America Company Market Share
10.2.3. Europe Company Market Share
10.2.4. APAC Company Market Share
10.3. Competitive Situations and Trends
10.3.1. Product Launches and Developments
10.3.2. Partnerships, Collaborations, and Agreements
10.3.3. Mergers & Acquisitions
10.3.4. Expansions
11. Company Profiles
11.1. Ergon International
11.1.1. Business Overview
11.1.2. Company Snapshot
11.1.3. Company Market Share Analysis
11.1.4. Company Product Portfolio
11.1.5. Recent Developments
11.1.6. SWOT Analysis
11.2. Apar Industries
11.2.1. Business Overview
11.2.2. Company Snapshot
11.2.3. Company Market Share Analysis
11.2.4. Company Product Portfolio
11.2.5. Recent Developments
11.2.6. SWOT Analysis
11.3. Nynas AB
11.3.1. Business Overview
11.3.2. Company Snapshot
11.3.3. Company Market Share Analysis
11.3.4. Company Product Portfolio
11.3.5. Recent Developments
11.3.6. SWOT Analysis
11.4. Petrochina Company Limited
11.4.1. Business Overview
11.4.2. Company Snapshot
11.4.3. Company Market Share Analysis
11.4.4. Company Product Portfolio
11.4.5. Recent Developments
11.4.6. SWOT Analysis
11.5. Sinopec Lubricant
11.5.1. Business Overview
11.5.2. Company Snapshot
11.5.3. Company Market Share Analysis
11.5.4. Company Product Portfolio
11.5.5. Recent Developments
11.5.6. SWOT Analysis
11.6. Cargill Inc
11.6.1. Business Overview
11.6.2. Company Snapshot
11.6.3. Company Market Share Analysis
11.6.4. Company Product Portfolio
11.6.5. Recent Developments
11.6.6. SWOT Analysis
11.7. Valvoline
11.7.1. Business Overview
11.7.2. Company Snapshot
11.7.3. Company Market Share Analysis
11.7.4. Company Product Portfolio
11.7.5. Recent Developments
11.7.6. SWOT Analysis
11.8. Chemical Corporation.
11.8.1. Business Overview
11.8.2. Company Snapshot
11.8.3. Company Market Share Analysis
11.8.4. Company Product Portfolio
11.8.5. Recent Developments
11.8.6. SWOT Analysis
11.8.7. SWOT Analysis
List of Table
1. Global Transformer Oil Market, By Type, 2020-2033(USD Billion)
2. Global Bio-Based Transformer Oil Market, By Region, 2020-2033(USD Billion)
3. Global Mineral-Based Transformer Oils Market, By Region, 2020-2033(USD Billion)
4. Global Silicone-Based Transformer Oils Market, By Region, 2020-2033(USD Billion)
5. Global Transformer Oil Market, Application, 2020-2033(USD Billion)
6. Global Power Transformer Oil Market, By Region, 2020-2033(USD Billion)
7. Global Small-Scale Transformers Transformer Oil Market, By Region, 2020-2033(USD Billion)
8. Global Distribution Transformer Oil Market, By Region, 2020-2033(USD Billion)
9. Global Instrument Transformer Oil Market, By Region, 2020-2033(USD Billion)
10. Global Others Transformer Oil Market, By Region, 2020-2033(USD Billion)
11. Global Transformer Oil Market, By End User, 2020-2033(USD Billion)
12. Global Power Generation Transformer Oil Market, By Region, 2020-2033(USD Billion)
13. Global Transmission & Distribution Transformer Oil Market, By Region, 2020-2033(USD Billion)
14. Global Railways & Metros Transformer Oil Market, By Region, 2020-2033(USD Billion)
15. Global Other Polymeric Alloys Transformer Oil Market, By Region, 2020-2033(USD Billion)
16. Global Transformer Oil Market, By Region, 2020-2033(USD Billion)
17. Global Transformer Oil Market, By North America, 2020-2033(USD Billion)
18. North America Transformer Oil Market, By Type, 2020-2033(USD Billion)
19. North America Transformer Oil Market, Application, 2020-2033(USD Billion)
20. North America Transformer Oil Market, By End User, 2020-2033(USD Billion)
21. U.S. Transformer Oil Market, By Type, 2020-2033(USD Billion)
22. U.S. Transformer Oil Market, Application, 2020-2033(USD Billion)
23. U.S. Transformer Oil Market, By End User, 2020-2033(USD Billion)
24. Canada Transformer Oil Market, By Type, 2020-2033(USD Billion)
25. Canada Transformer Oil Market, Application, 2020-2033(USD Billion)
26. Canada Transformer Oil Market, By End User, 2020-2033(USD Billion)
27. Mexico Transformer Oil Market, By Type, 2020-2033(USD Billion)
28. Mexico Transformer Oil Market, Application, 2020-2033(USD Billion)
29. Mexico Transformer Oil Market, By End User, 2020-2033(USD Billion)
30. Europe Transformer Oil Market, By Type, 2020-2033(USD Billion)
31. Europe Transformer Oil Market, Application, 2020-2033(USD Billion)
32. Europe Transformer Oil Market, By End User, 2020-2033(USD Billion)
33. Germany Transformer Oil Market, By Type, 2020-2033(USD Billion)
34. Germany Transformer Oil Market, Application, 2020-2033(USD Billion)
35. Germany Transformer Oil Market, By End User, 2020-2033(USD Billion)
36. France Transformer Oil Market, By Type, 2020-2033(USD Billion)
37. France Transformer Oil Market, Application, 2020-2033(USD Billion)
38. France Transformer Oil Market, By End User, 2020-2033(USD Billion)
39. U.K. Transformer Oil Market, By Type, 2020-2033(USD Billion)
40. U.K. Transformer Oil Market, Application, 2020-2033(USD Billion)
41. U.K. Transformer Oil Market, By End User, 2020-2033(USD Billion)
42. Italy Transformer Oil Market, By Type, 2020-2033(USD Billion)
43. Italy Transformer Oil Market, Application, 2020-2033(USD Billion)
44. Italy Transformer Oil Market, By End User, 2020-2033(USD Billion)
45. Spain Transformer Oil Market, By Type, 2020-2033(USD Billion)
46. Spain Transformer Oil Market, Application, 2020-2033(USD Billion)
47. Spain Transformer Oil Market, By End User, 2020-2033(USD Billion)
48. Asia Pacific Transformer Oil Market, By Type, 2020-2033(USD Billion)
49. Asia Pacific Transformer Oil Market, Application, 2020-2033(USD Billion)
50. Asia Pacific Transformer Oil Market, By End User, 2020-2033(USD Billion)
51. Japan Transformer Oil Market, By Type, 2020-2033(USD Billion)
52. Japan Transformer Oil Market, Application, 2020-2033(USD Billion)
53. Japan Transformer Oil Market, By End User, 2020-2033(USD Billion)
54. China Transformer Oil Market, By Type, 2020-2033(USD Billion)
55. China Transformer Oil Market, Application, 2020-2033(USD Billion)
56. China Transformer Oil Market, By End User, 2020-2033(USD Billion)
57. India Transformer Oil Market, By Type, 2020-2033(USD Billion)
58. India Transformer Oil Market, Application, 2020-2033(USD Billion)
59. India Transformer Oil Market, By End User, 2020-2033(USD Billion)
60. South America Transformer Oil Market, By Type, 2020-2033(USD Billion)
61. South America Transformer Oil Market, Application, 2020-2033(USD Billion)
62. South America Transformer Oil Market, By End User, 2020-2033(USD Billion)
63. Brazil Transformer Oil Market, By Type, 2020-2033(USD Billion)
64. Brazil Transformer Oil Market, Application, 2020-2033(USD Billion)
65. Brazil Transformer Oil Market, By End User, 2020-2033(USD Billion)
66. Middle East and Africa Transformer Oil Market, By Type, 2020-2033(USD Billion)
67. Middle East and Africa Transformer Oil Market, Application, 2020-2033(USD Billion)
68. Middle East and Africa Transformer Oil Market, By End User, 2020-2033(USD Billion)
69. UAE Transformer Oil Market, By Type, 2020-2033(USD Billion)
70. UAE Transformer Oil Market, Application, 2020-2033(USD Billion)
71. UAE Transformer Oil Market, By End User, 2020-2033(USD Billion)
72. South Africa Transformer Oil Market, By Type, 2020-2033(USD Billion)
73. South Africa Transformer Oil Market, Application, 2020-2033(USD Billion)
74. South Africa Transformer Oil Market, By End User, 2020-2033(USD Billion)
List of Figures
1. Global Transformer Oil Market Segmentation
2. Transformer Oil Market: Research Methodology
3. Market Size Estimation Methodology: Bottom-Up Approach
4. Market Size Estimation Methodology: Top-Down Approach
5. Data Triangulation
6. Porter’s Five Forces Analysis
7. Value Chain Analysis
8. Global Transformer Oil Market Attractiveness Analysis By Type
9. Global Transformer Oil Market Attractiveness Analysis Application
10. Global Transformer Oil Market Attractiveness Analysis By End User
11. Global Transformer Oil Market Attractiveness Analysis By Region
12. Global Transformer Oil Market: Dynamics
13. Global Transformer Oil Market Share By Type (2020 & 2033)
14. Global Transformer Oil Market Share Application (2020 & 2033)
15. Global Transformer Oil Market Share By End User (2020 & 2033)
16. Global Transformer Oil Market Share by Regions (2020 & 2033)
17. Global Transformer Oil Market Share by Company (2023)
This study forecasts revenue at global, regional, and country levels from 2020 to 2033. The Brainy Insights has segmented the global Transformer Oil market based on below mentioned segments:
Global Transformer Oil by Type:
Global Transformer Oil by Application:
Global Transformer Oil by End USer:
Global Transformer Oil by Region:
Research has its special purpose to undertake marketing efficiently. In this competitive scenario, businesses need information across all industry verticals; the information about customer wants, market demand, competition, industry trends, distribution channels etc. This information needs to be updated regularly because businesses operate in a dynamic environment. Our organization, The Brainy Insights incorporates scientific and systematic research procedures in order to get proper market insights and industry analysis for overall business success. The analysis consists of studying the market from a miniscule level wherein we implement statistical tools which helps us in examining the data with accuracy and precision.
Our research reports feature both; quantitative and qualitative aspects for any market. Qualitative information for any market research process are fundamental because they reveal the customer needs and wants, usage and consumption for any product/service related to a specific industry. This in turn aids the marketers/investors in knowing certain perceptions of the customers. Qualitative research can enlighten about the different product concepts and designs along with unique service offering that in turn, helps define marketing problems and generate opportunities. On the other hand, quantitative research engages with the data collection process through interviews, e-mail interactions, surveys and pilot studies. Quantitative aspects for the market research are useful to validate the hypotheses generated during qualitative research method, explore empirical patterns in the data with the help of statistical tools, and finally make the market estimations.
The Brainy Insights offers comprehensive research and analysis, based on a wide assortment of factual insights gained through interviews with CXOs and global experts and secondary data from reliable sources. Our analysts and industry specialist assume vital roles in building up statistical tools and analysis models, which are used to analyse the data and arrive at accurate insights with exceedingly informative research discoveries. The data provided by our organization have proven precious to a diverse range of companies, facilitating them to address issues such as determining which products/services are the most appealing, whether or not customers use the product in the manner anticipated, the purchasing intentions of the market and many others.
Our research methodology encompasses an idyllic combination of primary and secondary initiatives. Key phases involved in this process are listed below:

The phase involves the gathering and collecting of market data and its related information with the help of different sources & research procedures.

The data procurement stage involves in data gathering and collecting through various data sources.
This stage involves in extensive research. These data sources includes:
Purchased Database: Purchased databases play a crucial role in estimating the market sizes irrespective of the domain. Our purchased database includes:
Primary Research: The Brainy Insights interacts with leading companies and experts of the concerned domain to develop the analyst team’s market understanding and expertise. It improves and substantiates every single data presented in the market reports. Primary research mainly involves in telephonic interviews, E-mail interactions and face-to-face interviews with the raw material providers, manufacturers/producers, distributors, & independent consultants. The interviews that we conduct provides valuable data on market size and industry growth trends prevailing in the market. Our organization also conducts surveys with the various industry experts in order to gain overall insights of the industry/market. For instance, in healthcare industry we conduct surveys with the pharmacists, doctors, surgeons and nurses in order to gain insights and key information of a medical product/device/equipment which the customers are going to usage. Surveys are conducted in the form of questionnaire designed by our own analyst team. Surveys plays an important role in primary research because surveys helps us to identify the key target audiences of the market. Additionally, surveys helps to identify the key target audience engaged with the market. Our survey team conducts the survey by targeting the key audience, thus gaining insights from them. Based on the perspectives of the customers, this information is utilized to formulate market strategies. Moreover, market surveys helps us to understand the current competitive situation of the industry. To be precise, our survey process typically involve with the 360 analysis of the market. This analytical process begins by identifying the prospective customers for a product or service related to the market/industry to obtain data on how a product/service could fit into customers’ lives.

Secondary Research: The secondary data sources includes information published by the on-profit organizations such as World bank, WHO, company fillings, investor presentations, annual reports, national government documents, statistical databases, blogs, articles, white papers and others. From the annual report, we analyse a company’s revenue to understand the key segment and market share of that organization in a particular region. We analyse the company websites and adopt the product mapping technique which is important for deriving the segment revenue. In the product mapping method, we select and categorize the products offered by the companies catering to domain specific market, deduce the product revenue for each of the companies so as to get overall estimation of the market size. We also source data and analyses trends based on information received from supply side and demand side intermediaries in the value chain. The supply side denotes the data gathered from supplier, distributor, wholesaler and the demand side illustrates the data gathered from the end customers for respective market domain.

The supply side for a domain specific market is analysed by:
The demand side for the market is estimated through:
In-house Library: Apart from these third-party sources, we have our in-house library of qualitative and quantitative information. Our in-house database includes market data for various industry and domains. These data are updated on regular basis as per the changing market scenario. Our library includes, historic databases, internal audit reports and archives.
Sometimes there are instances where there is no metadata or raw data available for any domain specific market. For those cases, we use our expertise to forecast and estimate the market size in order to generate comprehensive data sets. Our analyst team adopt a robust research technique in order to produce the estimates:
Data Synthesis: This stage involves the analysis & mapping of all the information obtained from the previous step. It also involves in scrutinizing the data for any discrepancy observed while data gathering related to the market. The data is collected with consideration to the heterogeneity of sources. Robust scientific techniques are in place for synthesizing disparate data sets and provide the essential contextual information that can orient market strategies. The Brainy Insights has extensive experience in data synthesis where the data passes through various stages:


Market Deduction & Formulation: The final stage comprises of assigning data points at appropriate market spaces so as to deduce feasible conclusions. Analyst perspective & subject matter expert based holistic form of market sizing coupled with industry analysis also plays a crucial role in this stage.
This stage involves in finalization of the market size and numbers that we have collected from data integration step. With data interpolation, it is made sure that there is no gap in the market data. Successful trend analysis is done by our analysts using extrapolation techniques, which provide the best possible forecasts for the market.
Data Validation & Market Feedback: Validation is the most important step in the process. Validation & re-validation via an intricately designed process helps us finalize data-points to be used for final calculations.

The Brainy Insights interacts with leading companies and experts of the concerned domain to develop the analyst team’s market understanding and expertise. It improves and substantiates every single data presented in the market reports. The data validation interview and discussion panels are typically composed of the most experienced industry members. The participants include, however, are not limited to:
Moreover, we always validate our data and findings through primary respondents from all the major regions we are working on.


Free Customization
Fortune 500 Clients
Free Yearly Update On Purchase Of Multi/Corporate License
Companies Served Till Date