- +1-315-215-1633
- sales@thebrainyinsights.com

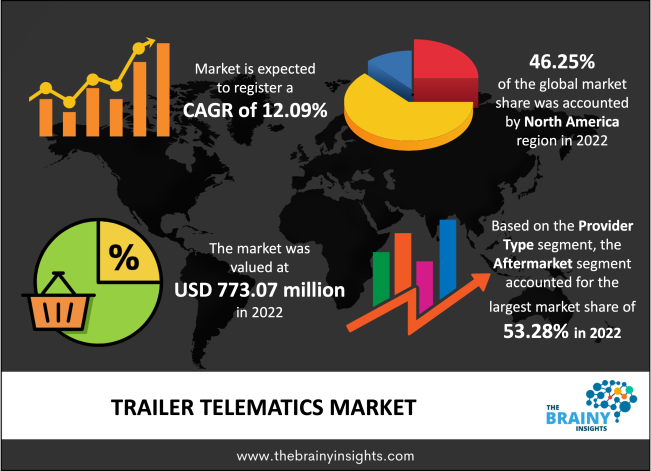
The global trailer telematics market was valued at USD 773.07 million in 2022, increasing at a CAGR of 12.09% from 2022 to 2032 and anticipated to reach USD 2420.40 million by 2032. Asia Pacific is expected to grow the fastest during the forecast period. Also, the high adoption of the telematics system for fleet management, ease of vehicle diagnosis due to the predictive analysis of telematics systems, and rising customer demand are expected to drive market growth during the forecast period.
Telematics is described as a technology system that vehicular sensors and leverages telecommunication components, wireless networking, and data dashboards to help the long-distance transmission of data from moving transportation appliances. Telematics monitor the vehicle by GPS system, which maps & documents the vehicle's exact location & also provides information on how fast the vehicle travels. Telematics helps recognize fuel leakage and permits them to resolve quickly by helping fleet managers. Telematics helps assist each driver's most effective route, saving mileage. Telematics provides a digital blueprint of every vehicle's operation, allowing fleet managers to understand where improvements can be made in accident prevention measures and driver safety standards. Telematics is balanced for exponential growth as new applications are developed to take benefit of modern GPS units and the general use of mobile appliances. More fleets recognize the need to monitor fleet activity to boost productivity, improve accountability, control prices, and fully comply with government regulations.
Get an overview of this study by requesting a free sample
For example, in March 2022, Utility Trailer Manufacturing Company, a manufacturer of refrigerated campers, announced Phillips Connect as its exclusive member for trailer telematics with the launch of Utility Connect.
The increased purchasing power of customers: The government regulations for vehicle telematics and a rise in the popularity of connectivity solutions are propelling market growth. Further, the rising investments in infrastructure and inland transportation, along with the surge in construction activities, are expected to propel the market growth. Moreover, the early adoption of telematics technology for commercial vehicles and concerns regarding the safety and security of commercial vehicle telematics are driving factors of the market growth. Additionally, the presence of a large automotive production base and the rapidly growing transportation and logistics industry propel the market growth during the forecast period. The proliferation of the manufacturing, textile, agriculture, electronics, and clothing industries has also raised the demand for logistics and supply chain services.
The lack of standardization: The high initial cost and the high maintenance cost of telematics are restraining factors of the market growth. Moreover, the reduced free trade, a lack of truck drivers, and stricter emission rules are expected to hamper the market growth during the forecast period. Additionally, the mature automotive market and decreasing automotive sales are hindering market growth during the forecast period. Moreover, specific rules and regulations imposed for semi-trailers with typical roads and newly developed innovative designs are restraining the market growth during the forecast period. However, refrigerated trailers have numerous components that need regular maintenance, such as condensers, compressors, and evaporators, raising maintenance costs. Such factors will inhibit the growth of the market during the projection period.
The increasing development of transportation and logistics: The increasing demand for crash-free & safe transportation and the requirement to optimize fleet management are the opportunity factor for market growth. Further, the high adoption rates of advanced technology, the adoption of commercial vehicle telematics technology, and government mandates for different applications in the field of commercial vehicle telematics are expected to drive market growth over the forecast period. Moreover, with the reduction in the prices of components and the availability of more low-cost manufacturers, more stable and advanced systems are expected to propel the market growth during the forecast period. Apart from this, the increasing cases of road fatalities, coupled with the presence of government standards on road safety, are anticipated to drive market growth during the forecast period.
The regions analyzed for the market include Europe, South America, Asia Pacific, North America, the Middle East, and Africa. North America emerged as the largest global trailer telematics market, with a 46.25% market revenue share in 2022. North America dominates the trailer telematics market due to rising safety and security concerns. Further, the growing e-commerce industry, the busy road infrastructure network, and the ever-increasing transportation and logistics industry in Canada and the U.S. are anticipated to propel the market growth during the forecast period in this region. Moreover, the robust presence of automotive systems and components manufacturers, the growing population, the rise in fleet management, and the rising disposable income are expected to drive market growth in this region. Asia Pacific is expected to grow the fastest during the forecast period due to increased demand for vehicle telematics. Furthermore, emerging economies such as China and India, which comprise large supply chains & logistics networks, are expected to drive market growth during the forecast period in this region. Additionally, the strict vehicle safety regulations imposed by the government and awareness among people about road safety are also helping to boost the market growth in this region during the forecast period.
North America Region Trailer Telematics Market Share in 2022 - 46.25%
www.thebrainyinsights.com
Check the geographical analysis of this market by requesting a free sample
The application segment is divided into a semi-trailer and a full trailer. The semi-trailer segment dominated, with a market share of around 56.12% in 2022. This growth is attributed to the increased demand in the transportation industry. Semi-trailers are suitable vehicles for massive goods transportation. Further, by 2032, the full-trailer segment will likely dominate the market due to the expansion of the logistics industry.
The provider type segment is divided into aftermarket and OEM. In 2022, the aftermarket segment dominated the market with 53.28% and a revenue of 411.89 million. This growth is attributed to the rising demand for telematics solutions in fleet management. Further, by 2032, the OEM segment will likely dominate the market due to the increasing disposable income.
The power source segment is divided into solar battery operated devices, wired devices, and self-contained battery operated devices. In 2022, the solar battery operated devices segment dominated the market with 43.18% and a revenue of 333.81 million. This growth is attributed to the increasing manufacturing of wearable electronics, implantable medical devices, and flexible electronics. Further, by 2032, the self-contained battery operated devices segment will likely dominate the market due to the increasing importance of renewable energy sources.
| Attribute | Description |
|---|---|
| Market Size | Revenue (USD Billion) |
| Market size value in 2022 | USD 773.07 Million |
| Market size value in 2032 | USD 2420.40 Million |
| CAGR (2023 to 2032) | 12.09% |
| Historical data | 2019-2021 |
| Base Year | 2022 |
| Forecast | 2023-2032 |
| Regional Segments | The key regions are North America, South America, Asia Pacific, Europe, and Middle East & Africa. |
| Segments | Key Segments are application, provider type, power source and regions |
North America region emerged as the largest market for trailer telematics.
The market's growth will be influenced by the increased purchasing power of customers.
The lack of standardization could hamper the market growth.
Technological advancement will provide huge opportunities to the market.
1. Introduction
1.1. Objectives of the Study
1.2. Market Definition
1.3. Research Scope
1.4. Currency
1.5. Key Target Audience
2. Research Methodology and Assumptions
3. Executive Summary
4. Premium Insights
4.1. Porter’s Five Forces Analysis
4.2. Value Chain Analysis
4.3. Top Investment Pockets
4.3.1. Market Attractiveness Analysis By Application
4.3.2. Market Attractiveness Analysis By Provider Type
4.3.3. Market Attractiveness Analysis By Power Source
4.3.4. Market Attractiveness Analysis By Region
4.4. Industry Trends
5. Market Dynamics
5.1. Market Evaluation
5.2. Drivers
5.2.1. The increased purchasing power of customers
5.2.2. The advancement in the automobile industry
5.2.3. The increasing demand for next-generation telematics protocol (NGTP)
5.3. Restraints
5.3.1. The lack of standardization
5.3.2. The high cost
5.4. Opportunities
5.4.1. The increasing development of transportation and logistics
5.4.2. The technological advancement
6. Global Trailer Telematics Market Analysis and Forecast, By Application
6.1. Segment Overview
6.2. Semi-Trailer
6.3. Full Trailer
7. Global Trailer Telematics Market Analysis and Forecast, By Provider Type
7.1. Segment Overview
7.2. Aftermarket
7.3. OEM
8. Global Trailer Telematics Market Analysis and Forecast, By Power Source
8.1. Segment Overview
8.2. Solar Battery Operated Devices
8.3. Wired Devices
8.4. Self-Contained Battery Operated Devices
9. Global Trailer Telematics Market Analysis and Forecast, By Regional Analysis
9.1. Segment Overview
9.2. North America
9.2.1. U.S.
9.2.2. Canada
9.2.3. Mexico
9.3. Europe
9.3.1. Germany
9.3.2. France
9.3.3. U.K.
9.3.4. Italy
9.3.5. Spain
9.4. Asia-Pacific
9.4.1. Japan
9.4.2. China
9.4.3. India
9.5. South America
9.5.1. Brazil
9.6. Middle East and Africa
9.6.1. UAE
9.6.2. South Africa
10. Global Trailer Telematics Market-Competitive Landscape
10.1. Overview
10.2. Market Share of Key Players in Global Trailer Telematics Market
10.2.1. Global Company Market Share
10.2.2. North America Company Market Share
10.2.3. Europe Company Market Share
10.2.4. APAC Company Market Share
10.3. Competitive Situations and Trends
10.3.1. Product Launches and Developments
10.3.2. Partnerships, Collaborations, and Agreements
10.3.3. Mergers & Acquisitions
10.3.4. Expansions
11. Company Profiles
11.1. EROAD
11.1.1. Business Overview
11.1.2. Company Snapshot
11.1.3. Company Market Share Analysis
11.1.4. Company Product Portfolio
11.1.5. Recent Developments
11.1.6. SWOT Analysis
11.2. Tirsan
11.2.1. Business Overview
11.2.2. Company Snapshot
11.2.3. Company Market Share Analysis
11.2.4. Company Product Portfolio
11.2.5. Recent Developments
11.2.6. SWOT Analysis
11.3. Truck-Lite
11.3.1. Business Overview
11.3.2. Company Snapshot
11.3.3. Company Market Share Analysis
11.3.4. Company Product Portfolio
11.3.5. Recent Developments
11.3.6. SWOT Analysis
11.4. Astrata Group (Omnitracs)
11.4.1. Business Overview
11.4.2. Company Snapshot
11.4.3. Company Market Share Analysis
11.4.4. Company Product Portfolio
11.4.5. Recent Developments
11.4.6. SWOT Analysis
11.5. CalAmp
11.5.1. Business Overview
11.5.2. Company Snapshot
11.5.3. Company Market Share Analysis
11.5.4. Company Product Portfolio
11.5.5. Recent Developments
11.5.6. SWOT Analysis
11.6. Descartes
11.6.1. Business Overview
11.6.2. Company Snapshot
11.6.3. Company Market Share Analysis
11.6.4. Company Product Portfolio
11.6.5. Recent Developments
11.6.6. SWOT Analysis
11.7. Masternaut
11.7.1. Business Overview
11.7.2. Company Snapshot
11.7.3. Company Market Share Analysis
11.7.4. Company Product Portfolio
11.7.5. Recent Developments
11.7.6. SWOT Analysis
11.8. Qualcomm
11.8.1. Business Overview
11.8.2. Company Snapshot
11.8.3. Company Market Share Analysis
11.8.4. Company Product Portfolio
11.8.5. Recent Developments
11.8.6. SWOT Analysis
11.9. Fleetmatics
11.9.1. Business Overview
11.9.2. Company Snapshot
11.9.3. Company Market Share Analysis
11.9.4. Company Product Portfolio
11.9.5. Recent Developments
11.9.6. SWOT Analysis
11.10. Schmitz Cargobull
11.10.1. Business Overview
11.10.2. Company Snapshot
11.10.3. Company Market Share Analysis
11.10.4. Company Product Portfolio
11.10.5. Recent Developments
11.10.6. SWOT Analysis
11.11. Intel
11.11.1. Business Overview
11.11.2. Company Snapshot
11.11.3. Company Market Share Analysis
11.11.4. Company Product Portfolio
11.11.5. Recent Developments
11.11.6. SWOT Analysis
11.12. Microlise
11.12.1. Business Overview
11.12.2. Company Snapshot
11.12.3. Company Market Share Analysis
11.12.4. Company Product Portfolio
11.12.5. Recent Developments
11.12.6. SWOT Analysis
11.13. Philips
11.13.1. Business Overview
11.13.2. Company Snapshot
11.13.3. Company Market Share Analysis
11.13.4. Company Product Portfolio
11.13.5. Recent Developments
11.13.6. SWOT Analysis
11.14. WABCO (ZF)
11.14.1. Business Overview
11.14.2. Company Snapshot
11.14.3. Company Market Share Analysis
11.14.4. Company Product Portfolio
11.14.5. Recent Developments
11.14.6. SWOT Analysis
11.15. ORBCOMM
11.15.1. Business Overview
11.15.2. Company Snapshot
11.15.3. Company Market Share Analysis
11.15.4. Company Product Portfolio
11.15.5. Recent Developments
11.15.6. SWOT Analysis
11.16. Trendfire Technologies
11.16.1. Business Overview
11.16.2. Company Snapshot
11.16.3. Company Market Share Analysis
11.16.4. Company Product Portfolio
11.16.5. Recent Developments
11.16.6. SWOT Analysis
11.17. FleetGO
11.17.1. Business Overview
11.17.2. Company Snapshot
11.17.3. Company Market Share Analysis
11.17.4. Company Product Portfolio
11.17.5. Recent Developments
11.17.6. SWOT Analysis
11.18. BPW
11.18.1. Business Overview
11.18.2. Company Snapshot
11.18.3. Company Market Share Analysis
11.18.4. Company Product Portfolio
11.18.5. Recent Developments
11.18.6. SWOT Analysis
11.19. CLS
11.19.1. Business Overview
11.19.2. Company Snapshot
11.19.3. Company Market Share Analysis
11.19.4. Company Product Portfolio
11.19.5. Recent Developments
11.19.6. SWOT Analysis
11.20. Star Leasing
11.20.1. Business Overview
11.20.2. Company Snapshot
11.20.3. Company Market Share Analysis
11.20.4. Company Product Portfolio
11.20.5. Recent Developments
11.20.6. SWOT Analysis
11.21. MiX Telematics
11.21.1. Business Overview
11.21.2. Company Snapshot
11.21.3. Company Market Share Analysis
11.21.4. Company Product Portfolio
11.21.5. Recent Developments
11.21.6. SWOT Analysis
11.22. Spireon
11.22.1. Business Overview
11.22.2. Company Snapshot
11.22.3. Company Market Share Analysis
11.22.4. Company Product Portfolio
11.22.5. Recent Developments
11.22.6. SWOT Analysis
List of Table
1. Global Trailer Telematics Market, By Application, 2019-2032 (USD Million)
2. Global Semi-Trailer, Trailer Telematics Market, By Region, 2019-2032 (USD Million)
3. Global Full Trailer, Trailer Telematics Market, By Region, 2019-2032 (USD Million)
4. Global Trailer Telematics Market, By Provider Type, 2019-2032 (USD Million)
5. Global Aftermarket, Trailer Telematics Market, By Region, 2019-2032 (USD Million)
6. Global OEM, Trailer Telematics Market, By Region, 2019-2032 (USD Million)
7. Global Trailer Telematics Market, By Power Source, 2019-2032 (USD Million)
8. Global Solar Battery Operated Devices, Trailer Telematics Market, By Region, 2019-2032 (USD Million)
9. Global Wired Devices, Trailer Telematics Market, By Region, 2019-2032 (USD Million)
10. Global Self-Contained Battery Operated Devices, Trailer Telematics Market, By Region, 2019-2032 (USD Million)
11. North America Trailer Telematics Market, By Application, 2019-2032 (USD Million)
12. North America Trailer Telematics Market, By Provider Type, 2019-2032 (USD Million)
13. North America Trailer Telematics Market, By Power Source, 2019-2032 (USD Million)
14. U.S. Trailer Telematics Market, By Application, 2019-2032 (USD Million)
15. U.S. Trailer Telematics Market, By Provider Type, 2019-2032 (USD Million)
16. U.S. Trailer Telematics Market, By Power Source, 2019-2032 (USD Million)
17. Canada Trailer Telematics Market, By Application, 2019-2032 (USD Million)
18. Canada Trailer Telematics Market, By Provider Type, 2019-2032 (USD Million)
19. Canada Trailer Telematics Market, By Power Source, 2019-2032 (USD Million)
20. Mexico Trailer Telematics Market, By Application, 2019-2032 (USD Million)
21. Mexico Trailer Telematics Market, By Provider Type, 2019-2032 (USD Million)
22. Mexico Trailer Telematics Market, By Power Source, 2019-2032 (USD Million)
23. Europe Trailer Telematics Market, By Application, 2019-2032 (USD Million)
24. Europe Trailer Telematics Market, By Provider Type, 2019-2032 (USD Million)
25. Europe Trailer Telematics Market, By Power Source, 2019-2032 (USD Million)
26. Germany Trailer Telematics Market, By Application, 2019-2032 (USD Million)
27. Germany Trailer Telematics Market, By Provider Type, 2019-2032 (USD Million)
28. Germany Trailer Telematics Market, By Power Source, 2019-2032 (USD Million)
29. France Trailer Telematics Market, By Application, 2019-2032 (USD Million)
30. France Trailer Telematics Market, By Provider Type, 2019-2032 (USD Million)
31. France Trailer Telematics Market, By Power Source, 2019-2032 (USD Million)
32. U.K. Trailer Telematics Market, By Application, 2019-2032 (USD Million)
33. U.K. Trailer Telematics Market, By Provider Type, 2019-2032 (USD Million)
34. U.K. Trailer Telematics Market, By Power Source, 2019-2032 (USD Million)
35. Italy Trailer Telematics Market, By Application, 2019-2032 (USD Million)
36. Italy Trailer Telematics Market, By Provider Type, 2019-2032 (USD Million)
37. Italy Trailer Telematics Market, By Power Source, 2019-2032 (USD Million)
38. Spain Trailer Telematics Market, By Application, 2019-2032 (USD Million)
39. Spain Trailer Telematics Market, By Provider Type, 2019-2032 (USD Million)
40. Spain Trailer Telematics Market, By Power Source, 2019-2032 (USD Million)
41. Asia Pacific Trailer Telematics Market, By Application, 2019-2032 (USD Million)
42. Asia Pacific Trailer Telematics Market, By Provider Type, 2019-2032 (USD Million)
43. Asia Pacific Trailer Telematics Market, By Power Source, 2019-2032 (USD Million)
44. Japan Trailer Telematics Market, By Application, 2019-2032 (USD Million)
45. Japan Trailer Telematics Market, By Provider Type, 2019-2032 (USD Million)
46. Japan Trailer Telematics Market, By Power Source, 2019-2032 (USD Million)
47. China Trailer Telematics Market, By Application, 2019-2032 (USD Million)
48. China Trailer Telematics Market, By Provider Type, 2019-2032 (USD Million)
49. China Trailer Telematics Market, By Power Source, 2019-2032 (USD Million)
50. India Trailer Telematics Market, By Application, 2019-2032 (USD Million)
51. India Trailer Telematics Market, By Provider Type, 2019-2032 (USD Million)
52. India Trailer Telematics Market, By Power Source, 2019-2032 (USD Million)
53. South America Trailer Telematics Market, By Application, 2019-2032 (USD Million)
54. South America Trailer Telematics Market, By Provider Type, 2019-2032 (USD Million)
55. South America Trailer Telematics Market, By Power Source, 2019-2032 (USD Million)
56. Brazil Trailer Telematics Market, By Application, 2019-2032 (USD Million)
57. Brazil Trailer Telematics Market, By Provider Type, 2019-2032 (USD Million)
58. Brazil Trailer Telematics Market, By Power Source, 2019-2032 (USD Million)
59. Middle East and Africa Trailer Telematics Market, By Application, 2019-2032 (USD Million)
60. Middle East and Africa Trailer Telematics Market, By Provider Type, 2019-2032 (USD Million)
61. Middle East and Africa Trailer Telematics Market, By Power Source, 2019-2032 (USD Million)
62. UAE Trailer Telematics Market, By Application, 2019-2032 (USD Million)
63. UAE Trailer Telematics Market, By Provider Type, 2019-2032 (USD Million)
64. UAE Trailer Telematics Market, By Power Source, 2019-2032 (USD Million)
65. South Africa Trailer Telematics Market, By Application, 2019-2032 (USD Million)
66. South Africa Trailer Telematics Market, By Provider Type, 2019-2032 (USD Million)
67. South Africa Trailer Telematics Market, By Power Source, 2019-2032 (USD Million)
List of Figures
1. Global Trailer Telematics Market Segmentation
2. Global Trailer Telematics Market: Research Methodology
3. Market Size Estimation Methodology: Bottom-Up Approach
4. Market Size Estimation Methodology: Top- Approach
5. Data Triangulation
6. Porter’s Five Forces Analysis
7. Value Chain Analysis
8. Global Trailer Telematics Market Attractiveness Analysis By Application
9. Global Trailer Telematics Market Attractiveness Analysis By Provider Type
10. Global Trailer Telematics Market Attractiveness Analysis By Power Source
11. Global Trailer Telematics Market Attractiveness Analysis By Region
12. Global Trailer Telematics Market: Dynamics
13. Global Trailer Telematics Market Share By Application (2023 & 2032)
14. Global Trailer Telematics Market Share By Provider Type (2023 & 2032)
15. Global Trailer Telematics Market Share By Power Source (2023 & 2032)
16. Global Trailer Telematics Market Share By Regions (2023 & 2032)
17. Global Trailer Telematics Market Share By Company (2022)
This study forecasts revenue at global, regional, and country levels from 2019 to 2032. The Brainy Insights has segmented the global trailer telematics based on below mentioned segments:
Global Trailer Telematics Market by Application:
Global Trailer Telematics Market by Provider Type:
Global Trailer Telematics Market by Power Source:
Global Trailer Telematics by Region:
Research has its special purpose to undertake marketing efficiently. In this competitive scenario, businesses need information across all industry verticals; the information about customer wants, market demand, competition, industry trends, distribution channels etc. This information needs to be updated regularly because businesses operate in a dynamic environment. Our organization, The Brainy Insights incorporates scientific and systematic research procedures in order to get proper market insights and industry analysis for overall business success. The analysis consists of studying the market from a miniscule level wherein we implement statistical tools which helps us in examining the data with accuracy and precision.
Our research reports feature both; quantitative and qualitative aspects for any market. Qualitative information for any market research process are fundamental because they reveal the customer needs and wants, usage and consumption for any product/service related to a specific industry. This in turn aids the marketers/investors in knowing certain perceptions of the customers. Qualitative research can enlighten about the different product concepts and designs along with unique service offering that in turn, helps define marketing problems and generate opportunities. On the other hand, quantitative research engages with the data collection process through interviews, e-mail interactions, surveys and pilot studies. Quantitative aspects for the market research are useful to validate the hypotheses generated during qualitative research method, explore empirical patterns in the data with the help of statistical tools, and finally make the market estimations.
The Brainy Insights offers comprehensive research and analysis, based on a wide assortment of factual insights gained through interviews with CXOs and global experts and secondary data from reliable sources. Our analysts and industry specialist assume vital roles in building up statistical tools and analysis models, which are used to analyse the data and arrive at accurate insights with exceedingly informative research discoveries. The data provided by our organization have proven precious to a diverse range of companies, facilitating them to address issues such as determining which products/services are the most appealing, whether or not customers use the product in the manner anticipated, the purchasing intentions of the market and many others.
Our research methodology encompasses an idyllic combination of primary and secondary initiatives. Key phases involved in this process are listed below:

The phase involves the gathering and collecting of market data and its related information with the help of different sources & research procedures.

The data procurement stage involves in data gathering and collecting through various data sources.
This stage involves in extensive research. These data sources includes:
Purchased Database: Purchased databases play a crucial role in estimating the market sizes irrespective of the domain. Our purchased database includes:
Primary Research: The Brainy Insights interacts with leading companies and experts of the concerned domain to develop the analyst team’s market understanding and expertise. It improves and substantiates every single data presented in the market reports. Primary research mainly involves in telephonic interviews, E-mail interactions and face-to-face interviews with the raw material providers, manufacturers/producers, distributors, & independent consultants. The interviews that we conduct provides valuable data on market size and industry growth trends prevailing in the market. Our organization also conducts surveys with the various industry experts in order to gain overall insights of the industry/market. For instance, in healthcare industry we conduct surveys with the pharmacists, doctors, surgeons and nurses in order to gain insights and key information of a medical product/device/equipment which the customers are going to usage. Surveys are conducted in the form of questionnaire designed by our own analyst team. Surveys plays an important role in primary research because surveys helps us to identify the key target audiences of the market. Additionally, surveys helps to identify the key target audience engaged with the market. Our survey team conducts the survey by targeting the key audience, thus gaining insights from them. Based on the perspectives of the customers, this information is utilized to formulate market strategies. Moreover, market surveys helps us to understand the current competitive situation of the industry. To be precise, our survey process typically involve with the 360 analysis of the market. This analytical process begins by identifying the prospective customers for a product or service related to the market/industry to obtain data on how a product/service could fit into customers’ lives.

Secondary Research: The secondary data sources includes information published by the on-profit organizations such as World bank, WHO, company fillings, investor presentations, annual reports, national government documents, statistical databases, blogs, articles, white papers and others. From the annual report, we analyse a company’s revenue to understand the key segment and market share of that organization in a particular region. We analyse the company websites and adopt the product mapping technique which is important for deriving the segment revenue. In the product mapping method, we select and categorize the products offered by the companies catering to domain specific market, deduce the product revenue for each of the companies so as to get overall estimation of the market size. We also source data and analyses trends based on information received from supply side and demand side intermediaries in the value chain. The supply side denotes the data gathered from supplier, distributor, wholesaler and the demand side illustrates the data gathered from the end customers for respective market domain.

The supply side for a domain specific market is analysed by:
The demand side for the market is estimated through:
In-house Library: Apart from these third-party sources, we have our in-house library of qualitative and quantitative information. Our in-house database includes market data for various industry and domains. These data are updated on regular basis as per the changing market scenario. Our library includes, historic databases, internal audit reports and archives.
Sometimes there are instances where there is no metadata or raw data available for any domain specific market. For those cases, we use our expertise to forecast and estimate the market size in order to generate comprehensive data sets. Our analyst team adopt a robust research technique in order to produce the estimates:
Data Synthesis: This stage involves the analysis & mapping of all the information obtained from the previous step. It also involves in scrutinizing the data for any discrepancy observed while data gathering related to the market. The data is collected with consideration to the heterogeneity of sources. Robust scientific techniques are in place for synthesizing disparate data sets and provide the essential contextual information that can orient market strategies. The Brainy Insights has extensive experience in data synthesis where the data passes through various stages:


Market Deduction & Formulation: The final stage comprises of assigning data points at appropriate market spaces so as to deduce feasible conclusions. Analyst perspective & subject matter expert based holistic form of market sizing coupled with industry analysis also plays a crucial role in this stage.
This stage involves in finalization of the market size and numbers that we have collected from data integration step. With data interpolation, it is made sure that there is no gap in the market data. Successful trend analysis is done by our analysts using extrapolation techniques, which provide the best possible forecasts for the market.
Data Validation & Market Feedback: Validation is the most important step in the process. Validation & re-validation via an intricately designed process helps us finalize data-points to be used for final calculations.

The Brainy Insights interacts with leading companies and experts of the concerned domain to develop the analyst team’s market understanding and expertise. It improves and substantiates every single data presented in the market reports. The data validation interview and discussion panels are typically composed of the most experienced industry members. The participants include, however, are not limited to:
Moreover, we always validate our data and findings through primary respondents from all the major regions we are working on.


Free Customization
Fortune 500 Clients
Free Yearly Update On Purchase Of Multi/Corporate License
Companies Served Till Date