- +1-315-215-1633
- sales@thebrainyinsights.com

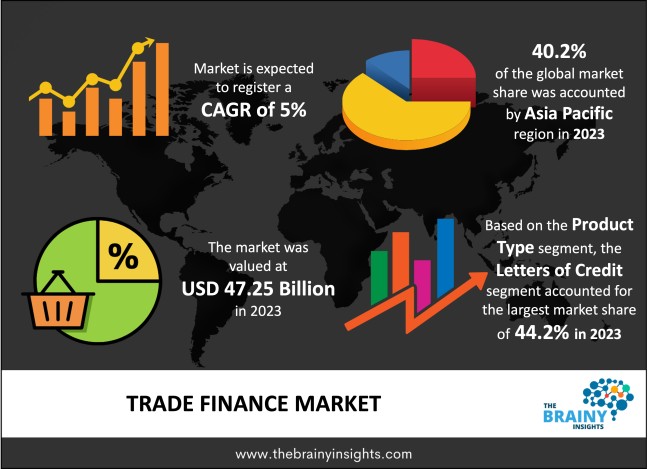
The global trade finance market was valued at USD 47.25 billion in 2023 and grew at a CAGR of 5% from 2024 to 2033. The market is expected to reach USD 76.97 billion by 2033. The increasing demand for trade financing by SMEs in developing nations will drive the global trade finance market's growth. In the early days of global trade, exporters often found themselves in a precarious position, uncertain about receiving payments from importers for their products. To address this, they developed ways to minimize potential losses. Importers, on the other hand, were wary of making advanced payments, fearing that sellers might not deliver as promised. Financial firms are strongly influenced by the heightened demand for trade finance and thus invest in approaches that minimize diffusion risks. These methods must be capable of monitoring multiple structured and unstructured data sets simultaneously while also providing importers/exporters with financial stability concerning payment and supply risks.
Buying and selling goods and services form the foundational basis of an economy. A successful transaction or buying/selling of a good will be defined as a trade. The trade can be domestic, meaning it can be within the market players inside the territorial limits or international, between nations. Trade finance facilitates successful trade transactions amongst parties. It is a financing tool for trade in the domestic and international markets. Trade financing reduces the risks involved in buying and selling goods and ensures seamless transactions and successful delivery of goods and payments. The stakeholders in trade finance are the buyers, sellers, bankers, insurance agencies and other relevant parties. Trade financing enables suppliers and buyers to provide competitive terms By minimizing payment lags during the trade cycle. Trade finance offers the financing, payment guarantees, and insurance required to make it easier for buyers to pay for goods and services on conditions acceptable to exporters and importers. The digital transformation in trade financing has contributed to faster, more efficient and more effective services.
Get an overview of this study by requesting a free sample
The increasing demand for trade finance from SMEs – The growing role of small and medium enterprises in global trade has highlighted the lack of access to legitimate trade finance offered to them. Small and medium enterprises contribute to developing the national economies worldwide and employing millions. They are foundational pillars of the global economy and drive development and growth worldwide. Their growing business has enabled them to access the international market and offer their products to foreign economies. However, SMEs face difficulties accessing trade finance to facilitate seamless trade transactions. The importance of SMEs in the national economy has persuaded the government, SMEs, bankers, and other stakeholders to engage in dialogue and offer favourable rules and regulations to improve their access to trade financing. Similarly, international organizations like the world trade organization and the united nations are working towards developing a cohesive growth environment to enhance trade financing for SMEs and reduce the trade financing market gap in developing countries. Therefore, the increasing demand for SME trade financing will drive the growth of the global trade finance market.
The rising geopolitical tensions – The changing geopolitical scenarios in the last decade have witnessed rising tensions. The ongoing trade war between USA and China was further exacerbated in recent months given the diplomatic low they experienced in their relations over the alleged Chinese spy balloon. The Taiwan issue is also expected to further intensify the trade war. Similarly, the Western sanctions on Russia following its invasion of Ukraine led to trade disruptions and supply chain crises worldwide. The complications on the EU-UK-Ireland borders have caused similar confusion and heightened tensions related to trade across these borders. All these developments are expected to continue and negatively impact international trade. Additionally, trade wars and conflicts lead to difficulties in trade financing, which will hamper the market's growth.
The use of blockchain in trade finance – The growing automation and digitization worldwide- can also be seen in the trade financing market. The use of blockchain technology in trade financing is gaining traction globally, given its numerous benefits for providers and clients. Blockchain is a method of storing data that makes it difficult or impossible to change the system, hack or cheat it. A network of computer systems known as a blockchain merely copies and disseminates a digital log of transactions across the whole network. Blockchain will enable quicker access to clients' transactional and other relevant histories, faster credit processing, and simplify the entire process. Using blockchain technology in trade finance will optimize costs, improve the safety and security of client data, information and transaction, and enhance accountability and compliance. Additionally, it also reduces errors and manipulation. Therefore, blockchain in trade finance will offer lucrative opportunities to the market players in the forecast period.
The regions analyzed for the market include North America, Europe, South America, Asia Pacific, the Middle East, and Africa. Asia Pacific emerged as the largest global trade finance market, with a 40.2% market revenue share in 2023.
Asia Pacific region will account for the largest market share with revenue growth. The growing population of the region driven by India and China are increasing consumer demand which is also facilitated by the rising disposable income of the population. China and India are top producers of several commodities. The substantial consumer market and suppliers in the region are driving international trade. The presence of SMEs is also contributing to the region's growth. The presence of several trade financing providers is augmenting the market's growth in the Asia Pacific market.
Asia Pacific Region Trade Finance Market Share in 2023 – 40.2%
www.thebrainyinsights.com
Check the geographical analysis of this market by requesting a free sample
The product type segment is divided into letters of credit, export factoring, insurance, bill of lading, guarantees and others. The letters of credit segment dominated the market, with a market share of 44.2% in 2023. An official document that serves as a guarantee for payments made by one bank to another. An agreement between a beneficiary, a bank, and the bank's customer makes up a letter of credit. The beneficiary is assured that payment will be made once the letter of credit's conditions has been met by the letter of credit, which the importer's bank frequently gives. Risk is decreased by using letters of credit. The risk of defaulting clients is reduced. Under certain conditions, a bank's Letter of Credit guarantees that a seller will receive payment. It helps buyers demonstrate their soundness financially. It helps vendors manage their cash flow and assures the security of payments.
The finance type segment is divided into structured trade finance, supply chain finance, and traditional trade finance. The supply chain finance segment dominated the market, with a market share of 43.3% in 2023. Supply chain management requires supply chain financing (SCF). Supply chain finance links buyers and suppliers with a financial institution to decrease risks, increase cash flow efficiency, and lower financing costs. In a nutshell, it is versatile, effective, and helpful for the supply chain management. Supply chain financing can help supply networks become more stable and adaptable by directing the lowest cost of capital to the areas of the supply chain where it is most required. This allows them to refocus their attention from simply surviving to improve efficiency, innovating, and investing in new products. It offers longer payment terms and a quicker cash conversion cycle. Supply chain finance minimizes supply chain risk, strengthens supplier connections, and fosters company expansion.
The service provider segment is divided into banks, trade finance houses and others. The banks' segment dominated the market, with a market share of 55.4% in 2023. A bank is a financial organization that lends money and takes deposits. The bank engages in lending activities directly or indirectly. Providing foreign currency to individuals and companies that selective commercial banks facilitate export or import goods from overseas. A stronger level of market regulatory surveillance, control, and accountability is made possible in trade financing through authorized banks, thereby explaining its dominance in the market.
The end-user segment is divided into importers and exporters, banks and financiers, insurers and export credit agencies and others. The importers and exporters segment dominated the market, with a market share of 40.1% in 2023. The exporter is the individual or organization that sends the commodities outside the nation. The importer is the individual or organization that purchases items into their nation from another country. Trade finance offers the financing, payment guarantees, and insurance necessary to make it easier for the goods or services to be paid for on conditions acceptable to both the exporter and the importer. The increasing international trade volume will propel the segment's global trade finance market growth.
| Attribute | Description |
|---|---|
| Market Size | Revenue (USD Billion) |
| Market size value in 2023 | USD 47.25 Billion |
| Market size value in 2033 | USD 76.97 Billion |
| CAGR (2024 to 2033) | 5% |
| Historical data | 2020-2022 |
| Base Year | 2023 |
| Forecast | 2024-2033 |
| Region | The regions analyzed for the market are Asia Pacific, Europe, South America, North America, and Middle East & Africa. Furthermore, the regions are further analyzed at the country level. |
| Segments | Product Type, Finance Type, Service Provider, End User |
As per The Brainy Insights, the size of the global trade finance market was valued at USD 47.25 billion in 2023 to USD 79.67 billion by 2033.
Global trade finance market is growing at a CAGR of 5% during the forecast period 2024-2033.
The market's growth will be influenced by the increasing demand for trade finance from SMEs.
The rising geopolitical tensions could hamper the market growth.
1. Introduction
1.1. Objectives of the Study
1.2. Market Definition
1.3. Research Scope
1.4. Currency
1.5. Key Target Audience
2. Research Methodology and Assumptions
3. Executive Summary
4. Premium Insights
4.1. Porter’s Five Forces Analysis
4.2. Value Chain Analysis
4.3. Top Investment Pockets
4.3.1. Market Attractiveness Analysis by Product Type
4.3.2. Market Attractiveness Analysis by Finance Type
4.3.3. Market Attractiveness Analysis by Service Provider
4.3.4. Market Attractiveness Analysis by End User
4.3.5. Market Attractiveness Analysis by Region
4.4. Industry Trends
5. Market Dynamics
5.1. Market Evaluation
5.2. Drivers
5.2.1. The increasing demand for trade finance from SMEs
5.3. Restraints
5.3.1. The rising geopolitical tensions
5.4. Opportunities
5.4.1. The use of blockchain in trade finance
5.5. Challenges
5.5.1. The complex documentation and regulatory approvals
6. Global Trade Finance Market Analysis and Forecast, By Product Type
6.1. Segment Overview
6.2. Letters of Credit
6.3. Export Factoring
6.4. Insurance
6.5. Bill of Lading
6.6. Guarantees
6.7. Others
7. Global Trade Finance Market Analysis and Forecast, By Finance Type
7.1. Segment Overview
7.2. Structured Trade Finance
7.3. Supply Chain Finance
7.4. Traditional Trade Finance
8. Global Trade Finance Market Analysis and Forecast, By Service Provider
8.1. Segment Overview
8.2. Banks
8.3. Trade Finance Houses
8.4. Others
9. Global Trade Finance Market Analysis and Forecast, By End User
9.1. Segment Overview
9.2. Importers and Exporters
9.3. Banks and Financiers
9.4. Insurers and Export Credit Agencies
9.5. Others
10. Global Trade Finance Market Analysis and Forecast, By Regional Analysis
10.1. Segment Overview
10.2. North America
10.2.1. U.S.
10.2.2. Canada
10.2.3. Mexico
10.3. Europe
10.3.1. Germany
10.3.2. France
10.3.3. U.K.
10.3.4. Italy
10.3.5. Spain
10.4. Asia-Pacific
10.4.1. Japan
10.4.2. China
10.4.3. India
10.5. South America
10.5.1. Brazil
10.6. Middle East and Africa
10.6.1. UAE
10.6.2. South Africa
11. Global Trade Finance Market-Competitive Landscape
11.1. Overview
11.2. Market Share of Key Players in the Trade Finance Market
11.2.1. Global Company Market Share
11.2.2. North America Company Market Share
11.2.3. Europe Company Market Share
11.2.4. APAC Company Market Share
11.3. Competitive Situations and Trends
11.3.1. Product Launches and Developments
11.3.2. Partnerships, Collaborations, and Agreements
11.3.3. Mergers & Acquisitions
11.3.4. Expansions
12. Company Profiles
12.1. Asian Development Bank
12.1.1. Business Overview
12.1.2. Company Snapshot
12.1.3. Company Market Share Analysis
12.1.4. Company Product Portfolio
12.1.5. Recent Developments
12.1.6. SWOT Analysis
12.2. Bank of America Corporation
12.2.1. Business Overview
12.2.2. Company Snapshot
12.2.3. Company Market Share Analysis
12.2.4. Company Product Portfolio
12.2.5. Recent Developments
12.2.6. SWOT Analysis
12.3. Citigroup Inc.
12.3.1. Business Overview
12.3.2. Company Snapshot
12.3.3. Company Market Share Analysis
12.3.4. Company Product Portfolio
12.3.5. Recent Developments
12.3.6. SWOT Analysis
12.4. DBS Bank Ltd
12.4.1. Business Overview
12.4.2. Company Snapshot
12.4.3. Company Market Share Analysis
12.4.4. Company Product Portfolio
12.4.5. Recent Developments
12.4.6. SWOT Analysis
12.5. Euler Hermes Group
12.5.1. Business Overview
12.5.2. Company Snapshot
12.5.3. Company Market Share Analysis
12.5.4. Company Product Portfolio
12.5.5. Recent Developments
12.5.6. SWOT Analysis
12.6. HSBC Holdings PLC
12.6.1. Business Overview
12.6.2. Company Snapshot
12.6.3. Company Market Share Analysis
12.6.4. Company Product Portfolio
12.6.5. Recent Developments
12.6.6. SWOT Analysis
12.7. JPMorgan Chase & Co
12.7.1. Business Overview
12.7.2. Company Snapshot
12.7.3. Company Market Share Analysis
12.7.4. Company Product Portfolio
12.7.5. Recent Developments
12.7.6. SWOT Analysis
12.8. Mitsubishi UFJ Financial Inc.
12.8.1. Business Overview
12.8.2. Company Snapshot
12.8.3. Company Market Share Analysis
12.8.4. Company Product Portfolio
12.8.5. Recent Developments
12.8.6. SWOT Analysis
12.9. Standard Chartered PLC
12.9.1. Business Overview
12.9.2. Company Snapshot
12.9.3. Company Market Share Analysis
12.9.4. Company Product Portfolio
12.9.5. Recent Developments
12.9.6. SWOT Analysis
12.10. The Royal Bank of Scotland Group plc
12.10.1. Business Overview
12.10.2. Company Snapshot
12.10.3. Company Market Share Analysis
12.10.4. Company Product Portfolio
12.10.5. Recent Developments
12.10.6. SWOT Analysis
List of Table
1. Global Trade Finance Market, By Product Type, 2020-2033 (USD Billion)
2. Global Letters of Credit Trade Finance Market, By Region, 2020-2033 (USD Billion)
3. Global Export Factoring Trade Finance Market, By Region, 2020-2033 (USD Billion)
4. Global Insurance Trade Finance Market, By Region, 2020-2033 (USD Billion)
5. Global Bill of Lading Trade Finance Market, By Region, 2020-2033 (USD Billion)
6. Global Guarantees Trade Finance Market, By Region, 2020-2033 (USD Billion)
7. Global Others Trade Finance Market, By Region, 2020-2033 (USD Billion)
8. Global Trade Finance Market, By Finance Type, 2020-2033 (USD Billion)
9. Global Structured Trade Finance Trade Finance Market, By Region, 2020-2033 (USD Billion)
10. Global Supply Chain Finance Trade Finance Market, By Region, 2020-2033 (USD Billion)
11. Global Traditional Trade Finance Trade Finance Market, By Region, 2020-2033 (USD Billion)
12. Global Trade Finance Market, By Service Provider, 2020-2033 (USD Billion)
13. Global Banks Trade Finance Market, By Region, 2020-2033 (USD Billion)
14. Global Trade Finance Houses Trade Finance Market, By Region, 2020-2033 (USD Billion)
15. Global Others Trade Finance Market, By Region, 2020-2033 (USD Billion)
16. Global Trade Finance Market, By End User, 2020-2033 (USD Billion)
17. Global Importers and Exporters Trade Finance Market, By Region, 2020-2033 (USD Billion)
18. Global Banks and Financiers Trade Finance Market, By Region, 2020-2033 (USD Billion)
19. Global Insurers and Export Credit Agencies Trade Finance Market, By Region, 2020-2033 (USD Billion)
20. Global Others Trade Finance Market, By Region, 2020-2033 (USD Billion)
21. Global Trade Finance Market, By Region, 2020-2033 (USD Billion)
22. North America Trade Finance Market, By Product Type, 2020-2033 (USD Billion)
23. North America Trade Finance Market, By Finance Type, 2020-2033 (USD Billion)
24. North America Trade Finance Market, By Service Provider, 2020-2033 (USD Billion)
25. North America Trade Finance Market, By End User, 2020-2033 (USD Billion)
26. U.S. Trade Finance Market, By Product Type, 2020-2033 (USD Billion)
27. U.S. Trade Finance Market, By Finance Type, 2020-2033 (USD Billion)
28. U.S. Trade Finance Market, By Service Provider, 2020-2033 (USD Billion)
29. U.S. Trade Finance Market, By End User, 2020-2033 (USD Billion)
30. Canada Trade Finance Market, By Product Type, 2020-2033 (USD Billion)
31. Canada Trade Finance Market, By Finance Type, 2020-2033 (USD Billion)
32. Canada Trade Finance Market, By Service Provider, 2020-2033 (USD Billion)
33. Canada Trade Finance Market, By End User, 2020-2033 (USD Billion)
34. Mexico Trade Finance Market, By Product Type, 2020-2033 (USD Billion)
35. Mexico Trade Finance Market, By Finance Type, 2020-2033 (USD Billion)
36. Mexico Trade Finance Market, By Service Provider, 2020-2033 (USD Billion)
37. Mexico Trade Finance Market, By End User, 2020-2033 (USD Billion)
38. Europe Trade Finance Market, By Product Type, 2020-2033 (USD Billion)
39. Europe Trade Finance Market, By Finance Type, 2020-2033 (USD Billion)
40. Europe Trade Finance Market, By Service Provider, 2020-2033 (USD Billion)
41. Europe Trade Finance Market, By End User, 2020-2033 (USD Billion)
42. Germany Trade Finance Market, By Product Type, 2020-2033 (USD Billion)
43. Germany Trade Finance Market, By Finance Type, 2020-2033 (USD Billion)
44. Germany Trade Finance Market, By Service Provider, 2020-2033 (USD Billion)
45. Germany Trade Finance Market, By End User, 2020-2033 (USD Billion)
46. France Trade Finance Market, By Product Type, 2020-2033 (USD Billion)
47. France Trade Finance Market, By Finance Type, 2020-2033 (USD Billion)
48. France Trade Finance Market, By Service Provider, 2020-2033 (USD Billion)
49. France Trade Finance Market, By End User, 2020-2033 (USD Billion)
50. U.K. Trade Finance Market, By Product Type, 2020-2033 (USD Billion)
51. U.K. Trade Finance Market, By Finance Type, 2020-2033 (USD Billion)
52. U.K. Trade Finance Market, By Service Provider, 2020-2033 (USD Billion)
53. U.K. Trade Finance Market, By End User, 2020-2033 (USD Billion)
54. Italy Trade Finance Market, By Product Type, 2020-2033 (USD Billion)
55. Italy Trade Finance Market, By Finance Type, 2020-2033 (USD Billion)
56. Italy Trade Finance Market, By Service Provider, 2020-2033 (USD Billion)
57. Italy Trade Finance Market, By End User, 2020-2033 (USD Billion)
58. Spain Trade Finance Market, By Product Type, 2020-2033 (USD Billion)
59. Spain Trade Finance Market, By Finance Type, 2020-2033 (USD Billion)
60. Spain Trade Finance Market, By Service Provider, 2020-2033 (USD Billion)
61. Spain Trade Finance Market, By End User, 2020-2033 (USD Billion)
62. Asia Pacific Trade Finance Market, By Product Type, 2020-2033 (USD Billion)
63. Asia Pacific Trade Finance Market, By Finance Type, 2020-2033 (USD Billion)
64. Asia Pacific Trade Finance Market, By Service Provider, 2020-2033 (USD Billion)
65. Asia Pacific Trade Finance Market, By End User, 2020-2033 (USD Billion)
66. Japan Trade Finance Market, By Product Type, 2020-2033 (USD Billion)
67. Japan Trade Finance Market, By Finance Type, 2020-2033 (USD Billion)
68. Japan Trade Finance Market, By Service Provider, 2020-2033 (USD Billion)
69. Japan Trade Finance Market, By End User, 2020-2033 (USD Billion)
70. China Trade Finance Market, By Product Type, 2020-2033 (USD Billion)
71. China Trade Finance Market, By Finance Type, 2020-2033 (USD Billion)
72. China Trade Finance Market, By Service Provider, 2020-2033 (USD Billion)
73. China Trade Finance Market, By End User, 2020-2033 (USD Billion)
74. India Trade Finance Market, By Product Type, 2020-2033 (USD Billion)
75. India Trade Finance Market, By Finance Type, 2020-2033 (USD Billion)
76. India Trade Finance Market, By Service Provider, 2020-2033 (USD Billion)
77. India Trade Finance Market, By End User, 2020-2033 (USD Billion)
78. South America Trade Finance Market, By Product Type, 2020-2033 (USD Billion)
79. South America Trade Finance Market, By Finance Type, 2020-2033 (USD Billion)
80. South America Trade Finance Market, By Service Provider, 2020-2033 (USD Billion)
81. South America Trade Finance Market, By End User, 2020-2033 (USD Billion)
82. Brazil Trade Finance Market, By Product Type, 2020-2033 (USD Billion)
83. Brazil Trade Finance Market, By Finance Type, 2020-2033 (USD Billion)
84. Brazil Trade Finance Market, By Service Provider, 2020-2033 (USD Billion)
85. Brazil Trade Finance Market, By End User, 2020-2033 (USD Billion)
86. Middle East and Africa Trade Finance Market, By Product Type, 2020-2033 (USD Billion)
87. Middle East and Africa Trade Finance Market, By Finance Type, 2020-2033 (USD Billion)
88. Middle East and Africa Trade Finance Market, By Service Provider, 2020-2033 (USD Billion)
89. Middle East and Africa Trade Finance Market, By End User, 2020-2033 (USD Billion)
90. UAE Trade Finance Market, By Product Type, 2020-2033 (USD Billion)
91. UAE Trade Finance Market, By Finance Type, 2020-2033 (USD Billion)
92. UAE Trade Finance Market, By Service Provider, 2020-2033 (USD Billion)
93. UAE Trade Finance Market, By End User, 2020-2033 (USD Billion)
94. South Africa Trade Finance Market, By Product Type, 2020-2033 (USD Billion)
95. South Africa Trade Finance Market, By Finance Type, 2020-2033 (USD Billion)
96. South Africa Trade Finance Market, By Service Provider, 2020-2033 (USD Billion)
97. South Africa Trade Finance Market, By End User, 2020-2033 (USD Billion)
List of Figures
1. Global Trade Finance Market Segmentation
2. Trade Finance Market: Research Methodology
3. Market Size Estimation Methodology: Bottom-Up Approach
4. Market Size Estimation Methodology: Top-Down Approach
5. Data Triangulation
6. Porter’s Five Forces Analysis
7. Value Chain Analysis
8. Global Trade Finance Market Attractiveness Analysis by Product Type
9. Global Trade Finance Market Attractiveness Analysis by Finance Type
10. Global Trade Finance Market Attractiveness Analysis by Service Provider
11. Global Trade Finance Market Attractiveness Analysis by End User
12. Global Trade Finance Market Attractiveness Analysis by Region
13. Global Trade Finance Market: Dynamics
14. Global Trade Finance Market Share by Product Type (2023 & 2033)
15. Global Trade Finance Market Share by Finance Type (2023 & 2033)
16. Global Trade Finance Market Share by Service Provider (2023 & 2033)
17. Global Trade Finance Market Share by End User (2023 & 2033)
18. Global Trade Finance Market Share by Regions (2023 & 2033)
19. Global Trade Finance Market Share by Company (2023)
This study forecasts revenue at global, regional, and country levels from 2020 to 2033. The Brainy Insights has segmented the global trade finance market based on below mentioned segments:
Global Trade Finance Market by Product Type:
Global Trade Finance Market by Finance Type:
Global Trade Finance Market by Service Provider:
Global Trade Finance Market by End User:
Global Trade Finance Market by Region:
Research has its special purpose to undertake marketing efficiently. In this competitive scenario, businesses need information across all industry verticals; the information about customer wants, market demand, competition, industry trends, distribution channels etc. This information needs to be updated regularly because businesses operate in a dynamic environment. Our organization, The Brainy Insights incorporates scientific and systematic research procedures in order to get proper market insights and industry analysis for overall business success. The analysis consists of studying the market from a miniscule level wherein we implement statistical tools which helps us in examining the data with accuracy and precision.
Our research reports feature both; quantitative and qualitative aspects for any market. Qualitative information for any market research process are fundamental because they reveal the customer needs and wants, usage and consumption for any product/service related to a specific industry. This in turn aids the marketers/investors in knowing certain perceptions of the customers. Qualitative research can enlighten about the different product concepts and designs along with unique service offering that in turn, helps define marketing problems and generate opportunities. On the other hand, quantitative research engages with the data collection process through interviews, e-mail interactions, surveys and pilot studies. Quantitative aspects for the market research are useful to validate the hypotheses generated during qualitative research method, explore empirical patterns in the data with the help of statistical tools, and finally make the market estimations.
The Brainy Insights offers comprehensive research and analysis, based on a wide assortment of factual insights gained through interviews with CXOs and global experts and secondary data from reliable sources. Our analysts and industry specialist assume vital roles in building up statistical tools and analysis models, which are used to analyse the data and arrive at accurate insights with exceedingly informative research discoveries. The data provided by our organization have proven precious to a diverse range of companies, facilitating them to address issues such as determining which products/services are the most appealing, whether or not customers use the product in the manner anticipated, the purchasing intentions of the market and many others.
Our research methodology encompasses an idyllic combination of primary and secondary initiatives. Key phases involved in this process are listed below:

The phase involves the gathering and collecting of market data and its related information with the help of different sources & research procedures.

The data procurement stage involves in data gathering and collecting through various data sources.
This stage involves in extensive research. These data sources includes:
Purchased Database: Purchased databases play a crucial role in estimating the market sizes irrespective of the domain. Our purchased database includes:
Primary Research: The Brainy Insights interacts with leading companies and experts of the concerned domain to develop the analyst team’s market understanding and expertise. It improves and substantiates every single data presented in the market reports. Primary research mainly involves in telephonic interviews, E-mail interactions and face-to-face interviews with the raw material providers, manufacturers/producers, distributors, & independent consultants. The interviews that we conduct provides valuable data on market size and industry growth trends prevailing in the market. Our organization also conducts surveys with the various industry experts in order to gain overall insights of the industry/market. For instance, in healthcare industry we conduct surveys with the pharmacists, doctors, surgeons and nurses in order to gain insights and key information of a medical product/device/equipment which the customers are going to usage. Surveys are conducted in the form of questionnaire designed by our own analyst team. Surveys plays an important role in primary research because surveys helps us to identify the key target audiences of the market. Additionally, surveys helps to identify the key target audience engaged with the market. Our survey team conducts the survey by targeting the key audience, thus gaining insights from them. Based on the perspectives of the customers, this information is utilized to formulate market strategies. Moreover, market surveys helps us to understand the current competitive situation of the industry. To be precise, our survey process typically involve with the 360 analysis of the market. This analytical process begins by identifying the prospective customers for a product or service related to the market/industry to obtain data on how a product/service could fit into customers’ lives.

Secondary Research: The secondary data sources includes information published by the on-profit organizations such as World bank, WHO, company fillings, investor presentations, annual reports, national government documents, statistical databases, blogs, articles, white papers and others. From the annual report, we analyse a company’s revenue to understand the key segment and market share of that organization in a particular region. We analyse the company websites and adopt the product mapping technique which is important for deriving the segment revenue. In the product mapping method, we select and categorize the products offered by the companies catering to domain specific market, deduce the product revenue for each of the companies so as to get overall estimation of the market size. We also source data and analyses trends based on information received from supply side and demand side intermediaries in the value chain. The supply side denotes the data gathered from supplier, distributor, wholesaler and the demand side illustrates the data gathered from the end customers for respective market domain.

The supply side for a domain specific market is analysed by:
The demand side for the market is estimated through:
In-house Library: Apart from these third-party sources, we have our in-house library of qualitative and quantitative information. Our in-house database includes market data for various industry and domains. These data are updated on regular basis as per the changing market scenario. Our library includes, historic databases, internal audit reports and archives.
Sometimes there are instances where there is no metadata or raw data available for any domain specific market. For those cases, we use our expertise to forecast and estimate the market size in order to generate comprehensive data sets. Our analyst team adopt a robust research technique in order to produce the estimates:
Data Synthesis: This stage involves the analysis & mapping of all the information obtained from the previous step. It also involves in scrutinizing the data for any discrepancy observed while data gathering related to the market. The data is collected with consideration to the heterogeneity of sources. Robust scientific techniques are in place for synthesizing disparate data sets and provide the essential contextual information that can orient market strategies. The Brainy Insights has extensive experience in data synthesis where the data passes through various stages:


Market Deduction & Formulation: The final stage comprises of assigning data points at appropriate market spaces so as to deduce feasible conclusions. Analyst perspective & subject matter expert based holistic form of market sizing coupled with industry analysis also plays a crucial role in this stage.
This stage involves in finalization of the market size and numbers that we have collected from data integration step. With data interpolation, it is made sure that there is no gap in the market data. Successful trend analysis is done by our analysts using extrapolation techniques, which provide the best possible forecasts for the market.
Data Validation & Market Feedback: Validation is the most important step in the process. Validation & re-validation via an intricately designed process helps us finalize data-points to be used for final calculations.

The Brainy Insights interacts with leading companies and experts of the concerned domain to develop the analyst team’s market understanding and expertise. It improves and substantiates every single data presented in the market reports. The data validation interview and discussion panels are typically composed of the most experienced industry members. The participants include, however, are not limited to:
Moreover, we always validate our data and findings through primary respondents from all the major regions we are working on.


Free Customization
Fortune 500 Clients
Free Yearly Update On Purchase Of Multi/Corporate License
Companies Served Till Date