- +1-315-215-1633
- sales@thebrainyinsights.com

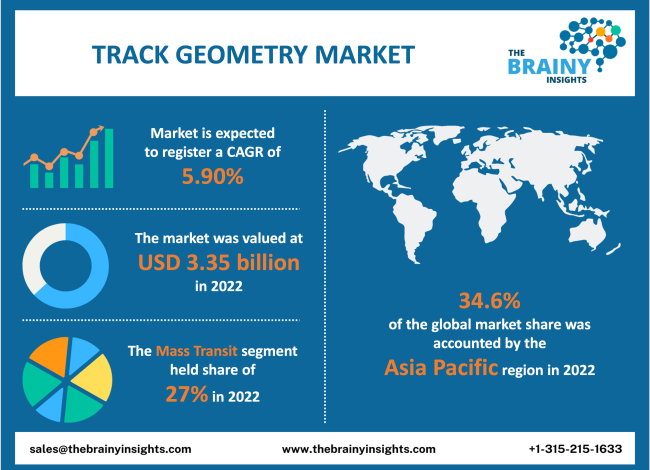
The global track geometry market was valued at USD 3.35 billion in 2022 and growing at a CAGR of 5.90% from 2023 to 2032. The market is expected to reach USD 5.94 billion by 2032. The rising need for security & safety in railway transport, the advancement in railway networks and metro lines, and the increasing use of track geometry measurement systems for track upkeep are significant elements for the growth of the global track geometry market. Furthermore, the rising need for smart technologies to support the operating efficiency of tracks and fast expansion in high-speed railways is running into the global track geometry market.
Track geometry measurement is the most crucial method in the rail industry for evaluating track safety and maintenance planning. Measuring and examining track geometry regularly is proven to control track-related problems, which can result in catastrophic damage. ENSCO’s Track Geometry Measurement System (TGMS) is the leader in the industry for trustworthiness and measurement reproducibly. Track geometry conditions are substantial elements causing vehicle/track interaction derailments like wheel climb, spreading gage (gauge), and rail rollover type derailments. Track geometry conditions can also push other derailments, like broken fasteners, broken rail, and thermal misalignment type derailments. The track geometry system can confirm that the track geometry condition is within limits to provide safe functions. The entire goal of track maintenance is to deliver the track and to keep the timetable. Transit and rail owner-operators achieve it via four objectives that are to provide a trustworthy rail system to assure that the required services are available and that all assets are fit for purpose, to give safety to all passengers and staff, and to provide security for passengers dependent on the rail system, to give economic prosperity for a rail organization via optimal and sustainable maintenance activities; and lastly, to deliver a comfortable ride for the customer, decreasing noise and enhancing ride quality. To achieve these objectives, a rail organization must comprehend the importance of all their assets, the state, and the quality of the track they own and operate on.
Get an overview of this study by requesting a free sample
In October 2022, TCDD (The Republic of Turkey State Railways) signed an agreement with Tesmec S.p.A. (a company in electronic devices, stringing and railway equipment, rock trenching, and surface miners for smart grid management) to provide an innovative diagnostic device combined with measuring devices to examine the railway network. The contract contains the design and construction of the diagnostic tool and onboard diagnostic systems, the training of local operators, and the inspection of diagnostic procedures.
Adherence to Multiple Standards Set by the Government - With increasing concerns about the safety of railways and technical advancements in the multiple areas of the railway industry, governments of numerous countries have executed rules and regulations that show the requirement to comply with the standards set by the government. The manufacturers operating in the market have been creating innovations to meet the need of the end-user industry and capitulate with the standard guidelines, therefore improving the authenticity of these systems, which is anticipated to grow in the track geometry market in the future.
Multiple Factors Together Restrict the Market Development- Several factors include pads, fastenings, sleepers, ballast, rail condition, and subgrade impact track geometry. It is monitored by track measurement vehicles, and the data collected is used to plan and undertake repair work. The cost of track maintenance equates to 50% of the total maintenance spend, with track geometry alone accounting for approximately 10% of the total maintenance spend. Track geometry faults cause poor condition track, which can worsen, resulting in speed limitations, having an adverse impact on train performance, and in severe cases, resulting in derailments.
Undergoing Metro Projects in Growing Countries - One of the crucial reasons pushing the development of the track geometry market is the increasing demand for metro networks in growing countries. With numerous metro projects undergoing, there has been a substantial upsurge in demand for track geometry measurement systems to set a solid railway network, which is anticipated to push the growth opportunity for the track geometry market.
The regions analyzed for the market include North America, Europe, South America, Asia Pacific, the Middle East, and Africa. Asia Pacific emerged as the largest market for the global track geometry market, with a 34.6% share of the market revenue in 2022.
The rising penetration of cutting-edge technologies promotes the market's growth in the Asia Pacific region. The robust development of high-speed rails and mass transit systems in India and China, along with various types of railway developments in the nations like Australia, India, and China, is the basis for the growth of track geometry measurement systems in the region. In expansion, fast growth in metro rails also boosts regional development. These countries are expected to push the Asia Pacific track geometry market over the projection years.
Asia Pacific Region Track Geometry Market Share in 2022 - 34.6%
www.thebrainyinsights.com
Check the geographical analysis of this market by requesting a free sample
The railway type segment is divided into high-speed, mass transit, heavy haul, and light. The mass transit segment dominated the market, with a market share of around 27% in 2022. The increasing need for precise measures of track geometry parameters and noticing variations from the preferred track geometry is promoting the growth of mass transit railways. Track geometry can be used for the latest railway construction projects and upkeep of existing railways.
The measurement type segment is divided into twist, vertical profile, dipped joints, dynamic cross-level, gauge, alignment, and others. The gauge segment dominated the market, with a market share of around 18% in 2022. Gauge is one of the critical parameters of track geometry measurement. The wheelsets of the rails should be compatible with the track gauge, or else it could result in deadly accidents due to derailment.
The operation type segment is divided into contact, and no contact. The no contact segment dominated the market, with a market share of around 56% in 2022. A no contact-based track geometry is a system that can measure the geometry of a railway track without physically touching it. It uses sensors mounted on a vehicle that runs along the track. The data from the sensors is then processed to make a three-dimensional model of the track. The main benefit of using a no contact is that it does not need any physical contact with the track, which means there is no chance of damage.
| Attribute | Description |
|---|---|
| Market Size | Revenue (USD Billion) |
| Market size value in 2022 | USD 3.35 Billion |
| Market size value in 2032 | USD 5.94 Billion |
| CAGR (2023 to 2032) | 5.90% |
| Historical data | 2019-2021 |
| Base Year | 2022 |
| Forecast | 2023-2032 |
| Regional Segments | The regions analyzed for the market are Asia Pacific, Europe, South America, North America, and Middle East & Africa. Furthermore, the regions are further analyzed at the country level. |
| Segments | Railway Type, Measurement Type, Operation Type |
As per The Brainy Insights, the size of the track geometry market was valued at USD 3.35 billion in 2022 to USD 5.94 billion by 2032.
Global track geometry market is growing at a CAGR of 5.90% during the forecast period 2023-2032.
Asia Pacific region emerged as the largest market for the track geometry market.
Adherence to multiple standards set by the government which propels market growth.
1. Introduction
1.1. Objectives of the Study
1.2. Market Definition
1.3. Research Scope
1.4. Currency
1.5. Key Target Audience
2. Research Methodology and Assumptions
3. Executive Summary
4. Premium Insights
4.1. Porter’s Five Forces Analysis
4.2. Value Chain Analysis
4.3. Top Investment Pockets
4.3.1. Market Attractiveness Analysis by Railway Type
4.3.2. Market Attractiveness Analysis by Measurement Type
4.3.3. Market Attractiveness Analysis by Operation Type
4.3.4. Market Attractiveness Analysis by Region
4.4. Industry Trends
5. Market Dynamics
5.1. Market Evaluation
5.2. Drivers
5.2.1. Adherence to multiple standards set by the government
5.3. Restraints
5.3.1. Multiple factors together restrict the market development
5.4. Opportunities
5.4.1. Undergoing metro projects in growing countries
6. Global Track Geometry Market Analysis and Forecast, By Railway Type:
6.1. Segment Overview
6.2. High-Speed
6.3. Mass Transit
6.4. Heavy Haul
6.5. Light
7. Global Track Geometry Market Analysis and Forecast, By Measurement Type
7.1. Segment Overview
7.2. Twist
7.3. Vertical Profile
7.4. Dipped Joints
7.5. Dynamic Cross-Level
7.6. Gauge
7.7. Alignment
7.8. Others
8. Global Track Geometry Market Analysis and Forecast, By Operation Type
8.1. Segment Overview
8.2. Contact
8.3. No Contact
9. Global Track Geometry Market Analysis and Forecast, By Regional Analysis
9.1. Segment Overview
9.2. North America
9.2.1. U.S.
9.2.2. Canada
9.2.3. Mexico
9.3. Europe
9.3.1. Germany
9.3.2. France
9.3.3. U.K.
9.3.4. Italy
9.3.5. Spain
9.4. Asia-Pacific
9.4.1. Japan
9.4.2. China
9.4.3. India
9.5. South America
9.5.1. Brazil
9.6. Middle East and Africa
9.6.1. UAE
9.6.2. South Africa
10. Global Track Geometry Market-Competitive Landscape
10.1. Overview
10.2. Market Share of Key Players in the Track Geometry Market
10.2.1. Global Company Market Share
10.2.2. North America Company Market Share
10.2.3. Europe Company Market Share
10.2.4. APAC Company Market Share
10.3. Competitive Situations and Trends
10.3.1. Product Launches and Developments
10.3.2. Partnerships, Collaborations, and Agreements
10.3.3. Mergers & Acquisitions
10.3.4. Expansions
11. Company Profiles
11.1. Amberg Technologies
11.1.1. Business Overview
11.1.2. Company Snapshot
11.1.3. Company Market Share Analysis
11.1.4. Company Product Portfolio
11.1.5. Recent Developments
11.1.6. SWOT Analysis
11.2. Balfour Beatty plc.
11.2.1. Business Overview
11.2.2. Company Snapshot
11.2.3. Company Market Share Analysis
11.2.4. Company Product Portfolio
11.2.5. Recent Developments
11.2.6. SWOT Analysis
11.3. Bentley System Inc
11.3.1. Business Overview
11.3.2. Company Snapshot
11.3.3. Company Market Share Analysis
11.3.4. Company Product Portfolio
11.3.5. Recent Developments
11.3.6. SWOT Analysis
11.4. Egis Group.
11.4.1. Business Overview
11.4.2. Company Snapshot
11.4.3. Company Market Share Analysis
11.4.4. Company Product Portfolio
11.4.5. Recent Developments
11.4.6. SWOT Analysis
11.5. Ensco Inc
11.5.1. Business Overview
11.5.2. Company Snapshot
11.5.3. Company Market Share Analysis
11.5.4. Company Product Portfolio
11.5.5. Recent Developments
11.5.6. SWOT Analysis
11.6. Furgo Inc
11.6.1. Business Overview
11.6.2. Company Snapshot
11.6.3. Company Market Share Analysis
11.6.4. Company Product Portfolio
11.6.5. Recent Developments
11.6.6. SWOT Analysis
11.7. Goldschmidt Thermit Group.
11.7.1. Business Overview
11.7.2. Company Snapshot
11.7.3. Company Market Share Analysis
11.7.4. Company Product Portfolio
11.7.5. Recent Developments
11.7.6. SWOT Analysis
11.8. Harsco Corporation
11.8.1. Business Overview
11.8.2. Company Snapshot
11.8.3. Company Market Share Analysis
11.8.4. Company Product Portfolio
11.8.5. Recent Developments
11.8.6. SWOT Analysis
11.9. Hitachi Corporation
11.9.1. Business Overview
11.9.2. Company Snapshot
11.9.3. Company Market Share Analysis
11.9.4. Company Product Portfolio
11.9.5. Recent Developments
11.9.6. SWOT Analysis
11.10. Holland Lp.
11.10.1. Business Overview
11.10.2. Company Snapshot
11.10.3. Company Market Share Analysis
11.10.4. Company Product Portfolio
11.10.5. Recent Developments
11.10.6. SWOT Analysis
11.11. Mermec Inc.
11.11.1. Business Overview
11.11.2. Company Snapshot
11.11.3. Company Market Share Analysis
11.11.4. Company Product Portfolio
11.11.5. Recent Developments
11.11.6. SWOT Analysis
11.12. Plasser & Theurer.,
11.12.1. Business Overview
11.12.2. Company Snapshot
11.12.3. Company Market Share Analysis
11.12.4. Company Product Portfolio
11.12.5. Recent Developments
11.12.6. SWOT Analysis
11.13. R Bance & Co Ltd
11.13.1. Business Overview
11.13.2. Company Snapshot
11.13.3. Company Market Share Analysis
11.13.4. Company Product Portfolio
11.13.5. Recent Developments
11.13.6. SWOT Analysis
11.14. Siemens AG
11.14.1. Business Overview
11.14.2. Company Snapshot
11.14.3. Company Market Share Analysis
11.14.4. Company Product Portfolio
11.14.5. Recent Developments
11.14.6. SWOT Analysis
11.15. Zg Optique Sa
11.15.1. Business Overview
11.15.2. Company Snapshot
11.15.3. Company Market Share Analysis
11.15.4. Company Product Portfolio
11.15.5. Recent Developments
11.15.6. SWOT Analysis
List of Table
1. Global Track Geometry Market, By Railway Type , 2019-2032 (USD Billion)
2. Global High-Speed Track Geometry Market, By Region, 2019-2032 (USD Billion)
3. Global Mass Transit Track Geometry Market, By Region, 2019-2032 (USD Billion)
4. Global Heavy Haul Track Geometry Market, By Region, 2019-2032 (USD Billion)
5. Global Light Track Geometry Market, By Region, 2019-2032 (USD Billion)
6. Global Upright Track Geometry Market, By Region, 2019-2032 (USD Billion)
7. Global Track Geometry Market, By Measurement Type, 2019-2032 (USD Billion)
8. Global Twist Track Geometry Market, By Region, 2019-2032 (USD Billion)
9. Global Vertical Profile Track Geometry Market, By Region, 2019-2032 (USD Billion)
10. Global Dipped Joints Track Geometry Market, By Region, 2019-2032 (USD Billion)
11. Global Dynamic Cross-Level Track Geometry Market, By Region, 2019-2032 (USD Billion)
12. Global Gauge Track Geometry Market, By Region, 2019-2032 (USD Billion)
13. Global Alignment Track Geometry Market, By Region, 2019-2032 (USD Billion)
14. Global Others Track Geometry Market, By Region, 2019-2032 (USD Billion)
15. Global Track Geometry Market, By Operation Type, 2019-2032 (USD Billion)
16. Global Contact Track Geometry Market, By Region, 2019-2032 (USD Billion)
17. Global No Contact Track Geometry Market, By Region, 2019-2032 (USD Billion)
18. North America Track Geometry Market, By Railway Type , 2019-2032 (USD Billion)
19. North America Track Geometry Market, By Measurement Type, 2019-2032 (USD Billion)
20. North America Track Geometry Market, By Operation Type, 2019-2032 (USD Billion)
21. U.S. Track Geometry Market, By Railway Type , 2019-2032 (USD Billion)
22. U.S. Track Geometry Market, By Measurement Type, 2019-2032 (USD Billion)
23. U.S. Track Geometry Market, By Operation Type, 2019-2032 (USD Billion)
24. Canada Track Geometry Market, By Railway Type , 2019-2032 (USD Billion)
25. Canada Track Geometry Market, By Measurement Type, 2019-2032 (USD Billion)
26. Canada Track Geometry Market, By Operation Type, 2019-2032 (USD Billion)
27. Mexico Track Geometry Market, By Railway Type , 2019-2032 (USD Billion)
28. Mexico Track Geometry Market, By Measurement Type, 2019-2032 (USD Billion)
29. Mexico Track Geometry Market, By Operation Type, 2019-2032 (USD Billion)
30. Europe Track Geometry Market, By Railway Type , 2019-2032 (USD Billion)
31. Europe Track Geometry Market, By Measurement Type, 2019-2032 (USD Billion)
32. Europe Track Geometry Market, By Operation Type, 2019-2032 (USD Billion)
33. Germany Track Geometry Market, By Railway Type , 2019-2032 (USD Billion)
34. Germany Track Geometry Market, By Measurement Type, 2019-2032 (USD Billion)
35. Germany Track Geometry Market, By Operation Type, 2019-2032 (USD Billion)
36. France Track Geometry Market, By Railway Type 2019-2032 (USD Billion)
37. France Track Geometry Market, By Measurement Type, 2019-2032 (USD Billion)
38. France Track Geometry Market, By Operation Type, 2019-2032 (USD Billion)
39. U.K. Track Geometry Market, By Railway Type , 2019-2032 (USD Billion)
40. U.K. Track Geometry Market, By Measurement Type, 2019-2032 (USD Billion)
41. U.K. Track Geometry Market, By Operation Type, 2019-2032 (USD Billion)
42. Italy Track Geometry Market, By Railway Type , 2019-2032 (USD Billion)
43. Italy Track Geometry Market, By Measurement Type, 2019-2032 (USD Billion)
44. Italy Track Geometry Market, By Operation Type, 2019-2032 (USD Billion)
45. Spain Track Geometry Market, By Railway Type , 2019-2032 (USD Billion)
46. Spain Track Geometry Market, By Measurement Type, 2019-2032 (USD Billion)
47. Spain Track Geometry Market, By Operation Type, 2019-2032 (USD Billion)
48. Asia Pacific Track Geometry Market, By Railway Type , 2019-2032 (USD Billion)
49. Asia Pacific Track Geometry Market, By Measurement Type, 2019-2032 (USD Billion)
50. Asia Pacific Track Geometry Market, By Operation Type, 2019-2032 (USD Billion)
51. Japan Track Geometry Market, By Railway Type , 2019-2032 (USD Billion)
52. Japan Track Geometry Market, By Measurement Type, 2019-2032 (USD Billion)
53. Japan Track Geometry Market, By Operation Type, 2019-2032 (USD Billion)
54. China Track Geometry Market, By Railway Type 2019-2032 (USD Billion)
55. China Track Geometry Market, By Measurement Type, 2019-2032 (USD Billion)
56. China Track Geometry Market, By Operation Type, 2019-2032 (USD Billion)
57. India Track Geometry Market, By Railway Type 2019-2032 (USD Billion)
58. India Track Geometry Market, By Measurement Type, 2019-2032 (USD Billion)
59. India Track Geometry Market, By Operation Type, 2019-2032 (USD Billion)
60. South America Track Geometry Market, By Railway Type , 2019-2032 (USD Billion)
61. South America Track Geometry Market, By Measurement Type, 2019-2032 (USD Billion)
62. South America Track Geometry Market, By Operation Type, 2019-2032 (USD Billion)
63. Brazil Track Geometry Market, By Railway Type 2019-2032 (USD Billion)
64. Brazil Track Geometry Market, By Measurement Type, 2019-2032 (USD Billion)
65. Brazil Track Geometry Market, By Operation Type, 2019-2032 (USD Billion)
66. Middle East and Africa Track Geometry Market, By Railway Type , 2019-2032 (USD Billion)
67. Middle East and Africa Track Geometry Market, By Measurement Type, 2019-2032 (USD Billion)
68. Middle East and Africa Track Geometry Market, By Operation Type, 2019-2032 (USD Billion)
69. UAE Track Geometry Market, By Railway Type , 2019-2032 (USD Billion)
70. UAE Track Geometry Market, By Measurement Type, 2019-2032 (USD Billion)
71. UAE Track Geometry Market, By Operation Type, 2019-2032 (USD Billion)
72. South Africa Track Geometry Market, By Railway Type 2019-2032 (USD Billion)
73. South Africa Track Geometry Market, By Measurement Type, 2019-2032 (USD Billion)
74. South Africa Track Geometry Market, By Operation Type, 2019-2032 (USD Billion)
List of Figures
1. Global Track Geometry Market Segmentation
2. Track Geometry Market: Research Methodology
3. Market Size Estimation Methodology: Bottom-Up Approach
4. Market Size Estimation Methodology: Top-Down Approach
5. Data Triangulation
6. Porter’s Five Forces Analysis
7. Value Chain Analysis
8. Global Track Geometry Market Attractiveness Analysis By Railway Type
9. Global Track Geometry Market Attractiveness Analysis by Measurement Type
10. Global Track Geometry Market Attractiveness Analysis by Operation Type
11. Global Track Geometry Market Attractiveness Analysis by Region
12. Global Track Geometry Market: Dynamics
13. Global Track Geometry Market Share By Railway Type (2022 & 2032)
14. Global Track Geometry Market Share by Measurement Type (2022 & 2032)
15. Global Track Geometry Market Share by Operation Type (2022 & 2032)
16. Global Track Geometry Market Share by Regions (2022 & 2032)
17. Global Track Geometry Market Share by Company (2022)
This study forecasts revenue at global, regional, and country levels from 2019 to 2032. The Brainy Insights has segmented the global track geometry market based on below mentioned segments:
Global Track Geometry Market Railway Type:
Global Track Geometry Market Measurement Type:
Global Track Geometry Market Operation Type:
Global Track Geometry Market by Region:
Research has its special purpose to undertake marketing efficiently. In this competitive scenario, businesses need information across all industry verticals; the information about customer wants, market demand, competition, industry trends, distribution channels etc. This information needs to be updated regularly because businesses operate in a dynamic environment. Our organization, The Brainy Insights incorporates scientific and systematic research procedures in order to get proper market insights and industry analysis for overall business success. The analysis consists of studying the market from a miniscule level wherein we implement statistical tools which helps us in examining the data with accuracy and precision.
Our research reports feature both; quantitative and qualitative aspects for any market. Qualitative information for any market research process are fundamental because they reveal the customer needs and wants, usage and consumption for any product/service related to a specific industry. This in turn aids the marketers/investors in knowing certain perceptions of the customers. Qualitative research can enlighten about the different product concepts and designs along with unique service offering that in turn, helps define marketing problems and generate opportunities. On the other hand, quantitative research engages with the data collection process through interviews, e-mail interactions, surveys and pilot studies. Quantitative aspects for the market research are useful to validate the hypotheses generated during qualitative research method, explore empirical patterns in the data with the help of statistical tools, and finally make the market estimations.
The Brainy Insights offers comprehensive research and analysis, based on a wide assortment of factual insights gained through interviews with CXOs and global experts and secondary data from reliable sources. Our analysts and industry specialist assume vital roles in building up statistical tools and analysis models, which are used to analyse the data and arrive at accurate insights with exceedingly informative research discoveries. The data provided by our organization have proven precious to a diverse range of companies, facilitating them to address issues such as determining which products/services are the most appealing, whether or not customers use the product in the manner anticipated, the purchasing intentions of the market and many others.
Our research methodology encompasses an idyllic combination of primary and secondary initiatives. Key phases involved in this process are listed below:

The phase involves the gathering and collecting of market data and its related information with the help of different sources & research procedures.

The data procurement stage involves in data gathering and collecting through various data sources.
This stage involves in extensive research. These data sources includes:
Purchased Database: Purchased databases play a crucial role in estimating the market sizes irrespective of the domain. Our purchased database includes:
Primary Research: The Brainy Insights interacts with leading companies and experts of the concerned domain to develop the analyst team’s market understanding and expertise. It improves and substantiates every single data presented in the market reports. Primary research mainly involves in telephonic interviews, E-mail interactions and face-to-face interviews with the raw material providers, manufacturers/producers, distributors, & independent consultants. The interviews that we conduct provides valuable data on market size and industry growth trends prevailing in the market. Our organization also conducts surveys with the various industry experts in order to gain overall insights of the industry/market. For instance, in healthcare industry we conduct surveys with the pharmacists, doctors, surgeons and nurses in order to gain insights and key information of a medical product/device/equipment which the customers are going to usage. Surveys are conducted in the form of questionnaire designed by our own analyst team. Surveys plays an important role in primary research because surveys helps us to identify the key target audiences of the market. Additionally, surveys helps to identify the key target audience engaged with the market. Our survey team conducts the survey by targeting the key audience, thus gaining insights from them. Based on the perspectives of the customers, this information is utilized to formulate market strategies. Moreover, market surveys helps us to understand the current competitive situation of the industry. To be precise, our survey process typically involve with the 360 analysis of the market. This analytical process begins by identifying the prospective customers for a product or service related to the market/industry to obtain data on how a product/service could fit into customers’ lives.

Secondary Research: The secondary data sources includes information published by the on-profit organizations such as World bank, WHO, company fillings, investor presentations, annual reports, national government documents, statistical databases, blogs, articles, white papers and others. From the annual report, we analyse a company’s revenue to understand the key segment and market share of that organization in a particular region. We analyse the company websites and adopt the product mapping technique which is important for deriving the segment revenue. In the product mapping method, we select and categorize the products offered by the companies catering to domain specific market, deduce the product revenue for each of the companies so as to get overall estimation of the market size. We also source data and analyses trends based on information received from supply side and demand side intermediaries in the value chain. The supply side denotes the data gathered from supplier, distributor, wholesaler and the demand side illustrates the data gathered from the end customers for respective market domain.

The supply side for a domain specific market is analysed by:
The demand side for the market is estimated through:
In-house Library: Apart from these third-party sources, we have our in-house library of qualitative and quantitative information. Our in-house database includes market data for various industry and domains. These data are updated on regular basis as per the changing market scenario. Our library includes, historic databases, internal audit reports and archives.
Sometimes there are instances where there is no metadata or raw data available for any domain specific market. For those cases, we use our expertise to forecast and estimate the market size in order to generate comprehensive data sets. Our analyst team adopt a robust research technique in order to produce the estimates:
Data Synthesis: This stage involves the analysis & mapping of all the information obtained from the previous step. It also involves in scrutinizing the data for any discrepancy observed while data gathering related to the market. The data is collected with consideration to the heterogeneity of sources. Robust scientific techniques are in place for synthesizing disparate data sets and provide the essential contextual information that can orient market strategies. The Brainy Insights has extensive experience in data synthesis where the data passes through various stages:


Market Deduction & Formulation: The final stage comprises of assigning data points at appropriate market spaces so as to deduce feasible conclusions. Analyst perspective & subject matter expert based holistic form of market sizing coupled with industry analysis also plays a crucial role in this stage.
This stage involves in finalization of the market size and numbers that we have collected from data integration step. With data interpolation, it is made sure that there is no gap in the market data. Successful trend analysis is done by our analysts using extrapolation techniques, which provide the best possible forecasts for the market.
Data Validation & Market Feedback: Validation is the most important step in the process. Validation & re-validation via an intricately designed process helps us finalize data-points to be used for final calculations.

The Brainy Insights interacts with leading companies and experts of the concerned domain to develop the analyst team’s market understanding and expertise. It improves and substantiates every single data presented in the market reports. The data validation interview and discussion panels are typically composed of the most experienced industry members. The participants include, however, are not limited to:
Moreover, we always validate our data and findings through primary respondents from all the major regions we are working on.


Free Customization
Fortune 500 Clients
Free Yearly Update On Purchase Of Multi/Corporate License
Companies Served Till Date