- +1-315-215-1633
- sales@thebrainyinsights.com

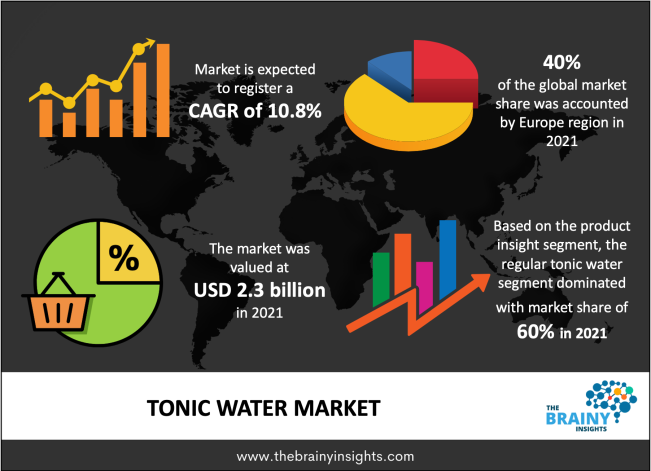
The / market size was valued at USD 2.3 billion in 2021 and is anticipated to grow at a CAGR of 10.8% from 2022 to 2030. The increasing trend of DIY cocktails at home is propelling the demand for this market. Moreover, rising consumer focus on low-calorie drinks such as gin and tequila is expected to boost the demand. Most consumers drink gin & tonic, while others also prefer vodka & tonic. These combinations are extremely popular among female drinkers.
The per capita consumption of gin is high in countries including Spain, Belgium, Netherlands, the UK, Ireland, the US, and Canada, which is driving the demand for tonic water in these countries. According to the IWSR report, gin has reinvented itself and its demand has been increasing in countries like the UK, South Africa, and Nigeria owing to the trend of premiumization of drinks, which has led to increased demand for tonic water.
The covid-19 pandemic negatively impacted the tonic water market as a sale through on-trade distribution channels such as bars & clubs showed a downward trend because of lockdown restrictions in countries across various regions. However, the demand through the off-trade channel including e-commerce platforms witnessed an upward trend as consumers were crafting their cocktails & mocktails at home.
Get an overview of this study by requesting a free sample
Increasing sophistication in the taste and preference of consumers is propelling the demand for tonic water. Millennials & Gen Z are shifting to food & beverages that offer a premium experience to them, owing to rising spending capacity and growing attraction towards premium brands. Fever-Tree and Fentimans are the leading players that offer premium tonic water to consumers with herbal infusions.
Mixers are very popular among women in comparison to men across all geographies. Most women like to drink gin or vodka base cocktails, in which the primary mixer used is tonic water. As women are more focused on health & weight management, they prefer diet tonic water as a mixer. Some of the popular cocktails/drinks consumed by women include gin & tonic, spiced tonic, and vodka & tonic.
Regular tonic water accounted for a larger market share of more than 60% in 2021. Regular tonic water has added sugar that makes it a little unhealthy for consumers. Previously, regular tonic water had a slightly lower price than diet tonic water, but as awareness is increasing among consumers about the benefits of drinking diet tonic water, prices of both products have become similar. For instance, Walmart offers both Great Value Tonic Water and Great Value Diet Tonic Water for USD 0.92 per 33.8 fl oz bottle.
The light or diet tonic water is anticipated to witness a higher CAGR of 12.0% from 2022-2030. Light tonic water has been gaining traction among health-conscious consumers, which are regulating their calorie intake. As consumers are switching to the healthier mixer, the demand for low-calorie tonic water is likely to fuel in the coming years. For instance, Fever-Tree offers premium light tonic water that contains only 30 calories per 200 ml bottle. Such product offerings are likely to boost the segment’s growth.
The flavored tonic water is anticipated to witness a higher CAGR of 11.6% from 2022-2030. The key players are adding new & exciting flavors to tonic water owing to rising demand from consumers. Furthermore, increasing focus on research & devolvement for product innovation to stay ahead and connected to the target audience is also expected to boost the market growth. Some of the flavors that are available in tonic water include cucumber, elderflower, lemon, and berries. Moreover, new product launches are expected to boost market growth further. For instance, in May 2022, Gloucestershire Farm launched the organic tonic water in the UK, which is available in flavors- cucumber, wild elderflower, and Damascena rose.
The unflavored tonic water held a larger market share of more than 65% in 2021. The unflavored tonic water has only quinine, which imparts a slightly bitter taste to it. This tonic water is frequently paired with gin and other white spirits like vodka and tequila. It pairs well with juice, cocktails, & mocktails and is an alternative to high-calorie carbonated soft drinks. The increasing popularity of unflavored tonic water in developing countries like India, The Philippines, and Indonesia is expected to boost the segment’s growth.
The off-trade distribution channel held a larger market share of more than 50% in 2021. Most consumers keep tonic water in stock in their pantries like other beverages such as soda & beer, which drives sales through supermarkets & hypermarkets. The availability of a wide range of products under a single roof influences consumers to purchase through these stores. The rising popularity of e-commerce platforms for shopping grocery & other household items is likely to drive the sale of tonic water through e-commerce platforms like Amazon, Blinkit, Dan Murphys. Harris Farm, Instacart, Drizly, and Walmart online.
The on-trade distribution channel is anticipated to grow at a higher CAGR during the forecast period. The cocktail culture among millennials has increased, which is propelling the demand for tonic water for mixing with a wide range of spirits. Furthermore, increasing product offering by bars & pubs is likely to boost demand. Aatxe, Bathtub Gin, The Gin Joint, and Marvel Bar are a few prominent bars in the US that offer specialty cocktails.
Europe led the market with a share of more than 40% in 2021. Gin is widely consumed in European countries such as the UK, Spain, Netherlands, and Ireland, which has driven the demand for tonic water in this region. The rising demand for new flavors has led manufacturers to offer premium new flavors. For instance, in November 2021, Arctic Beverages launched an artisan tonic water. It has been made from Finnish groundwater and is low in calories & sugar. Similarly, in March 2022, Schweppes launched tonic water in 600 ml glass bottles. According to the company, the larger bottle of 600 ml was created in response to an increase in at-home consumption post-pandemic.
Asia Pacific is expected to register the fastest growth during the forecast period owing to increasing demand for cocktails and non-wheat based alcoholic drinks among consumers. Moreover, product launches and distribution expansion in the countries like India and Indonesia is likely to propel the market further. For instance, the PEER tonic water brand expanded in Uttrakhand, Maharashtra, Karnataka, and West Bengal in June 2022. The brand was previously available in Delhi NCR & Punjab across various retail stores.
The tonic water market has a strong presence of leading players including Keurig Dr. Pepper Inc., Fever-Tree, Q MIXERS, and Fentimans. The new players are trying to enter this market with product innovation and flavor enhancement. The companies are focused to offer tonic water with an infusion of aromatic & herbal flavors, owing to increasing consumer demand for such flavors.
Segments Covered in the Report
1. Introduction
1.1. Objectives of the Study
1.2. Market Definition
1.3. Research Scope
1.4. Currency
1.5. Key Target Audience
2. Research Methodology and Assumptions
3. Executive Summary
4. Premium Insights
4.1. Porter’s Five Forces Analysis
4.2. Value Chain Analysis
4.3. Top Investment Pockets
4.3.1. Market Attractiveness Analysis by Product
4.3.2. Market Attractiveness Analysis by Flavor
4.3.3. Market Attractiveness Analysis by Distribution Channel
4.3.4. Market Attractiveness Analysis by Region
4.4. Industry Trends
5. Market Dynamics
5.1. Market Evaluation
5.2. Drivers
5.2.1. Increasing trend of DIY cocktails
5.2.2. Rising consumer focus on low-calorie drinks
5.3. Restraints
5.3.1. The lack of awareness of the health benefits of tonic water
5.4. Opportunities
5.4.1. Rising disposable income
5.4.2. Rapid urbanisation
6. Global Tonic Water Market Analysis and Forecast, By Product
6.1. Segment Overview
6.2. Light/Diet
6.3. Regular
7. Global Tonic Water Market Analysis and Forecast, By Flavor
7.1. Segment Overview
7.2. Flavored
7.3. Unflavored
8. Global Tonic Water Market Analysis and Forecast, By Distribution Channel
8.1. Segment Overview
8.2. Off-Trade
8.2.1. Supermarkets & Hypermarkets
8.2.2. Online
8.2.3. Others
8.3. On-Trade
9. Global Tonic Water Market Analysis and Forecast, By Regional Analysis
9.1. Segment Overview
9.2. North America
9.2.1. U.S.
9.2.2. Canada
9.2.3. Mexico
9.3. Europe
9.3.1. Germany
9.3.2. France
9.3.3. U.K.
9.3.4. Italy
9.3.5. Spain
9.4. Asia-Pacific
9.4.1. Japan
9.4.2. China
9.4.3. India
9.5. South America
9.5.1. Brazil
9.6. Middle East and Africa
9.6.1. UAE
9.6.2. South Africa
10. Global Tonic Water Market-Competitive Landscape
10.1. Overview
10.2. Market Share of Key Players in the Tonic Water Market
10.2.1. Global Company Market Share
10.2.2. North America Company Market Share
10.2.3. Europe Company Market Share
10.2.4. APAC Company Market Share
10.3. Competitive Situations and Trends
10.3.1. Product Launches and Developments
10.3.2. Partnerships, Collaborations, and Agreements
10.3.3. Mergers & Acquisitions
10.3.4. Expansions
11. Company Profiles
11.1. Keurig Dr Pepper Inc.
11.1.1. Business Overview
11.1.2. Company Snapshot
11.1.3. Company Market Share Analysis
11.1.4. Company Product Portfolio
11.1.5. Recent Developments
11.1.6. SWOT Analysis
11.2. Fever-Tree
11.2.1. Business Overview
11.2.2. Company Snapshot
11.2.3. Company Market Share Analysis
11.2.4. Company Product Portfolio
11.2.5. Recent Developments
11.2.6. SWOT Analysis
11.3. Fentimans
11.3.1. Business Overview
11.3.2. Company Snapshot
11.3.3. Company Market Share Analysis
11.3.4. Company Product Portfolio
11.3.5. Recent Developments
11.3.6. SWOT Analysis
11.4. SEPOY & CO.
11.4.1. Business Overview
11.4.2. Company Snapshot
11.4.3. Company Market Share Analysis
11.4.4. Company Product Portfolio
11.4.5. Recent Developments
11.4.6. SWOT Analysis
11.5. Zevia
11.5.1. Business Overview
11.5.2. Company Snapshot
11.5.3. Company Market Share Analysis
11.5.4. Company Product Portfolio
11.5.5. Recent Developments
11.5.6. SWOT Analysis
11.6. Q MIXERS
11.6.1. Business Overview
11.6.2. Company Snapshot
11.6.3. Company Market Share Analysis
11.6.4. Company Product Portfolio
11.6.5. Recent Developments
11.6.6. SWOT Analysis
11.7. East Imperial Beverage Corporation
11.7.1. Business Overview
11.7.2. Company Snapshot
11.7.3. Company Market Share Analysis
11.7.4. Company Product Portfolio
11.7.5. Recent Developments
11.7.6. SWOT Analysis
11.8. Svami
11.8.1. Business Overview
11.8.2. Company Snapshot
11.8.3. Company Market Share Analysis
11.8.4. Company Product Portfolio
11.8.5. Recent Developments
11.8.6. SWOT Analysis
11.9. Three Cents
11.9.1. Business Overview
11.9.2. Company Snapshot
11.9.3. Company Market Share Analysis
11.9.4. Company Product Portfolio
11.9.5. Recent Developments
11.9.6. SWOT Analysis
11.10. Polar Beverages
11.10.1. Business Overview
11.10.2. Company Snapshot
11.10.3. Company Market Share Analysis
11.10.4. Company Product Portfolio
11.10.5. Recent Developments
11.10.6. SWOT Analysis
11.11. StrangeLove
11.11.1. Business Overview
11.11.2. Company Snapshot
11.11.3. Company Market Share Analysis
11.11.4. Company Product Portfolio
11.11.5. Recent Developments
11.11.6. SWOT Analysis
11.12. Fitch & Leedes
11.12.1. Business Overview
11.12.2. Company Snapshot
11.12.3. Company Market Share Analysis
11.12.4. Company Product Portfolio
11.12.5. Recent Developments
11.12.6. SWOT Analysis
11.13. CAPI
11.13.1. Business Overview
11.13.2. Company Snapshot
11.13.3. Company Market Share Analysis
11.13.4. Company Product Portfolio
11.13.5. Recent Developments
11.13.6. SWOT Analysis
11.14. White Rock Beverages
11.14.1. Business Overview
11.14.2. Company Snapshot
11.14.3. Company Market Share Analysis
11.14.4. Company Product Portfolio
11.14.5. Recent Developments
11.14.6. SWOT Analysis
11.15. The Great Gentleman
11.15.1. Business Overview
11.15.2. Company Snapshot
11.15.3. Company Market Share Analysis
11.15.4. Company Product Portfolio
11.15.5. Recent Developments
11.15.6. SWOT Analysis
List of Table
1. Global Tonic Water Market, By Product, 2019-2030 (USD Billion)
2. Global Light/Diet Tonic Water Market, By Region, 2019-2030 (USD Billion)
3. Global Regular Tonic Water Market, By Region, 2019-2030 (USD Billion)
4. Global Tonic Water Market, By Flavor, 2019-2030 (USD Billion)
5. Global Flavored Tonic Water Market, By Region, 2019-2030 (USD Billion)
6. Global Unflavored Tonic Water Market, By Region, 2019-2030 (USD Billion)
7. Global Tonic Water Market, By Distribution Channel, 2019-2030 (USD Billion)
8. Global Off-Trade Tonic Water Market, By Region, 2019-2030 (USD Billion)
9. Global On-Trade Tonic Water Market, By Region, 2019-2030 (USD Billion)
10. Global Tonic Water Market, By Region, 2019-2030 (USD Billion)
11. North America Tonic Water Market, By Product, 2019-2030 (USD Billion)
12. North America Tonic Water Market, By Flavor, 2019-2030 (USD Billion)
13. North America Tonic Water Market, By Distribution Channel, 2019-2030 (USD Billion)
14. U.S. Tonic Water Market, By Product, 2019-2030 (USD Billion)
15. U.S. Tonic Water Market, By Flavor, 2019-2030 (USD Billion)
16. U.S. Tonic Water Market, By Distribution Channel, 2019-2030 (USD Billion)
17. Canada Tonic Water Market, By Product, 2019-2030 (USD Billion)
18. Canada Tonic Water Market, By Flavor, 2019-2030 (USD Billion)
19. Canada Tonic Water Market, By Distribution Channel, 2019-2030 (USD Billion)
20. Mexico Tonic Water Market, By Product, 2019-2030 (USD Billion)
21. Mexico Tonic Water Market, By Flavor, 2019-2030 (USD Billion)
22. Mexico Tonic Water Market, By Distribution Channel, 2019-2030 (USD Billion)
23. Europe Tonic Water Market, By Product, 2019-2030 (USD Billion)
24. Europe Tonic Water Market, By Flavor, 2019-2030 (USD Billion)
25. Europe Tonic Water Market, By Distribution Channel, 2019-2030 (USD Billion)
26. Germany Tonic Water Market, By Product, 2019-2030 (USD Billion)
27. Germany Tonic Water Market, By Flavor, 2019-2030 (USD Billion)
28. Germany Tonic Water Market, By Distribution Channel, 2019-2030 (USD Billion)
29. France Tonic Water Market, By Product, 2019-2030 (USD Billion)
30. France Tonic Water Market, By Flavor, 2019-2030 (USD Billion)
31. France Tonic Water Market, By Distribution Channel, 2019-2030 (USD Billion)
32. U.K. Tonic Water Market, By Product, 2019-2030 (USD Billion)
33. U.K. Tonic Water Market, By Flavor, 2019-2030 (USD Billion)
34. U.K. Tonic Water Market, By Distribution Channel, 2019-2030 (USD Billion)
35. Italy Tonic Water Market, By Product, 2019-2030 (USD Billion)
36. Italy Tonic Water Market, By Flavor, 2019-2030 (USD Billion)
37. Italy Tonic Water Market, By Distribution Channel, 2019-2030 (USD Billion)
38. Spain Tonic Water Market, By Product, 2019-2030 (USD Billion)
39. Spain Tonic Water Market, By Flavor, 2019-2030 (USD Billion)
40. Spain Tonic Water Market, By Distribution Channel, 2019-2030 (USD Billion)
41. Asia Pacific Tonic Water Market, By Product, 2019-2030 (USD Billion)
42. Asia Pacific Tonic Water Market, By Flavor, 2019-2030 (USD Billion)
43. Asia Pacific Tonic Water Market, By Distribution Channel, 2019-2030 (USD Billion)
44. Japan Tonic Water Market, By Product, 2019-2030 (USD Billion)
45. Japan Tonic Water Market, By Flavor, 2019-2030 (USD Billion)
46. Japan Tonic Water Market, By Distribution Channel, 2019-2030 (USD Billion)
47. China Tonic Water Market, By Product, 2019-2030 (USD Billion)
48. China Tonic Water Market, By Flavor, 2019-2030 (USD Billion)
49. China Tonic Water Market, By Distribution Channel, 2019-2030 (USD Billion)
50. India Tonic Water Market, By Product, 2019-2030 (USD Billion)
51. India Tonic Water Market, By Flavor, 2019-2030 (USD Billion)
52. India Tonic Water Market, By Distribution Channel, 2019-2030 (USD Billion)
53. South America Tonic Water Market, By Product, 2019-2030 (USD Billion)
54. South America Tonic Water Market, By Flavor, 2019-2030 (USD Billion)
55. South America Tonic Water Market, By Distribution Channel, 2019-2030 (USD Billion)
56. Brazil Tonic Water Market, By Product, 2019-2030 (USD Billion)
57. Brazil Tonic Water Market, By Flavor, 2019-2030 (USD Billion)
58. Brazil Tonic Water Market, By Distribution Channel, 2019-2030 (USD Billion)
59. Middle East and Africa Tonic Water Market, By Product, 2019-2030 (USD Billion)
60. Middle East and Africa Tonic Water Market, By Flavor, 2019-2030 (USD Billion)
61. Middle East and Africa Tonic Water Market, By Distribution Channel, 2019-2030 (USD Billion)
62. UAE Tonic Water Market, By Product, 2019-2030 (USD Billion)
63. UAE Tonic Water Market, By Flavor, 2019-2030 (USD Billion)
64. UAE Tonic Water Market, By Distribution Channel, 2019-2030 (USD Billion)
65. South Africa Tonic Water Market, By Product, 2019-2030 (USD Billion)
66. South Africa Tonic Water Market, By Flavor, 2019-2030 (USD Billion)
67. South Africa Tonic Water Market, By Distribution Channel, 2019-2030 (USD Billion)
List of Figures
1. Global Tonic Water Market Segmentation
2. Tonic Water Market: Research Methodology
3. Market Size Estimation Methodology: Bottom-Up Approach
4. Market Size Estimation Methodology: Top-Down Approach
5. Data Triangulation
6. Porter’s Five Forces Analysis
7. Value Chain Analysis
8. Global Tonic Water Market Attractiveness Analysis by Product
9. Global Tonic Water Market Attractiveness Analysis by Flavor
10. Global Tonic Water Market Attractiveness Analysis by Distribution Channel
11. Global Tonic Water Market Attractiveness Analysis by Region
12. Global Tonic Water Market: Dynamics
13. Global Tonic Water Market Share by Product (2022 & 2030)
14. Global Tonic Water Market Share by Flavor (2022 & 2030)
15. Global Tonic Water Market Share by Distribution Channel (2022 & 2030)
16. Global Tonic Water Market Share by Regions (2022 & 2030)
17. Global Tonic Water Market Share by Company (2021)
Segments Covered in the Report
Research has its special purpose to undertake marketing efficiently. In this competitive scenario, businesses need information across all industry verticals; the information about customer wants, market demand, competition, industry trends, distribution channels etc. This information needs to be updated regularly because businesses operate in a dynamic environment. Our organization, The Brainy Insights incorporates scientific and systematic research procedures in order to get proper market insights and industry analysis for overall business success. The analysis consists of studying the market from a miniscule level wherein we implement statistical tools which helps us in examining the data with accuracy and precision.
Our research reports feature both; quantitative and qualitative aspects for any market. Qualitative information for any market research process are fundamental because they reveal the customer needs and wants, usage and consumption for any product/service related to a specific industry. This in turn aids the marketers/investors in knowing certain perceptions of the customers. Qualitative research can enlighten about the different product concepts and designs along with unique service offering that in turn, helps define marketing problems and generate opportunities. On the other hand, quantitative research engages with the data collection process through interviews, e-mail interactions, surveys and pilot studies. Quantitative aspects for the market research are useful to validate the hypotheses generated during qualitative research method, explore empirical patterns in the data with the help of statistical tools, and finally make the market estimations.
The Brainy Insights offers comprehensive research and analysis, based on a wide assortment of factual insights gained through interviews with CXOs and global experts and secondary data from reliable sources. Our analysts and industry specialist assume vital roles in building up statistical tools and analysis models, which are used to analyse the data and arrive at accurate insights with exceedingly informative research discoveries. The data provided by our organization have proven precious to a diverse range of companies, facilitating them to address issues such as determining which products/services are the most appealing, whether or not customers use the product in the manner anticipated, the purchasing intentions of the market and many others.
Our research methodology encompasses an idyllic combination of primary and secondary initiatives. Key phases involved in this process are listed below:

The phase involves the gathering and collecting of market data and its related information with the help of different sources & research procedures.

The data procurement stage involves in data gathering and collecting through various data sources.
This stage involves in extensive research. These data sources includes:
Purchased Database: Purchased databases play a crucial role in estimating the market sizes irrespective of the domain. Our purchased database includes:
Primary Research: The Brainy Insights interacts with leading companies and experts of the concerned domain to develop the analyst team’s market understanding and expertise. It improves and substantiates every single data presented in the market reports. Primary research mainly involves in telephonic interviews, E-mail interactions and face-to-face interviews with the raw material providers, manufacturers/producers, distributors, & independent consultants. The interviews that we conduct provides valuable data on market size and industry growth trends prevailing in the market. Our organization also conducts surveys with the various industry experts in order to gain overall insights of the industry/market. For instance, in healthcare industry we conduct surveys with the pharmacists, doctors, surgeons and nurses in order to gain insights and key information of a medical product/device/equipment which the customers are going to usage. Surveys are conducted in the form of questionnaire designed by our own analyst team. Surveys plays an important role in primary research because surveys helps us to identify the key target audiences of the market. Additionally, surveys helps to identify the key target audience engaged with the market. Our survey team conducts the survey by targeting the key audience, thus gaining insights from them. Based on the perspectives of the customers, this information is utilized to formulate market strategies. Moreover, market surveys helps us to understand the current competitive situation of the industry. To be precise, our survey process typically involve with the 360 analysis of the market. This analytical process begins by identifying the prospective customers for a product or service related to the market/industry to obtain data on how a product/service could fit into customers’ lives.

Secondary Research: The secondary data sources includes information published by the on-profit organizations such as World bank, WHO, company fillings, investor presentations, annual reports, national government documents, statistical databases, blogs, articles, white papers and others. From the annual report, we analyse a company’s revenue to understand the key segment and market share of that organization in a particular region. We analyse the company websites and adopt the product mapping technique which is important for deriving the segment revenue. In the product mapping method, we select and categorize the products offered by the companies catering to domain specific market, deduce the product revenue for each of the companies so as to get overall estimation of the market size. We also source data and analyses trends based on information received from supply side and demand side intermediaries in the value chain. The supply side denotes the data gathered from supplier, distributor, wholesaler and the demand side illustrates the data gathered from the end customers for respective market domain.

The supply side for a domain specific market is analysed by:
The demand side for the market is estimated through:
In-house Library: Apart from these third-party sources, we have our in-house library of qualitative and quantitative information. Our in-house database includes market data for various industry and domains. These data are updated on regular basis as per the changing market scenario. Our library includes, historic databases, internal audit reports and archives.
Sometimes there are instances where there is no metadata or raw data available for any domain specific market. For those cases, we use our expertise to forecast and estimate the market size in order to generate comprehensive data sets. Our analyst team adopt a robust research technique in order to produce the estimates:
Data Synthesis: This stage involves the analysis & mapping of all the information obtained from the previous step. It also involves in scrutinizing the data for any discrepancy observed while data gathering related to the market. The data is collected with consideration to the heterogeneity of sources. Robust scientific techniques are in place for synthesizing disparate data sets and provide the essential contextual information that can orient market strategies. The Brainy Insights has extensive experience in data synthesis where the data passes through various stages:


Market Deduction & Formulation: The final stage comprises of assigning data points at appropriate market spaces so as to deduce feasible conclusions. Analyst perspective & subject matter expert based holistic form of market sizing coupled with industry analysis also plays a crucial role in this stage.
This stage involves in finalization of the market size and numbers that we have collected from data integration step. With data interpolation, it is made sure that there is no gap in the market data. Successful trend analysis is done by our analysts using extrapolation techniques, which provide the best possible forecasts for the market.
Data Validation & Market Feedback: Validation is the most important step in the process. Validation & re-validation via an intricately designed process helps us finalize data-points to be used for final calculations.

The Brainy Insights interacts with leading companies and experts of the concerned domain to develop the analyst team’s market understanding and expertise. It improves and substantiates every single data presented in the market reports. The data validation interview and discussion panels are typically composed of the most experienced industry members. The participants include, however, are not limited to:
Moreover, we always validate our data and findings through primary respondents from all the major regions we are working on.


Free Customization
Fortune 500 Clients
Free Yearly Update On Purchase Of Multi/Corporate License
Companies Served Till Date