- +1-315-215-1633
- sales@thebrainyinsights.com

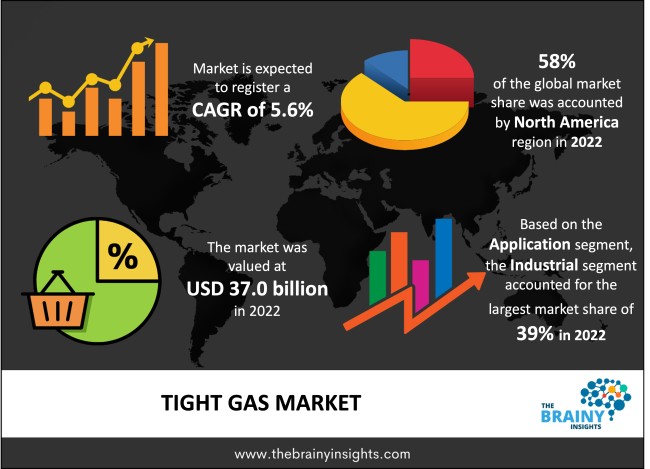
The global tight gas market was valued at USD 37.0 billion in 2022, growing at a CAGR of 5.6% from 2023 to 2032. The market is expected to reach USD 63.8 billion by 2032. Government initiatives encouraging clean fuel generation and implementing modern drilling technologies in various countries are expected to boost the market over the forecast period.
Tight gas, a type of natural gas, is regarded as a reliable energy source for power generation, accounting for the second-largest percentage of the world energy supply after coal. Tight gas's share is likely to rise in the following years due to coal power's environmental and economic restrictions, at least in nations where natural gas is a viable option. This high-end application is likely to have a positive impact on the tight gas market environment. Production and processing, gas transmission and storage, and distribution to big-volume consumers, residential users, and commercial customers are all part of the tight gas supply chain. Multi-stage hydraulic fracturing and horizontal drilling have enabled industry participants to generate natural gas from tight formations economically. The advancement of these innovative procedures is likely to boost the supply chain's upstream sector. Stable regulatory and fiscal policies, new technologies, lower drilling and healthy completion costs, and increased investment from international market participants are crucial determinants of the tight gas market competitiveness. Furthermore, the successful production of tight gas depends on the availability of demand markets for it, including electricity generation, the industrial thermal sector, the building thermal sector, and others.
Get an overview of this study by requesting a free sample
Repsol SA spent US$ 8.3 million (6.64 million euros) in 2015 to acquire 100% of Talisman Energy, a Canadian oil company. As a result of the transaction, Repsol became one of the world's largest energy firms, with operations in over 50 countries and over 27,000 employees. It also strengthened Repsol's position as an integrated firm with a more balanced and competitive business model resulting from a more robust asset portfolio comprising multiple high-quality assets in geopolitically stable nations.
Surge in Usage- Tight gas fulfils various functions, making it a lucrative resource expected to grow the global tight gas market. Flammable gas is used as an energy source in transportation and local areas. The transportation industry has supported the gaseous petrol market, increasing the number of CNG vehicles on the road. Over 24 million flammable petrol cars (NGVs) were used worldwide in 2017. All vehicles can run on petroleum gas, including cruisers, automobiles, vans, light and heavy trucks, transports, lift trucks and trains. As a result, all aspects contribute to the global market's success.
Environmental Issues- Market expansion is projected to be hampered by tight environmental regulations and lengthy government inspection and authorization issuing. In June 2019, Ascent Resources plc, based in the United Kingdom, failed to get the licences required to re-stimulate production in the company's existing producing wells, including the tight gas reservoirs in the Petisovci field. Tight gas extraction requires a lot of water and emits harmful contaminants throughout the drilling process. It has provoked significant environmental concerns and vociferous opposition from activist groups, effectively halting tight gas development in several viable reservoirs.
Rise in Government Policies- Increased government requirements for clean fuel generation and deploying contemporary drilling technologies in various countries are estimated to drive the market over the forecast period. Tight gas, a form of natural gas, is regarded as a reliable energy source for power generation, accounting for the second-highest percentage of the global energy supply after coal. Tight gas's share is expected to rise in the following years due to coal's environmental and economic constraints, at least in countries where natural gas is feasible.
The regions analyzed for the market include North America, Europe, South America, Asia Pacific, the Middle East, and Africa. North America emerged as the largest global tight gas market, with a 58% market revenue share in 2022.
US government investments, legislation, and subsidies for tight gas extraction have spurred the tight gas market. Furthermore, tight gas output is expected to rise over the forecast period due to technological advancements in the United States. Tight gas deposits in the Permian Basin, Anadarko, Niobrara, and Bakken fields are driving the industry in the region and using complex drilling methods. The United States leads the global tight gas market because of its vast tight gas deposits, superior drilling technology, and highly qualified workforce.
North America Region Tight Gas Market Share in 2022 - 58%
www.thebrainyinsights.com
Check the geographical analysis of this market by requesting a free sample
The application segment is divided into industrial, power generation, residential, commercial, and transportation. The industrial segment dominated the market, with a market share of around 39% in 2022. Tight gas growth is entirely dependent on gas usage in the industrial sector. It is currently utilised as a biofuel in producing fertilisers, chemicals, and various other commodities. This creates an opportunity for countries already exploiting it as a resource to increase industrial output in the following years.
| Attribute | Description |
|---|---|
| Market Size | Revenue (USD Billion) |
| Market size value in 2022 | USD 37.0 Billion |
| Market size value in 2032 | USD 63.8 Billion |
| CAGR (2023 to 2032) | 5.6% |
| Historical data | 2019-2021 |
| Base Year | 2022 |
| Forecast | 2023-2032 |
| Region | The regions analyzed for the market are Asia Pacific, Europe, South America, North America, and Middle East & Africa. Furthermore, the regions are further analyzed at the country level. |
| Segments | Application |
As per The Brainy Insights, the size of the tight gas market was valued at USD 37.0 billion in 2022 to USD 63.8 billion by 2032.
The global tight gas market is growing at a CAGR of 5.6% during the forecast period 2023-2032.
North America emerged as the largest tight gas market.
Key players in the tight gas market are Chevron Corporation, Royal Dutch Shell PLC, ConocoPhillips, Exxon Mobil Corporation, PetroChina Company Limited, and Equinor ASA.
1. Introduction
1.1. Objectives of the Study
1.2. Market Definition
1.3. Research Scope
1.4. Currency
1.5. Key Target Audience
2. Research Methodology and Assumptions
3. Executive Summary
4. Premium Insights
4.1. Porter’s Five Forces Analysis
4.2. Value Chain Analysis
4.3. Top Investment Pockets
4.3.1. Market Attractiveness Analysis by Application
4.3.2. Market Attractiveness Analysis by Region
4.4. Industry Trends
5. Market Dynamics
5.1. Market Evaluation
5.2. Drivers
5.2.1. Surge in usage
5.3. Restraints
5.3.1. Environmental issues
5.4. Opportunities
5.4.1. Rise in government policies
5.5. Challenges
5.5.1. Stringent laws
6. Global Tight Gas Market Analysis and Forecast, By Application
6.1. Segment Overview
6.2. Industrial
6.3. Power Generation
6.4. Residential
6.5. Commercial
6.6. Transportation
7. Global Tight Gas Market Analysis and Forecast, By Regional Analysis
7.1. Segment Overview
7.2. North America
7.2.1. U.S.
7.2.2. Canada
7.2.3. Mexico
7.3. Europe
7.3.1. Germany
7.3.2. France
7.3.3. U.K.
7.3.4. Italy
7.3.5. Spain
7.4. Asia-Pacific
7.4.1. Japan
7.4.2. China
7.4.3. India
7.5. South America
7.5.1. Brazil
7.6. Middle East and Africa
7.6.1. UAE
7.6.2. South Africa
8. Global Tight Gas Market-Competitive Landscape
8.1. Overview
8.2. Market Share of Key Players in Global Tight Gas Market
8.2.1. Global Company Market Share
8.2.2. North America Company Market Share
8.2.3. Europe Company Market Share
8.2.4. APAC Company Market Share
8.3. Competitive Situations and Trends
8.3.1. Product Launches and Developments
8.3.2. Partnerships, Collaborations, and Agreements
8.3.3. Mergers & Acquisitions
8.3.4. Expansions
9. Company Profiles
9.1. Chevron Corporation
9.1.1. Business Overview
9.1.2. Company Snapshot
9.1.3. Company Market Share Analysis
9.1.4. Company Product Portfolio
9.1.5. Recent Developments
9.1.6. SWOT Analysis
9.2. Royal Dutch Shell PLC
9.2.1. Business Overview
9.2.2. Company Snapshot
9.2.3. Company Market Share Analysis
9.2.4. Company Product Portfolio
9.2.5. Recent Developments
9.2.6. SWOT Analysis
9.3. ConocoPhillips
9.3.1. Business Overview
9.3.2. Company Snapshot
9.3.3. Company Market Share Analysis
9.3.4. Company Product Portfolio
9.3.5. Recent Developments
9.3.6. SWOT Analysis
9.4. Exxon Mobil Corporation
9.4.1. Business Overview
9.4.2. Company Snapshot
9.4.3. Company Market Share Analysis
9.4.4. Company Product Portfolio
9.4.5. Recent Developments
9.4.6. SWOT Analysis
9.5. PetroChina Company Limited
9.5.1. Business Overview
9.5.2. Company Snapshot
9.5.3. Company Market Share Analysis
9.5.4. Company Product Portfolio
9.5.5. Recent Developments
9.5.6. SWOT Analysis
9.6. Equinor ASA.
9.6.1. Business Overview
9.6.2. Company Snapshot
9.6.3. Company Market Share Analysis
9.6.4. Company Product Portfolio
9.6.5. Recent Developments
9.6.6. SWOT Analysis
List of Table
1. Global Tight Gas Market, By Application, 2019-2032 (USD Billion)
2. Global Industrial, Tight Gas Market, By Region, 2019-2032 (USD Billion)
3. Global Power Generation, Tight Gas Market, By Region, 2019-2032 (USD Billion)
4. Global Residential, Tight Gas Market, By Region, 2019-2032 (USD Billion)
5. Global Commercial, Tight Gas Market, By Region, 2019-2032 (USD Billion)
6. Global Transportation, Tight Gas Market, By Region, 2019-2032 (USD Billion)
7. North America Tight Gas Market, By Application, 2019-2032 (USD Billion)
8. U.S. Tight Gas Market, By Application, 2019-2032 (USD Billion)
9. Canada Tight Gas Market, By Application, 2019-2032 (USD Billion)
10. Mexico Tight Gas Market, By Application, 2019-2032 (USD Billion)
11. Europe Tight Gas Market, By Application, 2019-2032 (USD Billion)
12. Germany Tight Gas Market, By Application, 2019-2032 (USD Billion)
13. France Tight Gas Market, By Application, 2019-2032 (USD Billion)
14. U.K. Tight Gas Market, By Application, 2019-2032 (USD Billion)
15. Italy Tight Gas Market, By Application, 2019-2032 (USD Billion)
16. Spain Tight Gas Market, By Application, 2019-2032 (USD Billion)
17. Asia Pacific Tight Gas Market, By Application, 2019-2032 (USD Billion)
18. Japan Tight Gas Market, By Application, 2019-2032 (USD Billion)
19. China Tight Gas Market, By Application, 2019-2032 (USD Billion)
20. India Tight Gas Market, By Application, 2019-2032 (USD Billion)
21. South America Tight Gas Market, By Application, 2019-2032 (USD Billion)
22. Brazil Tight Gas Market, By Application, 2019-2032 (USD Billion)
23. Middle East and Africa Tight Gas Market, By Application, 2019-2032 (USD Billion)
24. UAE Tight Gas Market, By Application, 2019-2032 (USD Billion)
25. South Africa Tight Gas Market, By Application, 2019-2032 (USD Billion)
List of Figures
1. Global Tight Gas Market Segmentation
2. Global Tight Gas Market: Research Methodology
3. Market Size Estimation Methodology: Bottom-Up Approach
4. Market Size Estimation Methodology: Top-Down Approach
5. Data Triangulation
6. Porter’s Five Forces Analysis
7. Value Chain Analysis
8. Global Tight Gas Market Attractiveness Analysis by Application
9. Global Tight Gas Market Attractiveness Analysis by Region
10. Global Tight Gas Market: Dynamics
11. Global Tight Gas Market Share by Application (2023 & 2032)
12. Global Tight Gas Market Share by Regions (2023 & 2032)
13. Global Tight Gas Market Share by Company (2022)
This study forecasts global, regional, and country revenue from 2019 to 2032. The Brainy Insights has segmented the global tight gas market based on the below-mentioned segments:
Global Tight Gas Market By Application:
Global Tight Gas Market By Region:
Research has its special purpose to undertake marketing efficiently. In this competitive scenario, businesses need information across all industry verticals; the information about customer wants, market demand, competition, industry trends, distribution channels etc. This information needs to be updated regularly because businesses operate in a dynamic environment. Our organization, The Brainy Insights incorporates scientific and systematic research procedures in order to get proper market insights and industry analysis for overall business success. The analysis consists of studying the market from a miniscule level wherein we implement statistical tools which helps us in examining the data with accuracy and precision.
Our research reports feature both; quantitative and qualitative aspects for any market. Qualitative information for any market research process are fundamental because they reveal the customer needs and wants, usage and consumption for any product/service related to a specific industry. This in turn aids the marketers/investors in knowing certain perceptions of the customers. Qualitative research can enlighten about the different product concepts and designs along with unique service offering that in turn, helps define marketing problems and generate opportunities. On the other hand, quantitative research engages with the data collection process through interviews, e-mail interactions, surveys and pilot studies. Quantitative aspects for the market research are useful to validate the hypotheses generated during qualitative research method, explore empirical patterns in the data with the help of statistical tools, and finally make the market estimations.
The Brainy Insights offers comprehensive research and analysis, based on a wide assortment of factual insights gained through interviews with CXOs and global experts and secondary data from reliable sources. Our analysts and industry specialist assume vital roles in building up statistical tools and analysis models, which are used to analyse the data and arrive at accurate insights with exceedingly informative research discoveries. The data provided by our organization have proven precious to a diverse range of companies, facilitating them to address issues such as determining which products/services are the most appealing, whether or not customers use the product in the manner anticipated, the purchasing intentions of the market and many others.
Our research methodology encompasses an idyllic combination of primary and secondary initiatives. Key phases involved in this process are listed below:

The phase involves the gathering and collecting of market data and its related information with the help of different sources & research procedures.

The data procurement stage involves in data gathering and collecting through various data sources.
This stage involves in extensive research. These data sources includes:
Purchased Database: Purchased databases play a crucial role in estimating the market sizes irrespective of the domain. Our purchased database includes:
Primary Research: The Brainy Insights interacts with leading companies and experts of the concerned domain to develop the analyst team’s market understanding and expertise. It improves and substantiates every single data presented in the market reports. Primary research mainly involves in telephonic interviews, E-mail interactions and face-to-face interviews with the raw material providers, manufacturers/producers, distributors, & independent consultants. The interviews that we conduct provides valuable data on market size and industry growth trends prevailing in the market. Our organization also conducts surveys with the various industry experts in order to gain overall insights of the industry/market. For instance, in healthcare industry we conduct surveys with the pharmacists, doctors, surgeons and nurses in order to gain insights and key information of a medical product/device/equipment which the customers are going to usage. Surveys are conducted in the form of questionnaire designed by our own analyst team. Surveys plays an important role in primary research because surveys helps us to identify the key target audiences of the market. Additionally, surveys helps to identify the key target audience engaged with the market. Our survey team conducts the survey by targeting the key audience, thus gaining insights from them. Based on the perspectives of the customers, this information is utilized to formulate market strategies. Moreover, market surveys helps us to understand the current competitive situation of the industry. To be precise, our survey process typically involve with the 360 analysis of the market. This analytical process begins by identifying the prospective customers for a product or service related to the market/industry to obtain data on how a product/service could fit into customers’ lives.

Secondary Research: The secondary data sources includes information published by the on-profit organizations such as World bank, WHO, company fillings, investor presentations, annual reports, national government documents, statistical databases, blogs, articles, white papers and others. From the annual report, we analyse a company’s revenue to understand the key segment and market share of that organization in a particular region. We analyse the company websites and adopt the product mapping technique which is important for deriving the segment revenue. In the product mapping method, we select and categorize the products offered by the companies catering to domain specific market, deduce the product revenue for each of the companies so as to get overall estimation of the market size. We also source data and analyses trends based on information received from supply side and demand side intermediaries in the value chain. The supply side denotes the data gathered from supplier, distributor, wholesaler and the demand side illustrates the data gathered from the end customers for respective market domain.

The supply side for a domain specific market is analysed by:
The demand side for the market is estimated through:
In-house Library: Apart from these third-party sources, we have our in-house library of qualitative and quantitative information. Our in-house database includes market data for various industry and domains. These data are updated on regular basis as per the changing market scenario. Our library includes, historic databases, internal audit reports and archives.
Sometimes there are instances where there is no metadata or raw data available for any domain specific market. For those cases, we use our expertise to forecast and estimate the market size in order to generate comprehensive data sets. Our analyst team adopt a robust research technique in order to produce the estimates:
Data Synthesis: This stage involves the analysis & mapping of all the information obtained from the previous step. It also involves in scrutinizing the data for any discrepancy observed while data gathering related to the market. The data is collected with consideration to the heterogeneity of sources. Robust scientific techniques are in place for synthesizing disparate data sets and provide the essential contextual information that can orient market strategies. The Brainy Insights has extensive experience in data synthesis where the data passes through various stages:


Market Deduction & Formulation: The final stage comprises of assigning data points at appropriate market spaces so as to deduce feasible conclusions. Analyst perspective & subject matter expert based holistic form of market sizing coupled with industry analysis also plays a crucial role in this stage.
This stage involves in finalization of the market size and numbers that we have collected from data integration step. With data interpolation, it is made sure that there is no gap in the market data. Successful trend analysis is done by our analysts using extrapolation techniques, which provide the best possible forecasts for the market.
Data Validation & Market Feedback: Validation is the most important step in the process. Validation & re-validation via an intricately designed process helps us finalize data-points to be used for final calculations.

The Brainy Insights interacts with leading companies and experts of the concerned domain to develop the analyst team’s market understanding and expertise. It improves and substantiates every single data presented in the market reports. The data validation interview and discussion panels are typically composed of the most experienced industry members. The participants include, however, are not limited to:
Moreover, we always validate our data and findings through primary respondents from all the major regions we are working on.


Free Customization
Fortune 500 Clients
Free Yearly Update On Purchase Of Multi/Corporate License
Companies Served Till Date