- +1-315-215-1633
- sales@thebrainyinsights.com

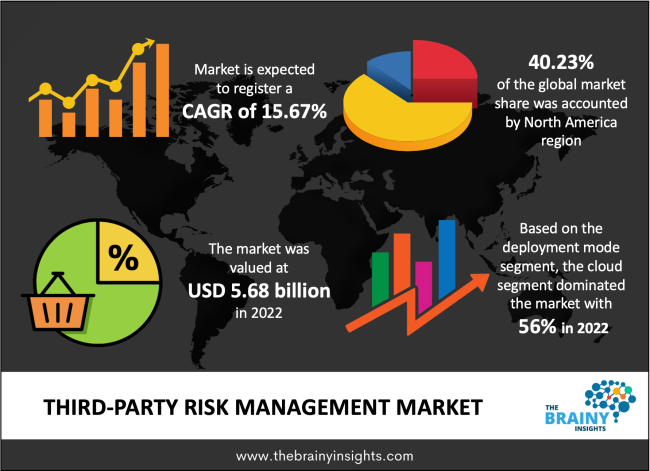
The global third-party risk management market is expected to grow from USD 5.68 billion in 2022 to USD 18.20 billion by 2030, at a CAGR of 15.67% during the forecast period 2022-2030. The Asia Pacific is expected to grow the fastest during the forecast period.
Every business employs the services of third parties like suppliers, vendors, and distributors. The involvement of third parties in the business directly or indirectly exposes the company to multiple risks that are not intrinsic to the entity. The risks associated with employing third-party services can harm the company's business. Therefore, it is essential to identify the risks associated with third parties and strategize on mitigating them. Third-party risk management identifies and mitigates the risks associated with third parties like suppliers, vendors, distributors, partners, and other service providers. Third-party risk management involves a series of steps that are carried out correctly. It involves vendor sourcing, selection, intake, onboarding, scoring inherent risks, assessing and remediating the threats, and termination. Third-party risk management can help avoid supply chain disruptions, data leakage, and other brand damage caused by external factors. Third-party risk management allows the administration to make informed decisions and reduce the probability of any surprise developments in the future. Third-party risk management enables resource optimization and cost-cutting to widen profit margins. Enhanced efficiency, given the sense of certainty offered by third-party risk management, contributes to its growing market adoption.
Get an overview of this study by requesting a free sample
August 2022 - The third-party risk management (TPRM) solutions provider BitSight has acquired ThirdPartyTrust. To offer an end-to-end solution, BitSight is incorporating ThirdPartyTrust technology into its current TPRM offerings.
August 2022 - The most sophisticated supply chain collaboration platform for tracking and tracing the purchase and supply of subcontracted goods, parts, raw materials, and ingredients, called Supply Dynamics, has been acquired by Exiger, a top SaaS provider of supply chain risk management, third-party risk management, and compliance services.
The rising instances of cyber-attacks and frauds in digital financial services - The adoption of smart technologies, given the increased internet penetration, has increased the popularity of digital financial services like mobile banking and digital payments. Such popularity of digital services is creating a need for businesses to adopt and integrate advanced technologies into their services. However, with the increase in digital payment services in the BFSI sector, the risks of cyber-attack and fraud have witnessed an equal rise. The stakeholders in the BFSI sector are investing heavily to safeguard their clients from such incidents. Third-party risk management is preferred in the BFSI sector, given the involvement of multiple partners and other vendors who have access to sensitive information. The optimization of resources to safeguard the interests of millions of users of digital financial services will drive the growth of the third-party risk management market.
The growing digitization of businesses - The growing automation and digitization of industries has increased the instances of breaches of data privacy and security. Increasing digitization is accompanied by the involvement of multiple stakeholders in the market, which contributes to rising concerns about safety and security. The third-party risk management market would be driven by the increasing involvement of several third parties and their subsequent risks.
High capital expenditure – Third-party risk management involves several resources and personnel who are experts in identifying and mitigating risks. Furthermore, the dedicated services to perform the sole risk management function for extensive companies or entities require significant capital expenditures. The resources utilized for third-party are expensive and can hamper the market's growth.
New advanced technologies, systems, processes, and devices - The increasing demands for new features that provide remote assessments, pragmatic and dynamic results, and flexible integration with enterprise services have led to advancement in risk assessment systems, processes, and technologies. Such advanced technologies allow customization according to the needs of the enterprise. New advances have also reduced the cost of these products, enabling the market's expansion; small and medium enterprises will drive this market expansion.
Lack of skilled professionals - Risk assessment operation requires a defined set of skills vital for evaluating any company/entity. The complex nature of the process, systems, and devices needs skilled personnel to operate them. The dearth of qualified professionals can hamper the growth of the market.
The regions analyzed for the market include North America, Europe, South America, Asia Pacific, the Middle East, and Africa. The North American region emerged as the largest market for the global third-party risk management market, with a 40.23% market revenue share in 2022. North America currently dominates the third-party risk management market due to significant market players in the region. The easy accessibility and affordability of internet services also aid the market's growth by improving connectivity and integration of services to carry out risk assessments of third-party vendors. The increasing expenditure on digitization and deployment of high-speed data connectivity in remote parts of the region will also augment the region's growth in the third-party risk management market. The well-developed IT infrastructure is also facilitating the development of the market. The presence of significant market players is met by equally robust demand for their services by the region's vast banking, finance, IT, telecom, manufacturing, and energy sectors. The competition in the North American region is driving innovations in the market, thereby contributing to the development of the regional market. The Asia Pacific market is expected to rise in the forecast period, given the renewed focus of government authorities on developing the internet infrastructure in the region. The telecom boom in the Asia Pacific region has increased internet penetration and improved data access for the population. The government initiatives that offer a safe, secure, and protected economic space for consumers and producers also aid the market's growth.
North America Region Third-Party Risk Management Market Share in 2022 - 40.23%
www.thebrainyinsights.com
Check the geographical analysis of this market by requesting a free sample
The component segment is divided into services and solutions. The solutions segment dominated the market with a revenue share of around 58% in 2022. The vast number of solutions provided by third-party risk management, like screening & background checks, third-party questionnaires, remote & onsite inspections, vendor monitoring, and remediation, contribute to the significant dominance of solutions in the component segment.
The vertical segment is divided into BFSI, healthcare & life sciences, retail & consumer goods, energy & utilities, IT & telecom, government & defense, manufacturing, and others. Over the forecast period, the BFSI or banking, financial services, and insurance segment are expected to grow at the fastest CAGR of 20.24%. The BFSI sector is one of the most critical industries of any global economy. The interconnected nature of the BFSI with every other economic entity of a region makes its safety, security, and data protection a vital concept for the government and the private market players offering these services. The third-party systems, processes, and personnel must be assessed thoroughly to accord the best safety and security to the BFSI sector. Dedicated services' ability to identify and mitigate risks associated with third parties will enable the BFSI sector to optimize its resources and enhance service efficiency. Third-party risk management involves innovative and reformative solutions which help in mitigating potential risks in the future. The exponential growth of the BFSI sector, given the increasing populations, per capita income, and government reforms at formalizing monetary economics, is a positive development for the third-party risk management market. With the growth of the BFSI segment and the workload, third-party risk management is the ideal option to safeguard the interests of consumers and service providers. The increased automation & digitization of banking is also a prominent reason for the growing adoption of third-party risk management in the market segment.
The deployment mode segment is divided into cloud and on-premises. The cloud segment dominated the market with a market share of around 56% in 2022. Cloud computing technologies are cheaper, remote, and more accessible than on-premises third-party risk management. They require less infrastructure, reducing operational and maintenance costs for the companies. The compatibility of cloud platforms with most smart connected devices and operating systems makes it a popular choice in the market. The technological advancements that have enabled market players to introduce cloud platforms with advanced features will also propel the market's growth during the forecast period. The greater flexibility, reliability & security offered by the on-premises deployment type is attributed to the dominance of this segment.
The organization size segment is divided into large enterprises and small & medium enterprises. The large enterprises' segment dominated the market with a market share of around 76% in 2022. Third-party risk management services are expensive given the extensive involvement of resources on the part of the companies. Furthermore, the purchase of third-party risk management services needs significant upfront investments. The involvement of large capital expenditure can be attributed to the dominance of large enterprises, which have deep pockets to carry in-house third-party risk management or outsource it to other companies. Since small & medium enterprises do not have a large network of operations, it is more feasible for them to opt-out of third-party risk management as they regularly work closely with vendors, suppliers, partners, and distributors. The regular interaction and knowledge about third parties in the small & medium enterprises segment often lead to them not requiring a third-party risk management/assessment most of the time. On the other hand, large enterprises have an extensive network of operations, sometimes spanning multiple and varied regions. The in-house risk management for such a vast network of companies and subsidiaries is essential to sustain the business in the long term.
| Attribute | Description |
|---|---|
| Market Size | Revenue (USD Billion) |
| The market size value in 2022 | USD 5.68 Billion |
| The market size value in 2030 | USD 18.20 Billion |
| CAGR (2022 to 2030) | 15.67% |
| Historical data | 2019-2020 |
| Base Year | 2021 |
| Forecast | 2022-2030 |
| Region | The regions examined for the market are Europe, Asia Pacific, North America, South America, and Middle East & Africa. |
| Segments | The research segment is based on component, vertical, deployment mode, and organization size. |
As per The Brainy Insights, the size of the third-party risk management market was valued at USD 5.68 billion in 2022 to USD 18.20 billion by 2030.
Global third-party risk management market is growing at a CAGR of 15.67% during the forecast period 2022-2030.
The market's growth will be influenced by the rising instances of cyber-attacks and frauds in digital financial services.
High capital expenditure could hamper the market growth.
1. Introduction
1.1. Objectives of the Study
1.2. Market Definition
1.3. Research Scope
1.4. Currency
1.5. Key Target Audience
2. Research Methodology and Assumptions
3. Executive Summary
4. Premium Insights
4.1. Porter’s Five Forces Analysis
4.2. Value Chain Analysis
4.3. Top Investment Pockets
4.3.1. Market Attractiveness Analysis by Component
4.3.2. Market Attractiveness Analysis by Vertical
4.3.3. Market Attractiveness Analysis by Deployment Type
4.3.4. Market Attractiveness Analysis by Organization Size
4.3.5. Market Attractiveness Analysis by Region
4.4. Industry Trends
5. Market Dynamics
5.1. Market Evaluation
5.2. Drivers
5.2.1. The rising instances of cyber-attacks and frauds in digital financial services
5.2.2. The growing digitization of businesses
5.3. Restraints
5.3.1. High capital expenditure
5.4. Opportunities
5.4.1. New advanced technologies, systems, process and devices
5.5. Challenges
5.5.1. Lack of skilled professionals
6. Global Third-Party Risk Management Market Analysis and Forecast, By Component
6.1. Segment Overview
6.2. Services
6.3. Solutions
7. Global Third-Party Risk Management Market Analysis and Forecast, By Vertical
7.1. Segment Overview
7.2. BFSI
7.3. Healthcare & Life Sciences
7.4. Retail & Consumers Goods
7.5. Energy & Utilities
7.6. IT & Telecom
7.7. Government & Defense
7.8. Manufacturing
7.9. Others
8. Global Third-Party Risk Management Market Analysis and Forecast, By Deployment Type
8.1. Segment Overview
8.2. Cloud
8.3. On-Premises
9. Global Third-Party Risk Management Market Analysis and Forecast, By Organization Size
9.1. Segment Overview
9.2. Large Enterprises
9.3. Small & Medium Enterprises
10. Global Third-Party Risk Management Market Analysis and Forecast, By Regional Analysis
10.1. Segment Overview
10.2. North America
10.2.1. U.S.
10.2.2. Canada
10.2.3. Mexico
10.3. Europe
10.3.1. Germany
10.3.2. France
10.3.3. U.K.
10.3.4. Italy
10.3.5. Spain
10.4. Asia-Pacific
10.4.1. Japan
10.4.2. China
10.4.3. India
10.5. South America
10.5.1. Brazil
10.6. Middle East and Africa
10.6.1. UAE
10.6.2. South Africa
11. Global Third-Party Risk Management Market-Competitive Landscape
11.1. Overview
11.2. Market Share of Key Players in the Third-Party Risk Management Market
11.2.1. Global Company Market Share
11.2.2. North America Company Market Share
11.2.3. Europe Company Market Share
11.2.4. APAC Company Market Share
11.3. Competitive Situations and Trends
11.3.1. Product Launches and Developments
11.3.2. Partnerships, Collaborations, and Agreements
11.3.3. Mergers & Acquisitions
11.3.4. Expansions
12. Company Profiles
12.1. Aravo Solutions Inc.
12.1.1. Business Overview
12.1.2. Company Snapshot
12.1.3. Company Market Share Analysis
12.1.4. Company Product Portfolio
12.1.5. Recent Developments
12.1.6. SWOT Analysis
12.2. BitSight Technologies Inc.
12.2.1. Business Overview
12.2.2. Company Snapshot
12.2.3. Company Market Share Analysis
12.2.4. Company Product Portfolio
12.2.5. Recent Developments
12.2.6. SWOT Analysis
12.3. Deloitte
12.3.1. Business Overview
12.3.2. Company Snapshot
12.3.3. Company Market Share Analysis
12.3.4. Company Product Portfolio
12.3.5. Recent Developments
12.3.6. SWOT Analysis
12.4. Ernst & Young LLP
12.4.1. Business Overview
12.4.2. Company Snapshot
12.4.3. Company Market Share Analysis
12.4.4. Company Product Portfolio
12.4.5. Recent Developments
12.4.6. SWOT Analysis
12.5. Genpact
12.5.1. Business Overview
12.5.2. Company Snapshot
12.5.3. Company Market Share Analysis
12.5.4. Company Product Portfolio
12.5.5. Recent Developments
12.5.6. SWOT Analysis
12.6. KPGM
12.6.1. Business Overview
12.6.2. Company Snapshot
12.6.3. Company Market Share Analysis
12.6.4. Company Product Portfolio
12.6.5. Recent Developments
12.6.6. SWOT Analysis
12.7. MetricStream
12.7.1. Business Overview
12.7.2. Company Snapshot
12.7.3. Company Market Share Analysis
12.7.4. Company Product Portfolio
12.7.5. Recent Developments
12.7.6. SWOT Analysis
12.8. NAVEX Global Inc.
12.8.1. Business Overview
12.8.2. Company Snapshot
12.8.3. Company Market Share Analysis
12.8.4. Company Product Portfolio
12.8.5. Recent Developments
12.8.6. SWOT Analysis
12.9. Resolver Inc.
12.9.1. Business Overview
12.9.2. Company Snapshot
12.9.3. Company Market Share Analysis
12.9.4. Company Product Portfolio
12.9.5. Recent Developments
12.9.6. SWOT Analysis
12.10. RSA
12.10.1. Business Overview
12.10.2. Company Snapshot
12.10.3. Company Market Share Analysis
12.10.4. Company Product Portfolio
12.10.5. Recent Developments
12.10.6. SWOT Analysis
List of Table
1. Global Third-Party Risk Management Market, By Component, 2019-2030 (USD Billion)
2. Global Services Third-Party Risk Management Market, By Region, 2019-2030 (USD Billion)
3. Global Solutions Third-Party Risk Management Market, By Region, 2019-2030 (USD Billion)
4. Global Third-Party Risk Management Market, By Vertical, 2019-2030 (USD Billion)
5. Global BFSI Third-Party Risk Management Market, By Region, 2019-2030 (USD Billion)
6. Global Healthcare & Life Sciences Third-Party Risk Management Market, By Region, 2019-2030 (USD Billion)
7. Global Retail & Consumers Goods Third-Party Risk Management Market, By Region, 2019-2030 (USD Billion)
8. Global Energy & Utilities Third-Party Risk Management Market, By Region, 2019-2030 (USD Billion)
9. Global IT & Telecom Third-Party Risk Management Market, By Region, 2019-2030 (USD Billion)
10. Global Government & Defense Third-Party Risk Management Market, By Region, 2019-2030 (USD Billion)
11. Global Manufacturing Third-Party Risk Management Market, By Region, 2019-2030 (USD Billion)
12. Global Others Third-Party Risk Management Market, By Region, 2019-2030 (USD Billion)
13. Global Third-Party Risk Management Market, By Deployment Type, 2019-2030 (USD Billion)
14. Global Cloud Third-Party Risk Management Market, By Region, 2019-2030 (USD Billion)
15. Global On-Premises Third-Party Risk Management Market, By Region, 2019-2030 (USD Billion)
16. Global Third-Party Risk Management Market, By Organization Size, 2019-2030 (USD Billion)
17. Global Large Enterprises Third-Party Risk Management Market, By Region, 2019-2030 (USD Billion)
18. Global Small & Medium Enterprises Third-Party Risk Management Market, By Region, 2019-2030 (USD Billion)
19. Global Third-Party Risk Management Market, By Region, 2019-2030 (USD Billion)
20. North America Third-Party Risk Management Market, By Component, 2019-2030 (USD Billion)
21. North America Third-Party Risk Management Market, By Vertical, 2019-2030 (USD Billion)
22. North America Third-Party Risk Management Market, By Deployment Type, 2019-2030 (USD Billion)
23. North America Third-Party Risk Management Market, By Organization Size, 2019-2030 (USD Billion)
24. U.S. Third-Party Risk Management Market, By Component, 2019-2030 (USD Billion)
25. U.S. Third-Party Risk Management Market, By Vertical, 2019-2030 (USD Billion)
26. U.S. Third-Party Risk Management Market, By Deployment Type, 2019-2030 (USD Billion)
27. U.S. Third-Party Risk Management Market, By Organization Size, 2019-2030 (USD Billion)
28. Canada Third-Party Risk Management Market, By Component, 2019-2030 (USD Billion)
29. Canada Third-Party Risk Management Market, By Vertical, 2019-2030 (USD Billion)
30. Canada Third-Party Risk Management Market, By Deployment Type, 2019-2030 (USD Billion)
31. Canada Third-Party Risk Management Market, By Organization Size, 2019-2030 (USD Billion)
32. Mexico Third-Party Risk Management Market, By Component, 2019-2030 (USD Billion)
33. Mexico Third-Party Risk Management Market, By Vertical, 2019-2030 (USD Billion)
34. Mexico Third-Party Risk Management Market, By Deployment Type, 2019-2030 (USD Billion)
35. Mexico Third-Party Risk Management Market, By Organization Size, 2019-2030 (USD Billion)
36. Europe Third-Party Risk Management Market, By Component, 2019-2030 (USD Billion)
37. Europe Third-Party Risk Management Market, By Vertical, 2019-2030 (USD Billion)
38. Europe Third-Party Risk Management Market, By Deployment Type, 2019-2030 (USD Billion)
39. Europe Third-Party Risk Management Market, By Organization Size, 2019-2030 (USD Billion)
40. Germany Third-Party Risk Management Market, By Component, 2019-2030 (USD Billion)
41. Germany Third-Party Risk Management Market, By Vertical, 2019-2030 (USD Billion)
42. Germany Third-Party Risk Management Market, By Deployment Type, 2019-2030 (USD Billion)
43. Germany Third-Party Risk Management Market, By Organization Size, 2019-2030 (USD Billion)
44. France Third-Party Risk Management Market, By Component, 2019-2030 (USD Billion)
45. France Third-Party Risk Management Market, By Vertical, 2019-2030 (USD Billion)
46. France Third-Party Risk Management Market, By Deployment Type, 2019-2030 (USD Billion)
47. France Third-Party Risk Management Market, By Organization Size, 2019-2030 (USD Billion)
48. U.K. Third-Party Risk Management Market, By Component, 2019-2030 (USD Billion)
49. U.K. Third-Party Risk Management Market, By Vertical, 2019-2030 (USD Billion)
50. U.K. Third-Party Risk Management Market, By Deployment Type, 2019-2030 (USD Billion)
51. U.K. Third-Party Risk Management Market, By Organization Size, 2019-2030 (USD Billion)
52. Italy Third-Party Risk Management Market, By Component, 2019-2030 (USD Billion)
53. Italy Third-Party Risk Management Market, By Vertical, 2019-2030 (USD Billion)
54. Italy Third-Party Risk Management Market, By Deployment Type, 2019-2030 (USD Billion)
55. Italy Third-Party Risk Management Market, By Organization Size, 2019-2030 (USD Billion)
56. Spain Third-Party Risk Management Market, By Component, 2019-2030 (USD Billion)
57. Spain Third-Party Risk Management Market, By Vertical, 2019-2030 (USD Billion)
58. Spain Third-Party Risk Management Market, By Deployment Type, 2019-2030 (USD Billion)
59. Spain Third-Party Risk Management Market, By Organization Size, 2019-2030 (USD Billion)
60. Asia Pacific Third-Party Risk Management Market, By Component, 2019-2030 (USD Billion)
61. Asia Pacific Third-Party Risk Management Market, By Vertical, 2019-2030 (USD Billion)
62. Asia Pacific Third-Party Risk Management Market, By Deployment Type, 2019-2030 (USD Billion)
63. Asia Pacific Third-Party Risk Management Market, By Organization Size, 2019-2030 (USD Billion)
64. Japan Third-Party Risk Management Market, By Component, 2019-2030 (USD Billion)
65. Japan Third-Party Risk Management Market, By Vertical, 2019-2030 (USD Billion)
66. Japan Third-Party Risk Management Market, By Deployment Type, 2019-2030 (USD Billion)
67. Japan Third-Party Risk Management Market, By Organization Size, 2019-2030 (USD Billion)
68. China Third-Party Risk Management Market, By Component, 2019-2030 (USD Billion)
69. China Third-Party Risk Management Market, By Vertical, 2019-2030 (USD Billion)
70. China Third-Party Risk Management Market, By Deployment Type, 2019-2030 (USD Billion)
71. China Third-Party Risk Management Market, By Organization Size, 2019-2030 (USD Billion)
72. India Third-Party Risk Management Market, By Component, 2019-2030 (USD Billion)
73. India Third-Party Risk Management Market, By Vertical, 2019-2030 (USD Billion)
74. India Third-Party Risk Management Market, By Deployment Type, 2019-2030 (USD Billion)
75. India Third-Party Risk Management Market, By Organization Size, 2019-2030 (USD Billion)
76. South America Third-Party Risk Management Market, By Component, 2019-2030 (USD Billion)
77. South America Third-Party Risk Management Market, By Vertical, 2019-2030 (USD Billion)
78. South America Third-Party Risk Management Market, By Deployment Type, 2019-2030 (USD Billion)
79. South America Third-Party Risk Management Market, By Organization Size, 2019-2030 (USD Billion)
80. Brazil Third-Party Risk Management Market, By Component, 2019-2030 (USD Billion)
81. Brazil Third-Party Risk Management Market, By Vertical, 2019-2030 (USD Billion)
82. Brazil Third-Party Risk Management Market, By Deployment Type, 2019-2030 (USD Billion)
83. Brazil Third-Party Risk Management Market, By Organization Size, 2019-2030 (USD Billion)
84. Middle East and Africa Third-Party Risk Management Market, By Component, 2019-2030 (USD Billion)
85. Middle East and Africa Third-Party Risk Management Market, By Vertical, 2019-2030 (USD Billion)
86. Middle East and Africa Third-Party Risk Management Market, By Deployment Type, 2019-2030 (USD Billion)
87. Middle East and Africa Third-Party Risk Management Market, By Organization Size, 2019-2030 (USD Billion)
88. UAE Third-Party Risk Management Market, By Component, 2019-2030 (USD Billion)
89. UAE Third-Party Risk Management Market, By Vertical, 2019-2030 (USD Billion)
90. UAE Third-Party Risk Management Market, By Deployment Type, 2019-2030 (USD Billion)
91. UAE Third-Party Risk Management Market, By Organization Size, 2019-2030 (USD Billion)
92. South Africa Third-Party Risk Management Market, By Component, 2019-2030 (USD Billion)
93. South Africa Third-Party Risk Management Market, By Vertical, 2019-2030 (USD Billion)
94. South Africa Third-Party Risk Management Market, By Deployment Type, 2019-2030 (USD Billion)
95. South Africa Third-Party Risk Management Market, By Organization Size, 2019-2030 (USD Billion)
List of Figures
1. Global Third-Party Risk Management Market Segmentation
2. Third-Party Risk Management Market: Research Methodology
3. Market Size Estimation Methodology: Bottom-Up Approach
4. Market Size Estimation Methodology: Top-Down Approach
5. Data Triangulation
6. Porter’s Five Forces Analysis
7. Value Chain Analysis
8. Global Third-Party Risk Management Market Attractiveness Analysis by Component
9. Global Third-Party Risk Management Market Attractiveness Analysis by Vertical
10. Global Third-Party Risk Management Market Attractiveness Analysis by Deployment Type
11. Global Third-Party Risk Management Market Attractiveness Analysis by Organization Size
12. Global Third-Party Risk Management Market Attractiveness Analysis by Region
13. Global Third-Party Risk Management Market: Dynamics
14. Global Third-Party Risk Management Market Share by Component (2022 & 2030)
15. Global Third-Party Risk Management Market Share by Vertical (2022 & 2030)
16. Global Third-Party Risk Management Market Share by Deployment Type (2022 & 2030)
17. Global Third-Party Risk Management Market Share by Organization Size (2022 & 2030)
18. Global Third-Party Risk Management Market Share by Regions (2022 & 2030)
19. Global Third-Party Risk Management Market Share by Company (2021)
This study forecasts revenue at global, regional, and country levels from 2019 to 2030. The Brainy Insights has segmented the third-party risk management market based on below mentioned segments:
Third-Party Risk Management Market by Component:
Third-Party Risk Management Market by Vertical:
Third-Party Risk Management Market by Deployment Type:
Third-Party Risk Management Market by Organization Size:
Third-Party Risk Management Market by Region:
Research has its special purpose to undertake marketing efficiently. In this competitive scenario, businesses need information across all industry verticals; the information about customer wants, market demand, competition, industry trends, distribution channels etc. This information needs to be updated regularly because businesses operate in a dynamic environment. Our organization, The Brainy Insights incorporates scientific and systematic research procedures in order to get proper market insights and industry analysis for overall business success. The analysis consists of studying the market from a miniscule level wherein we implement statistical tools which helps us in examining the data with accuracy and precision.
Our research reports feature both; quantitative and qualitative aspects for any market. Qualitative information for any market research process are fundamental because they reveal the customer needs and wants, usage and consumption for any product/service related to a specific industry. This in turn aids the marketers/investors in knowing certain perceptions of the customers. Qualitative research can enlighten about the different product concepts and designs along with unique service offering that in turn, helps define marketing problems and generate opportunities. On the other hand, quantitative research engages with the data collection process through interviews, e-mail interactions, surveys and pilot studies. Quantitative aspects for the market research are useful to validate the hypotheses generated during qualitative research method, explore empirical patterns in the data with the help of statistical tools, and finally make the market estimations.
The Brainy Insights offers comprehensive research and analysis, based on a wide assortment of factual insights gained through interviews with CXOs and global experts and secondary data from reliable sources. Our analysts and industry specialist assume vital roles in building up statistical tools and analysis models, which are used to analyse the data and arrive at accurate insights with exceedingly informative research discoveries. The data provided by our organization have proven precious to a diverse range of companies, facilitating them to address issues such as determining which products/services are the most appealing, whether or not customers use the product in the manner anticipated, the purchasing intentions of the market and many others.
Our research methodology encompasses an idyllic combination of primary and secondary initiatives. Key phases involved in this process are listed below:

The phase involves the gathering and collecting of market data and its related information with the help of different sources & research procedures.

The data procurement stage involves in data gathering and collecting through various data sources.
This stage involves in extensive research. These data sources includes:
Purchased Database: Purchased databases play a crucial role in estimating the market sizes irrespective of the domain. Our purchased database includes:
Primary Research: The Brainy Insights interacts with leading companies and experts of the concerned domain to develop the analyst team’s market understanding and expertise. It improves and substantiates every single data presented in the market reports. Primary research mainly involves in telephonic interviews, E-mail interactions and face-to-face interviews with the raw material providers, manufacturers/producers, distributors, & independent consultants. The interviews that we conduct provides valuable data on market size and industry growth trends prevailing in the market. Our organization also conducts surveys with the various industry experts in order to gain overall insights of the industry/market. For instance, in healthcare industry we conduct surveys with the pharmacists, doctors, surgeons and nurses in order to gain insights and key information of a medical product/device/equipment which the customers are going to usage. Surveys are conducted in the form of questionnaire designed by our own analyst team. Surveys plays an important role in primary research because surveys helps us to identify the key target audiences of the market. Additionally, surveys helps to identify the key target audience engaged with the market. Our survey team conducts the survey by targeting the key audience, thus gaining insights from them. Based on the perspectives of the customers, this information is utilized to formulate market strategies. Moreover, market surveys helps us to understand the current competitive situation of the industry. To be precise, our survey process typically involve with the 360 analysis of the market. This analytical process begins by identifying the prospective customers for a product or service related to the market/industry to obtain data on how a product/service could fit into customers’ lives.

Secondary Research: The secondary data sources includes information published by the on-profit organizations such as World bank, WHO, company fillings, investor presentations, annual reports, national government documents, statistical databases, blogs, articles, white papers and others. From the annual report, we analyse a company’s revenue to understand the key segment and market share of that organization in a particular region. We analyse the company websites and adopt the product mapping technique which is important for deriving the segment revenue. In the product mapping method, we select and categorize the products offered by the companies catering to domain specific market, deduce the product revenue for each of the companies so as to get overall estimation of the market size. We also source data and analyses trends based on information received from supply side and demand side intermediaries in the value chain. The supply side denotes the data gathered from supplier, distributor, wholesaler and the demand side illustrates the data gathered from the end customers for respective market domain.

The supply side for a domain specific market is analysed by:
The demand side for the market is estimated through:
In-house Library: Apart from these third-party sources, we have our in-house library of qualitative and quantitative information. Our in-house database includes market data for various industry and domains. These data are updated on regular basis as per the changing market scenario. Our library includes, historic databases, internal audit reports and archives.
Sometimes there are instances where there is no metadata or raw data available for any domain specific market. For those cases, we use our expertise to forecast and estimate the market size in order to generate comprehensive data sets. Our analyst team adopt a robust research technique in order to produce the estimates:
Data Synthesis: This stage involves the analysis & mapping of all the information obtained from the previous step. It also involves in scrutinizing the data for any discrepancy observed while data gathering related to the market. The data is collected with consideration to the heterogeneity of sources. Robust scientific techniques are in place for synthesizing disparate data sets and provide the essential contextual information that can orient market strategies. The Brainy Insights has extensive experience in data synthesis where the data passes through various stages:


Market Deduction & Formulation: The final stage comprises of assigning data points at appropriate market spaces so as to deduce feasible conclusions. Analyst perspective & subject matter expert based holistic form of market sizing coupled with industry analysis also plays a crucial role in this stage.
This stage involves in finalization of the market size and numbers that we have collected from data integration step. With data interpolation, it is made sure that there is no gap in the market data. Successful trend analysis is done by our analysts using extrapolation techniques, which provide the best possible forecasts for the market.
Data Validation & Market Feedback: Validation is the most important step in the process. Validation & re-validation via an intricately designed process helps us finalize data-points to be used for final calculations.

The Brainy Insights interacts with leading companies and experts of the concerned domain to develop the analyst team’s market understanding and expertise. It improves and substantiates every single data presented in the market reports. The data validation interview and discussion panels are typically composed of the most experienced industry members. The participants include, however, are not limited to:
Moreover, we always validate our data and findings through primary respondents from all the major regions we are working on.


Free Customization
Fortune 500 Clients
Free Yearly Update On Purchase Of Multi/Corporate License
Companies Served Till Date