- +1-315-215-1633
- sales@thebrainyinsights.com

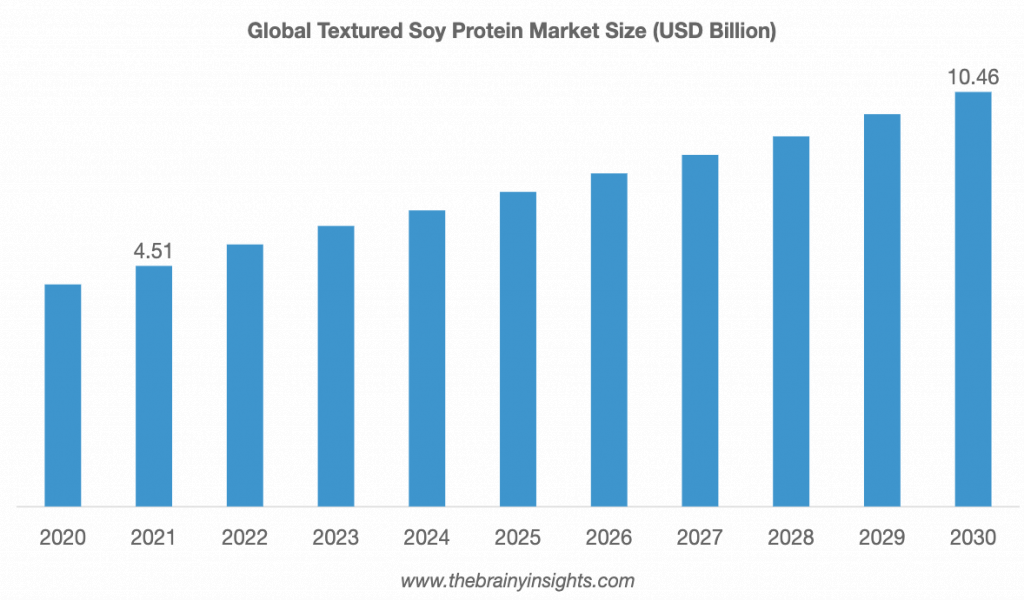
Global textured soy protein market is expected to reach USD 10.46 billion by 2030, at a CAGR of 9.80% from 2022 to 2030. The rising need for protein-rich food is anticipated to propel the market for textured soy protein over the projection years. Growing health awareness makes customers choose low-fat and low-carb foods, which drives product needs.
Rise in awareness of the unhealthful lifestyle habits heeded by people. The rising trend of healthy living has increased with the transformation of lifestyle patterns to healthier choices. Textured soy protein is one of the options as it is lower in fat but has high in protein. Current diet sensations also prohibit people from eating meat, as they lack sufficient protein and shift to products like Soy to eat protein. Textured soy protein is also an affordable product as the primary material. They are not expensive and have lower processing fees. It permits manufacturers to transform soy into more refined products that evolve conveniently to sell to consumers. Furthermore, it is less costly than meat products and a meat substitute. Another propelling factor for the market is that it is a substitute for dairy. Lactose intolerance is a case many people encounter globally, so customers change to different milk sources, and soy milk is a perfect substitute. The market development can be hindered by the availability of plant-based proteins like chickpeas, quinoa, fava beans, etc. These plant-based proteins are equivalent to soy, and the textured soy protein need can fall with improved usage. Another element that can hinder the market is the undesirable flavor of soy products. Though it is supposed to be an exceptionally healthy choice, customers still try to run away from it owing to its taste, which makes it disfavored.
Get an overview of this study by requesting a free sample
High soy crop farming in growing regions like the Asia Pacific and South America, in expansion to the overall soybean farming worldwide, has raised the accessibility of soy products like textured soy proteins. Primary materials for textured soy protein are easy to get from contract farmers or oilseed crushers delivering soy meals. The lower processing expenses related to textured soy proteins are appropriate for the functional needs of suppliers and therefore permit the process to pay sufficiently for product expansion.
Genetically modified crops are banned in the regions like Europe, where different nations, as territory of the European Union, have restricted their agriculturalists from growing GM (genetically modified) crops. The countries like Germany, Scotland, France, and Northern Ireland has impacted the genetically modified soybean market. It is anticipated to restrict expansion due to the farming and acceptance of non-Genetically modified soybean crops for food processing in European nations.
The transforming way of living and the transition from packed food to healthy food items has been noticed in growing economies over the past years, showing the need for textured soy proteins for food items and usages like cosmetics, self-care products, and animal feed. The need for textured soy protein is increasing in markets like Europe and the United States. The craze of customer choice for healthful products is rising, whereas marketing drives are prepared to spotlight their usage and health advantage declarations. Growing countries like India and China are predicted to encounter an upsurge in the need for textured soy protein in the future from these regions. The APAC region delivers a cost benefit in the processing and production process. Increased need, associated with the lower production cost, would help the suppliers drive the market's growth.
The global textured soy protein market has been segmented based on source, type, application, and regions.
The regions analyzed for the market include North America, Europe, South America, Asia Pacific, the Middle East and Africa. North America region emerged as the largest market for the global textured soy protein market with a 34.5% share of the market revenue in 2021.
North America Region Textured Soy Protein Market Share in 2021 - 34.5%
www.thebrainyinsights.com
Check the geographical analysis of this market by requesting a free sample
The key players are now concentrating on implementing strategies such as adopting new technology, product innovations, mergers & acquisitions, joint venture, alliances, and partnerships to improve their market position in the global textured soy protein industry.
In 2021 July, (ADM) Archer Daniels Midland, a United States-based food processing company, achieved Sojaprotein for an unknown price. The investment will permit ADM to grow its alternative protein portfolio, which already contains a soy protein complex in Campo Grande, a pea protein plant in Enderlin, and a joint venture with PlantPlus Foods, Mato Grosso do Sul, North Dakota. Sojaprotein is a Serbian-based agribusiness company that produces soy-based products.
As per The Brainy Insights, the size of the textured soy protein market was valued at USD 4.71 billion in 2021 to USD 10.92 billion by 2030.
Global textured soy protein market is growing at a CAGR of 9.80% during the forecast period 2022-2030.
An affordable and easy-to-consume form of protein to propel market growth.
Strict government rules for inherently altered crops to hinder market growth.
Growth in soybean production and usage in arising markets will provide huge opportunities to the market.
1. Introduction
1.1. Objectives of the Study
1.2. Market Definition
1.3. Research Scope
1.4. Currency
1.5. Key Target Audience
2. Research Methodology and Assumptions
3. Executive Summary
4. Premium Insights
4.1. Porter’s Five Forces Analysis
4.2. Value Chain Analysis
4.3. Top Investment Pockets
4.3.1. Market Attractiveness Analysis by Source
4.3.2. Market Attractiveness Analysis by Type
4.3.3. Market Attractiveness Analysis by Application
4.3.4. Market Attractiveness Analysis by Region
4.4. Industry Trends
5. Market Dynamics
5.1. Market Evaluation
5.2. Drivers
5.2.1. An affordable and easy-to-consume form of protein to propel market growth
5.3. Restraints
5.3.1. Strict government rules for inherently altered crops to hinder market growth
5.4. Opportunities
5.4.1. Growth in soybean production and usage in arising markets
6. Global Textured Soy Protein Market Analysis and Forecast, By Source:
6.1. Segment Overview
6.2. Isolates
6.3. Concentrates
6.4. Flour
7. Global Textured Soy Protein Market Analysis and Forecast, By Type
7.1. Segment Overview
7.2. Organic
7.3. Conventional
7.4. Non-GMO
8. Global Textured Soy Protein Market Analysis and Forecast, By Application
8.1. Segment Overview
8.2. Food
8.3. Meat Substitutes
8.4. Dairy Alternatives
8.5. Infant Nutrition
8.6. Bakery
9. Global Textured Soy Protein Market Analysis and Forecast, By Regional Analysis
9.1. Segment Overview
9.2. North America
9.2.1. U.S.
9.2.2. Canada
9.2.3. Mexico
9.3. Europe
9.3.1. Germany
9.3.2. France
9.3.3. U.K.
9.3.4. Italy
9.3.5. Spain
9.4. Asia-Pacific
9.4.1. Japan
9.4.2. China
9.4.3. India
9.5. South America
9.5.1. Brazil
9.6. Middle East and Africa
9.6.1. UAE
9.6.2. South Africa
10. Global Textured Soy Protein Market-Competitive Landscape
10.1. Overview
10.2. Market Share of Key Players in the Textured Soy Protein Market
10.2.1. Global Company Market Share
10.2.2. North America Company Market Share
10.2.3. Europe Company Market Share
10.2.4. APAC Company Market Share
10.3. Competitive Situations and Trends
10.3.1. Product Launches and Developments
10.3.2. Partnerships, Collaborations, and Agreements
10.3.3. Mergers & Acquisitions
10.3.4. Expansions
11. Company Profiles
11.1. Abbott Nutritionals
11.1.1. Business Overview
11.1.2. Company Snapshot
11.1.3. Company Market Share Analysis
11.1.4. Company Product Portfolio
11.1.5. Recent Developments
11.1.6. SWOT Analysis
11.2. Archer Daniels Midland
11.2.1. Business Overview
11.2.2. Company Snapshot
11.2.3. Company Market Share Analysis
11.2.4. Company Product Portfolio
11.2.5. Recent Developments
11.2.6. SWOT Analysis
11.3. Bunge
11.3.1. Business Overview
11.3.2. Company Snapshot
11.3.3. Company Market Share Analysis
11.3.4. Company Product Portfolio
11.3.5. Recent Developments
11.3.6. SWOT Analysis
11.4. Cargill Inc.
11.4.1. Business Overview
11.4.2. Company Snapshot
11.4.3. Company Market Share Analysis
11.4.4. Company Product Portfolio
11.4.5. Recent Developments
11.4.6. SWOT Analysis
11.5. Costantino Special Protein
11.5.1. Business Overview
11.5.2. Company Snapshot
11.5.3. Company Market Share Analysis
11.5.4. Company Product Portfolio
11.5.5. Recent Developments
11.5.6. SWOT Analysis
11.6. DuPont Nutrition & Health
11.6.1. Business Overview
11.6.2. Company Snapshot
11.6.3. Company Market Share Analysis
11.6.4. Company Product Portfolio
11.6.5. Recent Developments
11.6.6. SWOT Analysis
11.7. Friesland Campina
11.7.1. Business Overview
11.7.2. Company Snapshot
11.7.3. Company Market Share Analysis
11.7.4. Company Product Portfolio
11.7.5. Recent Developments
11.7.6. SWOT Analysis
11.8. Kerry Group Plc.
11.8.1. Business Overview
11.8.2. Company Snapshot
11.8.3. Company Market Share Analysis
11.8.4. Company Product Portfolio
11.8.5. Recent Developments
11.8.6. SWOT Analysis
11.9. New Alliance Dye Chem Pvt. Ltd
11.9.1. Business Overview
11.9.2. Company Snapshot
11.9.3. Company Market Share Analysis
11.9.4. Company Product Portfolio
11.9.5. Recent Developments
11.9.6. SWOT Analysis
11.10. Solae LLC
11.10.1. Business Overview
11.10.2. Company Snapshot
11.10.3. Company Market Share Analysis
11.10.4. Company Product Portfolio
11.10.5. Recent Developments
11.10.6. SWOT Analysis
11.11. The Good Scents Company
11.11.1. Business Overview
11.11.2. Company Snapshot
11.11.3. Company Market Share Analysis
11.11.4. Company Product Portfolio
11.11.5. Recent Developments
11.11.6. SWOT Analysis
List of Table
1. Global Textured Soy Protein Market, By Source, 2019-2030 (USD Billion)
2. Global Isolates Textured Soy Protein Market, By Region, 2019-2030 (USD Billion)
3. Global Concentrates Textured Soy Protein Market, By Region, 2019-2030 (USD Billion)
4. Global Flour Textured Soy Protein Market, By Region, 2019-2030 (USD Billion)
5. Global Textured Soy Protein Market, By Type, 2019-2030 (USD Billion)
6. Global Organic Textured Soy Protein Market, By Region, 2019-2030 (USD Billion)
7. Global Conventional Textured Soy Protein Market, By Region, 2019-2030 (USD Billion)
8. Global Non-GMO Textured Soy Protein Market, By Region, 2019-2030 (USD Billion)
9. Global Textured Soy Protein Market, By Application, 2019-2030 (USD Billion)
10. Global Food Textured Soy Protein Market, By Region, 2019-2030 (USD Billion)
11. Global Meat Substitutes Textured Soy Protein Market, By Region, 2019-2030 (USD Billion)
12. Global Dairy Alternatives Textured Soy Protein Market, By Region, 2019-2030 (USD Billion)
13. Global Infant Nutrition Textured Soy Protein Market, By Region, 2019-2030 (USD Billion)
14. Global Bakery Textured Soy Protein Market, By Region, 2019-2030 (USD Billion)
15. North America Textured Soy Protein Market, By Source, 2019-2030 (USD Billion)
16. North America Textured Soy Protein Market, By Type, 2019-2030 (USD Billion)
17. North America Textured Soy Protein Market, By Application, 2019-2030 (USD Billion)
18. U.S. Textured Soy Protein Market, By Source, 2019-2030 (USD Billion)
19. U.S. Textured Soy Protein Market, By Type, 2019-2030 (USD Billion)
20. U.S. Textured Soy Protein Market, By Application, 2019-2030 (USD Billion)
21. Canada Textured Soy Protein Market, By Source, 2019-2030 (USD Billion)
22. Canada Textured Soy Protein Market, By Type, 2019-2030 (USD Billion)
23. Canada Textured Soy Protein Market, By Application, 2019-2030 (USD Billion)
24. Mexico Textured Soy Protein Market, By Source, 2019-2030 (USD Billion)
25. Mexico Textured Soy Protein Market, By Type, 2019-2030 (USD Billion)
26. Mexico Textured Soy Protein Market, By Application, 2019-2030 (USD Billion)
27. Europe Textured Soy Protein Market, By Source, 2019-2030 (USD Billion)
28. Europe Textured Soy Protein Market, By Type, 2019-2030 (USD Billion)
29. Europe Textured Soy Protein Market, By Application, 2019-2030 (USD Billion)
30. Germany Textured Soy Protein Market, By Source, 2019-2030 (USD Billion)
31. Germany Textured Soy Protein Market, By Type, 2019-2030 (USD Billion)
32. Germany Textured Soy Protein Market, By Application, 2019-2030 (USD Billion)
33. France Textured Soy Protein Market, By Source 2019-2030 (USD Billion)
34. France Textured Soy Protein Market, By Type, 2019-2030 (USD Billion)
35. France Textured Soy Protein Market, By Application, 2019-2030 (USD Billion)
36. U.K. Textured Soy Protein Market, By Source, 2019-2030 (USD Billion)
37. U.K. Textured Soy Protein Market, By Type, 2019-2030 (USD Billion)
38. U.K. Textured Soy Protein Market, By Application, 2019-2030 (USD Billion)
39. Italy Textured Soy Protein Market, By Source, 2019-2030 (USD Billion)
40. Italy Textured Soy Protein Market, By Type, 2019-2030 (USD Billion)
41. Italy Textured Soy Protein Market, By Application, 2019-2030 (USD Billion)
42. Spain Textured Soy Protein Market, By Source, 2019-2030 (USD Billion)
43. Spain Textured Soy Protein Market, By Type, 2019-2030 (USD Billion)
44. Spain Textured Soy Protein Market, By Application, 2019-2030 (USD Billion)
45. Asia Pacific Textured Soy Protein Market, By Source, 2019-2030 (USD Billion)
46. Asia Pacific Textured Soy Protein Market, By Type, 2019-2030 (USD Billion)
47. Asia Pacific Textured Soy Protein Market, By Application, 2019-2030 (USD Billion)
48. Japan Textured Soy Protein Market, By Source, 2019-2030 (USD Billion)
49. Japan Textured Soy Protein Market, By Type, 2019-2030 (USD Billion)
50. Japan Textured Soy Protein Market, By Application, 2019-2030 (USD Billion)
51. China Textured Soy Protein Market, By Source 2019-2030 (USD Billion)
52. China Textured Soy Protein Market, By Type, 2019-2030 (USD Billion)
53. China Textured Soy Protein Market, By Application, 2019-2030 (USD Billion)
54. India Textured Soy Protein Market, By Source 2019-2030 (USD Billion)
55. India Textured Soy Protein Market, By Type, 2019-2030 (USD Billion)
56. India Textured Soy Protein Market, By Application, 2019-2030 (USD Billion)
57. South America Textured Soy Protein Market, By Source, 2019-2030 (USD Billion)
58. South America Textured Soy Protein Market, By Type, 2019-2030 (USD Billion)
59. South America Textured Soy Protein Market, By Application, 2019-2030 (USD Billion)
60. Brazil Textured Soy Protein Market, By Source 2019-2030 (USD Billion)
61. Brazil Textured Soy Protein Market, By Type, 2019-2030 (USD Billion)
62. Brazil Textured Soy Protein Market, By Application, 2019-2030 (USD Billion)
63. Middle East and Africa Textured Soy Protein Market, By Source, 2019-2030 (USD Billion)
64. Middle East and Africa Textured Soy Protein Market, By Type, 2019-2030 (USD Billion)
65. Middle East and Africa Textured Soy Protein Market, By Application, 2019-2030 (USD Billion)
66. UAE Textured Soy Protein Market, By Source, 2019-2030 (USD Billion)
67. UAE Textured Soy Protein Market, By Type, 2019-2030 (USD Billion)
68. UAE Textured Soy Protein Market, By Application, 2019-2030 (USD Billion)
69. South Africa Textured Soy Protein Market, By Source 2019-2030 (USD Billion)
70. South Africa Textured Soy Protein Market, By Type, 2019-2030 (USD Billion)
71. South Africa Textured Soy Protein Market, By Application, 2019-2030 (USD Billion)
List of Figures
1. Global Textured Soy Protein Market Segmentation
2. Textured Soy Protein Market: Research Methodology
3. Market Size Estimation Methodology: Bottom-Up Approach
4. Market Size Estimation Methodology: Top-Down Approach
5. Data Triangulation
6. Porter’s Five Forces Analysis
7. Value Chain Analysis
8. Global Textured Soy Protein Market Attractiveness Analysis by Source
9. Global Textured Soy Protein Market Attractiveness Analysis by Type
10. Global Textured Soy Protein Market Attractiveness Analysis by Application
11. Global Textured Soy Protein Market Attractiveness Analysis by Region
12. Global Textured Soy Protein Market: Dynamics
13. Global Textured Soy Protein Market Share by Source (2022 & 2030)
14. Global Textured Soy Protein Market Share by Type (2022 & 2030)
15. Global Textured Soy Protein Market Share by Application (2022 & 2030)
16. Global Textured Soy Protein Market Share by Regions (2022 & 2030)
17. Global Textured Soy Protein Market Share by Company (2021)
This study forecasts revenue at global, regional, and country levels from 2019 to 2030. The Brainy Insights has segmented the global textured soy protein Market based on below mentioned segments:
Global Textured Soy Protein Market by Source:
Global Textured Soy Protein Market by Type:
Global Textured Soy Protein Market by Application:
Global Textured Soy Protein Market by Region:
Research has its special purpose to undertake marketing efficiently. In this competitive scenario, businesses need information across all industry verticals; the information about customer wants, market demand, competition, industry trends, distribution channels etc. This information needs to be updated regularly because businesses operate in a dynamic environment. Our organization, The Brainy Insights incorporates scientific and systematic research procedures in order to get proper market insights and industry analysis for overall business success. The analysis consists of studying the market from a miniscule level wherein we implement statistical tools which helps us in examining the data with accuracy and precision.
Our research reports feature both; quantitative and qualitative aspects for any market. Qualitative information for any market research process are fundamental because they reveal the customer needs and wants, usage and consumption for any product/service related to a specific industry. This in turn aids the marketers/investors in knowing certain perceptions of the customers. Qualitative research can enlighten about the different product concepts and designs along with unique service offering that in turn, helps define marketing problems and generate opportunities. On the other hand, quantitative research engages with the data collection process through interviews, e-mail interactions, surveys and pilot studies. Quantitative aspects for the market research are useful to validate the hypotheses generated during qualitative research method, explore empirical patterns in the data with the help of statistical tools, and finally make the market estimations.
The Brainy Insights offers comprehensive research and analysis, based on a wide assortment of factual insights gained through interviews with CXOs and global experts and secondary data from reliable sources. Our analysts and industry specialist assume vital roles in building up statistical tools and analysis models, which are used to analyse the data and arrive at accurate insights with exceedingly informative research discoveries. The data provided by our organization have proven precious to a diverse range of companies, facilitating them to address issues such as determining which products/services are the most appealing, whether or not customers use the product in the manner anticipated, the purchasing intentions of the market and many others.
Our research methodology encompasses an idyllic combination of primary and secondary initiatives. Key phases involved in this process are listed below:

The phase involves the gathering and collecting of market data and its related information with the help of different sources & research procedures.

The data procurement stage involves in data gathering and collecting through various data sources.
This stage involves in extensive research. These data sources includes:
Purchased Database: Purchased databases play a crucial role in estimating the market sizes irrespective of the domain. Our purchased database includes:
Primary Research: The Brainy Insights interacts with leading companies and experts of the concerned domain to develop the analyst team’s market understanding and expertise. It improves and substantiates every single data presented in the market reports. Primary research mainly involves in telephonic interviews, E-mail interactions and face-to-face interviews with the raw material providers, manufacturers/producers, distributors, & independent consultants. The interviews that we conduct provides valuable data on market size and industry growth trends prevailing in the market. Our organization also conducts surveys with the various industry experts in order to gain overall insights of the industry/market. For instance, in healthcare industry we conduct surveys with the pharmacists, doctors, surgeons and nurses in order to gain insights and key information of a medical product/device/equipment which the customers are going to usage. Surveys are conducted in the form of questionnaire designed by our own analyst team. Surveys plays an important role in primary research because surveys helps us to identify the key target audiences of the market. Additionally, surveys helps to identify the key target audience engaged with the market. Our survey team conducts the survey by targeting the key audience, thus gaining insights from them. Based on the perspectives of the customers, this information is utilized to formulate market strategies. Moreover, market surveys helps us to understand the current competitive situation of the industry. To be precise, our survey process typically involve with the 360 analysis of the market. This analytical process begins by identifying the prospective customers for a product or service related to the market/industry to obtain data on how a product/service could fit into customers’ lives.

Secondary Research: The secondary data sources includes information published by the on-profit organizations such as World bank, WHO, company fillings, investor presentations, annual reports, national government documents, statistical databases, blogs, articles, white papers and others. From the annual report, we analyse a company’s revenue to understand the key segment and market share of that organization in a particular region. We analyse the company websites and adopt the product mapping technique which is important for deriving the segment revenue. In the product mapping method, we select and categorize the products offered by the companies catering to domain specific market, deduce the product revenue for each of the companies so as to get overall estimation of the market size. We also source data and analyses trends based on information received from supply side and demand side intermediaries in the value chain. The supply side denotes the data gathered from supplier, distributor, wholesaler and the demand side illustrates the data gathered from the end customers for respective market domain.

The supply side for a domain specific market is analysed by:
The demand side for the market is estimated through:
In-house Library: Apart from these third-party sources, we have our in-house library of qualitative and quantitative information. Our in-house database includes market data for various industry and domains. These data are updated on regular basis as per the changing market scenario. Our library includes, historic databases, internal audit reports and archives.
Sometimes there are instances where there is no metadata or raw data available for any domain specific market. For those cases, we use our expertise to forecast and estimate the market size in order to generate comprehensive data sets. Our analyst team adopt a robust research technique in order to produce the estimates:
Data Synthesis: This stage involves the analysis & mapping of all the information obtained from the previous step. It also involves in scrutinizing the data for any discrepancy observed while data gathering related to the market. The data is collected with consideration to the heterogeneity of sources. Robust scientific techniques are in place for synthesizing disparate data sets and provide the essential contextual information that can orient market strategies. The Brainy Insights has extensive experience in data synthesis where the data passes through various stages:


Market Deduction & Formulation: The final stage comprises of assigning data points at appropriate market spaces so as to deduce feasible conclusions. Analyst perspective & subject matter expert based holistic form of market sizing coupled with industry analysis also plays a crucial role in this stage.
This stage involves in finalization of the market size and numbers that we have collected from data integration step. With data interpolation, it is made sure that there is no gap in the market data. Successful trend analysis is done by our analysts using extrapolation techniques, which provide the best possible forecasts for the market.
Data Validation & Market Feedback: Validation is the most important step in the process. Validation & re-validation via an intricately designed process helps us finalize data-points to be used for final calculations.

The Brainy Insights interacts with leading companies and experts of the concerned domain to develop the analyst team’s market understanding and expertise. It improves and substantiates every single data presented in the market reports. The data validation interview and discussion panels are typically composed of the most experienced industry members. The participants include, however, are not limited to:
Moreover, we always validate our data and findings through primary respondents from all the major regions we are working on.


Free Customization
Fortune 500 Clients
Free Yearly Update On Purchase Of Multi/Corporate License
Companies Served Till Date