- +1-315-215-1633
- sales@thebrainyinsights.com

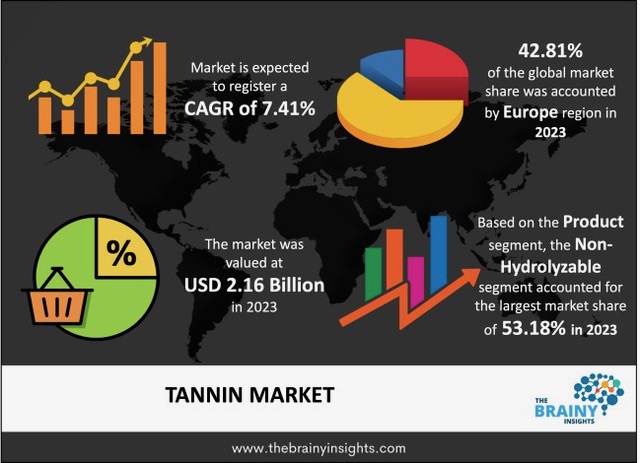
The global tannin market was valued at USD 2.16 Billion in 2023 and grew at a CAGR of 7.41% from 2024 to 2033. The market is expected to reach USD 4.41 Billion by 2033. The growth of the tannin market can be attributed to the rising demand in leather tanning and wine production applications.
Tannins, known as tannic acid, are water-soluble polyphenols in various plant-based diets. In experimental animals, they cause reductions in feed intake, growth rate, feed efficiency, protein digestibility and net metabolizable energy. Consequently, meals high in tannins are regarded as having little nutritious value. Commercial tannins are often amorphous, pale yellow to light brown, and can take the shape of flakes, powder, or a spongy mass. Their main uses include dying textiles, tanning leather, creating ink, and several medicinal uses. Solutions containing tannins taste astringent and are acidic. Chemically speaking, tannins can be divided into two major categories: condensed and hydrolyzable. Extracts from wattle, mangrove and quebracho wood or bark are among the significant sources of condensed tannins. The ester connection between gallic acid and polyols, which hydrolyze when many edible fruits develop, is linked to their antibacterial effects. Thus, the tannins in these fruits act as a natural barrier against microbial diseases.
Get an overview of this study by requesting a free sample
Increasing consumption of tannin in leather tanning: Leather needs to be tanned to prevent the rawhide from decaying. The raw hide or skin's protein is stabilized throughout the tanning process, avoiding putrefaction and preparing it for a range of final uses. Tannins are the only substances that may give tanned leather these distinctive qualities that make it remarkable and easy to identify. For instance, the smell of leather is a common and distinctive scent that bestows particular qualities. Vegetable tannins, both liquid and powder, are used by artisans in the tanning process today. The most well-known and oldest extract comes from chestnut wood. It enables the creation of heavier, harder, faster, stiffer, and fairly impervious to wet leather. It has been widely employed in leather production in Germany, Austria, and France.
Cost of production: The fluctuating cost of tannin is a market restraint. The medium—and small-scale industries need help coping with the fluctuating raw materials and processing costs. Due to their complexity and high energy cost of synthesis, the growth of the tannins market has been restricted in certain applications.
Increasing growth of the leather industry: Future growth in the global leather sector is extremely promising. The fashion industry's growing need for leather goods is the driving force behind it. The country's expanding middle class, growing disposable income, and rapid urbanization are predicted to fuel demand for leather goods. New methods like automation are used to make the sector more productive and less expensive. Using environmentally friendly materials, such as vegetable-tanned leather, which is becoming increasingly popular in the fashion business, can also benefit the sector.
The regions analyzed for the market include North America, Europe, South America, Asia Pacific, the Middle East, and Africa. Europe emerged as the most significant tannin market, with a 42.81% market revenue share in 2023.
The Europe region will account for the largest market share with revenue growth. The rising demand for tannin in leather tanning in the regional country drives the market's growth. Furthermore, increasing purchasing power makes more consumers willing to purchase leather products in the region. The increasing popularity of wine in countries such as Germany, France, and the U.K. has led to the widespread usage of tannin in wine production.
Europe region Tannin Market Share in 2023 - 42.81%
www.thebrainyinsights.com
Check the geographical analysis of this market by requesting a free sample
The source segment is divided into plants and brown algae. The brown algae segment dominated the market, with a share of around 67.73% in 2023. Phlorotannins are a particular class of tannins produced by brown algae. Brown algae contain polyphenolic chemicals called phenoltannins. They comprise most of the phenolic chemicals in marine algae that are antioxidants.
The product segment is divided into phlorotannin, hydrolyzable and non-hydrolyzable. The non-hydrolyzable segment dominated the market, with a share of around 53.18% in 2023. Non-hydrolyzable tannins are polymers created when flavans condense. There are no sugar residues in them. Most condensed tannins are soluble in water, while occasionally, they can dissolve in organic solvents like octanol.
The application segment is divided into wine production, leather tanning, anti-corrosive primers, wood adhesives and others. The leather tanning segment dominated the market, with a share of around 58.61% in 2023. Tanning imparts durability to leather by altering the chemistry of the fibres, making it more difficult for fungi and bacteria to break them down.
| Attribute | Description |
|---|---|
| Market Size | Revenue (USD Billion) |
| Market size value in 2023 | USD 2.16 Billion |
| Market size value in 2033 | USD 4.41 Billion |
| CAGR (2024 to 2033) | 7.41% |
| Historical data | 2020-2022 |
| Base Year | 2023 |
| Forecast | 2024-2033 |
| Region | The regions analyzed for the market are Asia Pacific, Europe, South America, North America, and Middle East & Africa. Furthermore, the regions are further analyzed at the country level. |
| Segments | Source, Product and Application |
As per The Brainy Insights, the size of the tannin market was valued at USD 2.16 Billion in 2023 to USD 4.41 Billion by 2033.
Global tannin market is growing at a CAGR of 7.41% during the forecast period 2024-2033.
Europe region emerged as the largest market for the tannin.
The market's growth will be influenced by the rising application of tannin.
The high cost of manufacturing can hamper the market growth.
The increasing demand for wine is providing huge opportunities to the market.
Key players are Ajinomoto OmniChem, Tannin Corporation, TANACamong, Ever S.R.L, Polson Ltd., LaffortSA, UCL Company Ltd., Tanin D.D., W. ULRICH GmbH, Jyoti Dye Chem Agency others.
1. Introduction
1.1. Objectives of the Study
1.2. Market Definition
1.3. Research Scope
1.4. Currency
1.5. Key Target Audience
2. Research Methodology and Assumptions
3. Executive Summary
4. Premium Insights
4.1. Porter’s Five Forces Analysis
4.2. Value Chain Analysis
4.3. Top Investment Pockets
4.3.1. Market Attractiveness Analysis by Source
4.3.2. Market Attractiveness Analysis by Product
4.3.3. Market Attractiveness Analysis by Application
4.3.4. Market Attractiveness Analysis by Region
4.4. Industry Trends
5. Market Dynamics
5.1. Market Evaluation
5.2. Drivers
5.2.1. Increasing demand for tannin in different applications
5.3. Restraints
5.3.1. High cost
5.4. Opportunities
5.4.1. Growth of wine processing industry
5.5. Challenges
5.5.1. Reduced amount of iron absorption
6. Global Tannin Market Analysis and Forecast, By Source
6.1. Segment Overview
6.2. Plants
6.3. Brown Algae
7. Global Tannin Market Analysis and Forecast, By Product
7.1. Segment Overview
7.2. Phlorotannin
7.3. Hydrolysable
7.4. Non-Hydrolysable
8. Global Tannin Market Analysis and Forecast, By Application
8.1. Segment Overview
8.2. Wine Production
8.3. Leather Tanning
8.4. Anti-Corrosive Primers
8.5. Wood Adhesives
8.6. Others
9. Global Tannin Market Analysis and Forecast, By Regional Analysis
9.1. Segment Overview
9.2. North America
9.2.1. U.S.
9.2.2. Canada
9.2.3. Mexico
9.3. Europe
9.3.1. Germany
9.3.2. France
9.3.3. U.K.
9.3.4. Italy
9.3.5. Spain
9.4. Asia-Pacific
9.4.1. Japan
9.4.2. China
9.4.3. India
9.5. South America
9.5.1. Brazil
9.6. Middle East and Africa
9.6.1. UAE
9.6.2. South Africa
10. Global Tannin Market-Competitive Landscape
10.1. Overview
10.2. Market Share of Key Players in the Tannin Market
10.2.1. Global Company Market Share
10.2.2. North America Company Market Share
10.2.3. Europe Company Market Share
10.2.4. APAC Company Market Share
10.3. Competitive Situations and Trends
10.3.1. Product Launches and Developments
10.3.2. Partnerships, Collaborations, and Agreements
10.3.3. Mergers & Acquisitions
10.3.4. Expansions
11. Company Profiles
11.1. Boumatic
11.1.1. Business Overview
11.1.2. Company Snapshot
11.1.3. Company Market Share Analysis
11.1.4. Company Product Portfolio
11.1.5. Recent Developments
11.1.6. SWOT Analysis
11.2. Nedap N.V.
11.2.1. Business Overview
11.2.2. Company Snapshot
11.2.3. Company Market Share Analysis
11.2.4. Company Product Portfolio
11.2.5. Recent Developments
11.3. Allflex Livestock Intelligence
11.3.1. Business Overview
11.3.2. Company Snapshot
11.3.3. Company Market Share Analysis
11.3.4. Company Product Portfolio
11.3.5. Recent Developments
11.3.6. SWOT Analysis
11.4. Delaval
11.4.1. Business Overview
11.4.2. Company Snapshot
11.4.3. Company Market Share Analysis
11.4.4. Company Product Portfolio
11.4.5. Recent Developments
11.4.6. SWOT Analysis
11.5. Afimilk Ltd.
11.5.1. Business Overview
11.5.2. Company Snapshot
11.5.3. Company Market Share Analysis
11.5.4. Company Product Portfolio
11.5.5. Recent Developments
11.5.6. SWOT Analysis
11.6. Cowmanager B.V.
11.6.1. Business Overview
11.6.2. Company Snapshot
11.6.3. Company Market Share Analysis
11.6.4. Company Product Portfolio
11.6.5. Recent Developments
11.6.6. SWOT Analysis
11.7. Engs Systems
11.7.1. Business Overview
11.7.2. Company Snapshot
11.7.3. Company Market Share Analysis
11.7.4. Company Product Portfolio
11.7.5. Recent Developments
11.7.6. SWOT Analysis
11.8. Herdinsights
11.8.1. Business Overview
11.8.2. Company Snapshot
11.8.3. Company Market Share Analysis
11.8.4. Company Product Portfolio
11.8.5. Recent Developments
11.8.6. SWOT Analysis
11.9. Zoetis
11.9.1. Business Overview
11.9.2. Company Snapshot
11.9.3. Company Market Share Analysis
11.9.4. Company Product Portfolio
11.9.5. Recent Developments
11.9.6. SWOT Analysis
11.10. Smaxtec Animal Care GmbH
11.10.1. Business Overview
11.10.2. Company Snapshot
11.10.3. Company Market Share Analysis
11.10.4. Company Product Portfolio
11.10.5. Recent Developments
11.10.6. SWOT Analysis
11.11. Cainthus
11.11.1. Business Overview
11.11.2. Company Snapshot
11.11.3. Company Market Share Analysis
11.11.4. Company Product Portfolio
11.11.5. Recent Developments
11.11.6. SWOT Analysis
11.12. Dairymaster
11.12.1. Business Overview
11.12.2. Company Snapshot
11.12.3. Company Market Share Analysis
11.12.4. Company Product Portfolio
11.12.5. Recent Developments
11.12.6. SWOT Analysis
11.13. Serket
11.13.1. Business Overview
11.13.2. Company Snapshot
11.13.3. Company Market Share Analysis
11.13.4. Company Product Portfolio
11.13.5. Recent Developments
11.13.6. SWOT Analysis
11.14. Gallagher Group Limited
11.14.1. Business Overview
11.14.2. Company Snapshot
11.14.3. Company Market Share Analysis
11.14.4. Company Product Portfolio
11.14.5. Recent Developments
11.14.6. SWOT Analysis
11.15. Stellapps Technologies
11.15.1. Business Overview
11.15.2. Company Snapshot
11.15.3. Company Market Share Analysis
11.15.4. Company Product Portfolio
11.15.5. Recent Developments
11.15.6. SWOT Analysis
11.16. Moocall
11.16.1. Business Overview
11.16.2. Company Snapshot
11.16.3. Company Market Share Analysis
11.16.4. Company Product Portfolio
11.16.5. Recent Developments
11.16.6. SWOT Analysis
11.17. Connecterra B.V.
11.17.1. Business Overview
11.17.2. Company Snapshot
11.17.3. Company Market Share Analysis
11.17.4. Company Product Portfolio
11.17.5. Recent Developments
11.17.6. SWOT Analysis
11.18. Icerobotics
11.18.1. Business Overview
11.18.2. Company Snapshot
11.18.3. Company Market Share Analysis
11.18.4. Company Product Portfolio
11.18.5. Recent Developments
11.18.6. SWOT Analysis
11.19. Hokofarm Group
11.19.1. Business Overview
11.19.2. Company Snapshot
11.19.3. Company Market Share Analysis
11.19.4. Company Product Portfolio
11.19.5. Recent Developments
11.19.6. SWOT Analysis
11.20. Faromatics
11.20.1. Business Overview
11.20.2. Company Snapshot
11.20.3. Company Market Share Analysis
11.20.4. Company Product Portfolio
11.20.5. Recent Developments
11.20.6. SWOT Analysis
11.21. Cowlar
11.21.1. Business Overview
11.21.2. Company Snapshot
11.21.3. Company Market Share Analysis
11.21.4. Company Product Portfolio
11.21.5. Recent Developments
11.21.6. SWOT Analysis
List of Table
1. Global Tannin Market, By Source, 2020-2033 (USD Billion)
2. Global Plants, Tannin Market, By Region, 2020-2033 (USD Billion)
3. Global Brown Algae, Tannin Market, By Region, 2020-2033 (USD Billion)
4. Global Tannin Market, By Product, 2020-2033 (USD Billion)
5. Global Phlorotannin, Tannin Market, By Region, 2020-2033 (USD Billion)
6. Global Hydrolysable, Tannin Market, By Region, 2020-2033 (USD Billion)
7. Global Non-Hydrolysable, Tannin Market, By Region, 2020-2033 (USD Billion)
8. Global Tannin Market, By Application, 2020-2033 (USD Billion)
9. Global Wine Production, Tannin Market, By Region, 2020-2033 (USD Billion)
10. Global Leather Tanning, Tannin Market, By Region, 2020-2033 (USD Billion)
11. Global Anti-Corrosive Primers, Tannin Market, By Region, 2020-2033 (USD Billion)
12. Global Wood Adhesives, Tannin Market, By Region, 2020-2033 (USD Billion)
13. Global Others, Tannin Market, By Region, 2020-2033 (USD Billion)
14. Global Tannin Market, By Region, 2020-2033 (USD Billion)
15. North America Tannin Market, By Source, 2020-2033 (USD Billion)
16. North America Tannin Market, By Product, 2020-2033 (USD Billion)
17. North America Tannin Market, By Application, 2020-2033 (USD Billion)
18. U.S. Tannin Market, By Source, 2020-2033 (USD Billion)
19. U.S. Tannin Market, By Product, 2020-2033 (USD Billion)
20. U.S. Tannin Market, By Application, 2020-2033 (USD Billion)
21. Canada Tannin Market, By Source, 2020-2033 (USD Billion)
22. Canada Tannin Market, By Product, 2020-2033 (USD Billion)
23. Canada Tannin Market, By Application, 2020-2033 (USD Billion)
24. Mexico Tannin Market, By Source, 2020-2033 (USD Billion)
25. Mexico Tannin Market, By Product, 2020-2033 (USD Billion)
26. Mexico Tannin Market, By Application, 2020-2033 (USD Billion)
27. Europe Tannin Market, By Source, 2020-2033 (USD Billion)
28. Europe Tannin Market, By Product, 2020-2033 (USD Billion)
29. Europe Tannin Market, By Application, 2020-2033 (USD Billion)
30. Germany Tannin Market, By Source, 2020-2033 (USD Billion)
31. Germany Tannin Market, By Product, 2020-2033 (USD Billion)
32. Germany Tannin Market, By Application, 2020-2033 (USD Billion)
33. France Tannin Market, By Source, 2020-2033 (USD Billion)
34. France Tannin Market, By Product, 2020-2033 (USD Billion)
35. France Tannin Market, By Application, 2020-2033 (USD Billion)
36. U.K. Tannin Market, By Source, 2020-2033 (USD Billion)
37. U.K. Tannin Market, By Product, 2020-2033 (USD Billion)
38. U.K. Tannin Market, By Application, 2020-2033 (USD Billion)
39. Italy Tannin Market, By Source, 2020-2033 (USD Billion)
40. Italy Tannin Market, By Product, 2020-2033 (USD Billion)
41. Italy Tannin Market, By Application, 2020-2033 (USD Billion)
42. Spain Tannin Market, By Source, 2020-2033 (USD Billion)
43. Spain Tannin Market, By Product, 2020-2033 (USD Billion)
44. Spain Tannin Market, By Application, 2020-2033 (USD Billion)
45. Asia Pacific Tannin Market, By Source, 2020-2033 (USD Billion)
46. Asia Pacific Tannin Market, By Product, 2020-2033 (USD Billion)
47. Asia Pacific Tannin Market, By Application, 2020-2033 (USD Billion)
48. Japan Tannin Market, By Source, 2020-2033 (USD Billion)
49. Japan Tannin Market, By Product, 2020-2033 (USD Billion)
50. Japan Tannin Market, By Application, 2020-2033 (USD Billion)
51. China Tannin Market, By Source, 2020-2033 (USD Billion)
52. China Tannin Market, By Product, 2020-2033 (USD Billion)
53. China Tannin Market, By Application, 2020-2033 (USD Billion)
54. India Tannin Market, By Source, 2020-2033 (USD Billion)
55. India Tannin Market, By Product, 2020-2033 (USD Billion)
56. India Tannin Market, By Application, 2020-2033 (USD Billion)
57. South America Tannin Market, By Source, 2020-2033 (USD Billion)
58. South America Tannin Market, By Product, 2020-2033 (USD Billion)
59. South America Tannin Market, By Application, 2020-2033 (USD Billion)
60. Brazil Tannin Market, By Source, 2020-2033 (USD Billion)
61. Brazil Tannin Market, By Product, 2020-2033 (USD Billion)
62. Brazil Tannin Market, By Application, 2020-2033 (USD Billion)
63. Middle East and Africa Tannin Market, By Source, 2020-2033 (USD Billion)
64. Middle East and Africa Tannin Market, By Product, 2020-2033 (USD Billion)
65. Middle East and Africa Tannin Market, By Application, 2020-2033 (USD Billion)
66. UAE Tannin Market, By Source, 2020-2033 (USD Billion)
67. UAE Tannin Market, By Product, 2020-2033 (USD Billion)
68. UAE Tannin Market, By Application, 2020-2033 (USD Billion)
69. South Africa Tannin Market, By Source, 2020-2033 (USD Billion)
70. South Africa Tannin Market, By Product, 2020-2033 (USD Billion)
71. South Africa Tannin Market, By Application, 2020-2033 (USD Billion)
List of Figures
1. Global Tannin Market Segmentation
2. Tannin Market: Research Methodology
3. Market Size Estimation Methodology: Bottom-Up Approach
4. Market Size Estimation Methodology: Top-Down Approach
5. Data Triangulation
6. Porter’s Five Forces Analysis
7. Value Chain Analysis
8. Global Tannin Market Attractiveness Analysis by Source
9. Global Tannin Market Attractiveness Analysis by Product
10. Global Tannin Market Attractiveness Analysis by Application
11. Global Tannin Market Attractiveness Analysis by Region
12. Global Tannin Market: Dynamics
13. Global Tannin Market Share by Source (2023 & 2033)
14. Global Tannin Market Share by Product (2023 & 2033)
15. Global Tannin Market Share by Application (2023 & 2033)
16. Global Tannin Market Share by Regions (2023 & 2033)
17. Global Tannin Market Share by Company (2023)
This study forecasts revenue at global, regional, and country levels from 2020 to 2033. The Brainy Insights has segmented the global tannin market based on below mentioned segments:
Global Tannin Market by Source:
Global Tannin Market by Application:
Global Tannin Market by Region:
Research has its special purpose to undertake marketing efficiently. In this competitive scenario, businesses need information across all industry verticals; the information about customer wants, market demand, competition, industry trends, distribution channels etc. This information needs to be updated regularly because businesses operate in a dynamic environment. Our organization, The Brainy Insights incorporates scientific and systematic research procedures in order to get proper market insights and industry analysis for overall business success. The analysis consists of studying the market from a miniscule level wherein we implement statistical tools which helps us in examining the data with accuracy and precision.
Our research reports feature both; quantitative and qualitative aspects for any market. Qualitative information for any market research process are fundamental because they reveal the customer needs and wants, usage and consumption for any product/service related to a specific industry. This in turn aids the marketers/investors in knowing certain perceptions of the customers. Qualitative research can enlighten about the different product concepts and designs along with unique service offering that in turn, helps define marketing problems and generate opportunities. On the other hand, quantitative research engages with the data collection process through interviews, e-mail interactions, surveys and pilot studies. Quantitative aspects for the market research are useful to validate the hypotheses generated during qualitative research method, explore empirical patterns in the data with the help of statistical tools, and finally make the market estimations.
The Brainy Insights offers comprehensive research and analysis, based on a wide assortment of factual insights gained through interviews with CXOs and global experts and secondary data from reliable sources. Our analysts and industry specialist assume vital roles in building up statistical tools and analysis models, which are used to analyse the data and arrive at accurate insights with exceedingly informative research discoveries. The data provided by our organization have proven precious to a diverse range of companies, facilitating them to address issues such as determining which products/services are the most appealing, whether or not customers use the product in the manner anticipated, the purchasing intentions of the market and many others.
Our research methodology encompasses an idyllic combination of primary and secondary initiatives. Key phases involved in this process are listed below:

The phase involves the gathering and collecting of market data and its related information with the help of different sources & research procedures.

The data procurement stage involves in data gathering and collecting through various data sources.
This stage involves in extensive research. These data sources includes:
Purchased Database: Purchased databases play a crucial role in estimating the market sizes irrespective of the domain. Our purchased database includes:
Primary Research: The Brainy Insights interacts with leading companies and experts of the concerned domain to develop the analyst team’s market understanding and expertise. It improves and substantiates every single data presented in the market reports. Primary research mainly involves in telephonic interviews, E-mail interactions and face-to-face interviews with the raw material providers, manufacturers/producers, distributors, & independent consultants. The interviews that we conduct provides valuable data on market size and industry growth trends prevailing in the market. Our organization also conducts surveys with the various industry experts in order to gain overall insights of the industry/market. For instance, in healthcare industry we conduct surveys with the pharmacists, doctors, surgeons and nurses in order to gain insights and key information of a medical product/device/equipment which the customers are going to usage. Surveys are conducted in the form of questionnaire designed by our own analyst team. Surveys plays an important role in primary research because surveys helps us to identify the key target audiences of the market. Additionally, surveys helps to identify the key target audience engaged with the market. Our survey team conducts the survey by targeting the key audience, thus gaining insights from them. Based on the perspectives of the customers, this information is utilized to formulate market strategies. Moreover, market surveys helps us to understand the current competitive situation of the industry. To be precise, our survey process typically involve with the 360 analysis of the market. This analytical process begins by identifying the prospective customers for a product or service related to the market/industry to obtain data on how a product/service could fit into customers’ lives.

Secondary Research: The secondary data sources includes information published by the on-profit organizations such as World bank, WHO, company fillings, investor presentations, annual reports, national government documents, statistical databases, blogs, articles, white papers and others. From the annual report, we analyse a company’s revenue to understand the key segment and market share of that organization in a particular region. We analyse the company websites and adopt the product mapping technique which is important for deriving the segment revenue. In the product mapping method, we select and categorize the products offered by the companies catering to domain specific market, deduce the product revenue for each of the companies so as to get overall estimation of the market size. We also source data and analyses trends based on information received from supply side and demand side intermediaries in the value chain. The supply side denotes the data gathered from supplier, distributor, wholesaler and the demand side illustrates the data gathered from the end customers for respective market domain.

The supply side for a domain specific market is analysed by:
The demand side for the market is estimated through:
In-house Library: Apart from these third-party sources, we have our in-house library of qualitative and quantitative information. Our in-house database includes market data for various industry and domains. These data are updated on regular basis as per the changing market scenario. Our library includes, historic databases, internal audit reports and archives.
Sometimes there are instances where there is no metadata or raw data available for any domain specific market. For those cases, we use our expertise to forecast and estimate the market size in order to generate comprehensive data sets. Our analyst team adopt a robust research technique in order to produce the estimates:
Data Synthesis: This stage involves the analysis & mapping of all the information obtained from the previous step. It also involves in scrutinizing the data for any discrepancy observed while data gathering related to the market. The data is collected with consideration to the heterogeneity of sources. Robust scientific techniques are in place for synthesizing disparate data sets and provide the essential contextual information that can orient market strategies. The Brainy Insights has extensive experience in data synthesis where the data passes through various stages:


Market Deduction & Formulation: The final stage comprises of assigning data points at appropriate market spaces so as to deduce feasible conclusions. Analyst perspective & subject matter expert based holistic form of market sizing coupled with industry analysis also plays a crucial role in this stage.
This stage involves in finalization of the market size and numbers that we have collected from data integration step. With data interpolation, it is made sure that there is no gap in the market data. Successful trend analysis is done by our analysts using extrapolation techniques, which provide the best possible forecasts for the market.
Data Validation & Market Feedback: Validation is the most important step in the process. Validation & re-validation via an intricately designed process helps us finalize data-points to be used for final calculations.

The Brainy Insights interacts with leading companies and experts of the concerned domain to develop the analyst team’s market understanding and expertise. It improves and substantiates every single data presented in the market reports. The data validation interview and discussion panels are typically composed of the most experienced industry members. The participants include, however, are not limited to:
Moreover, we always validate our data and findings through primary respondents from all the major regions we are working on.


Free Customization
Fortune 500 Clients
Free Yearly Update On Purchase Of Multi/Corporate License
Companies Served Till Date