- +1-315-215-1633
- sales@thebrainyinsights.com

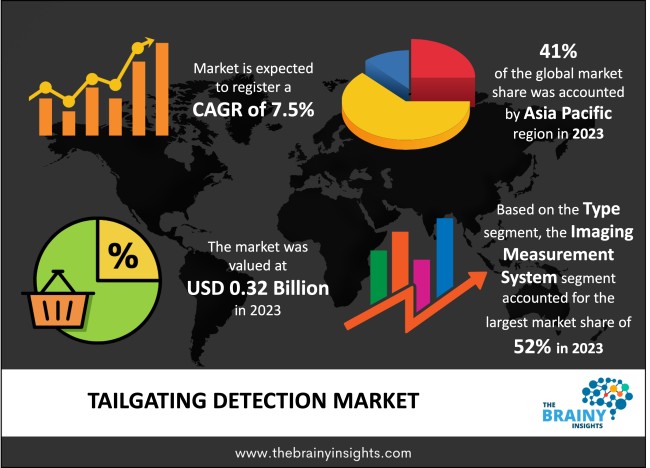
The global Tailgating Detection market was valued at USD 0.32 billion in 2023 and growing at a CAGR of 7.5% from 2024 to 2033. The market is expected to reach USD 0.66 billion by 2033. Integration of AI and ML in Tailgating Detection and increasing need for enhanced security in the market will potentially drive the growth of the Tailgating Detection Market. Whereas, rapidly emerging technological advancements may drive the growth of the Tailgating Detection Market in the period forecasted.
Tailgating detection is pivotal for identifying and alerting authorities when an unauthorized individual closely follows an authorized person to enter a secured area without proper authentication, a security breach known as tailgating. This breach undermines standard access controls, posing significant risks and compromising the integrity of restricted zones. Tailgating detection enhances security measures by promptly identifying and generating real-time alerts using technologies like surveillance cameras, access control systems, infrared sensors, and biometric authentication, thereby preventing unauthorized access to sensitive or high-security areas.
Get an overview of this study by requesting a free sample
Integration of AI and ML in Tailgating Detection– The security industry is witnessing a growing trend towards integrated security systems, consolidating functionalities such as access control, surveillance, and intruder detection. This holistic integration enhances security management. Additionally, a significant advancement is the integration of artificial intelligence (AI) capabilities into tailgating detection systems. AI algorithms can analyze real-time data from various sources, improving the precision of threat detection by identifying anomalies and potential security breaches more effectively.
Increased cost of security systems– A notable consideration is the significant cost linked with deploying tailgating detection systems. The upfront expenses encompass expenditures on hardware, software, installation, and ongoing maintenance, which can be considerable for businesses, particularly smaller ones operating within constrained budgets.
Rapidly emerging technological advancements- Technological progress has facilitated the creation of increasingly sophisticated and precise tailgating detection solutions. These systems leverage a range of technologies including sensors, video analytics, and artificial intelligence to reliably detect and identify instances of tailgating. This advancement has greatly enhanced the efficacy of security measures and decreased the occurrence of false alarms. As a result, these factors are expected to drive growth in the tailgating detection market during the forecast period.
The regions analyzed for the market include North America, Europe, South America, Asia Pacific, the Middle East, and Africa. APAC emerged as the largest global Tailgating Detection market, accounting for 41% of the total market. Further, it is expected to be the fastest growing in the region. Owing to increasing investments and government funding coupled with rapid urbanization and tremendous growth in the APAC countries: India, China, Japan to name a few.
APAC Region Tailgating Detection Market Share in 2023 - 41%
www.thebrainyinsights.com
Check the geographical analysis of this market by requesting a free sample
In 2023, the imaging measurement system dominated the market with a commanding 52% share and is projected to maintain its position as the fastest-growing segment. This system excels in identifying both the tailgate of individuals and vehicles. With advanced image processing algorithms employed in video analytics, it can accurately determine people counts and recognize license plates of vehicles.
Governments worldwide are placing significant emphasis on developing smart cities to enhance road traffic management, citizen safety, energy efficiency, and economic prosperity. Consequently, the adoption of imaging measurement systems is expected to surge in the upcoming years. Furthermore, the system's high level of customization and scalability is a key factor driving its adoption among end-users, thereby propelling growth in the tailgate detection system market.
In 2023, the government departments and organizations segment dominated the market, securing a 43% market share. This segment comprises various entities such as government facilities, defense installations, railway stations, airports, ports, municipalities, and utility stations. With a growing focus on national security, governments worldwide are making substantial investments in advanced security solutions, including tailgate detection systems. Unauthorized access to these critical assets and data could pose unforeseen national security threats.
airports and metro authorities are increasingly adopting tailgate detection systems to bolster their security measures. Moreover, the emphasis on developing smart cities is driving market growth, as tailgate detection systems play a role in managing traffic and parking spaces in urban areas.
| Attribute | Description |
|---|---|
| Market Size | Revenue (USD Billion) |
| Market size value in 2023 | USD 0.32 Billion |
| Market size value in 2033 | USD 0.66 Billion |
| CAGR (2024 to 2033) | 7.5% |
| Historical data | 2020-2022 |
| Base Year | 2023 |
| Forecast | 2024-2033 |
| Region | The regions analyzed for the market are Asia Pacific, Europe, South America, North America, and Middle East & Africa. Furthermore, the regions are further analyzed at the country level. |
| Segments | Type, Application |
As per The Brainy Insights, the size of the tailgating detection market was valued at USD 4.5 billion in 2023 to USD 8.45 billion by 2033.
The global Tailgating Detection market is growing at a CAGR of 7.5% during the forecast period 2024-2033.
The Asia Pacific region emerged as the largest market for the tailgating detection.
The integration of ai and ml in tailgating detection will influence the market's growth.
1. Introduction
1.1. Objectives of the Study
1.2. Market Definition
1.3. Research Scope
1.4. Currency
1.5. Key Target Audience
2. Research Methodology and Assumptions
3. Executive Summary
4. Premium Insights
4.1. Porter’s Five Forces Analysis
4.2. Value Chain Analysis
4.3. Top Investment Pockets
4.3.1. Market Attractiveness Analysis by Type
4.3.2. Market Attractiveness Analysis by Application
4.3.3. Market Attractiveness Analysis by Region
4.4. Industry Trends
5. Market Dynamics
5.1. Market Evaluation
5.2. Drivers
5.2.1. Integration of AI and ML in Tailgating Detection
5.2.2. Increasing need for enhanced security in the market
5.3. Restraints
5.3.1. Increased cost of security systems
5.4. Opportunities
5.4.1. Rapidly emerging technological advancements
5.5. Challenges
5.5.1. Lack of Awareness of Tailgating Detection
6. Global Tailgating Detection Market Analysis and Forecast, By Type
6.1. Segment Overview
6.2. Imaging Measurement System
6.3. Non-Imaging System
7. Global Tailgating Detection Market Analysis and Forecast, By Application
7.1. Segment Overview
7.2. Commercial
7.3. Government Departments and Organizations
8. Global Tailgating Detection Market Analysis and Forecast, By Regional Analysis
8.1. Segment Overview
8.2. North America
8.2.1. U.S.
8.2.2. Canada
8.2.3. Mexico
8.3. Europe
8.3.1. Germany
8.3.2. France
8.3.3. U.K.
8.3.4. Italy
8.3.5. Spain
8.4. Asia-Pacific
8.4.1. Japan
8.4.2. China
8.4.3. India
8.5. South America
8.5.1. Brazil
8.6. Middle East and Africa
8.6.1. UAE
8.6.2. South Africa
9. Global Tailgating Detection Market-Competitive Landscape
9.1. Overview
9.2. Market Share of Key Players in Global Tailgating Detection Market
9.2.1. Global Company Market Share
9.2.2. North America Company Market Share
9.2.3. Europe Company Market Share
9.2.4. APAC Company Market Share
9.3. Competitive Situations and Trends
9.3.1. Product Launches and Developments
9.3.2. Partnerships, Collaborations, and Agreements
9.3.3. Mergers & Acquisitions
9.3.4. Expansions
10. Company Profiles
10.1. IDL
10.1.1. Business Overview
10.1.2. Company Snapshot
10.1.3. Company Market Share Analysis
10.1.4. Company Product Portfolio
10.1.5. Recent Developments
10.1.6. SWOT Analysis
10.2. Optex
10.2.1. Business Overview
10.2.2. Company Snapshot
10.2.3. Company Market Share Analysis
10.2.4. Company Product Portfolio
10.2.5. Recent Developments
10.2.6. SWOT Analysis
10.3. Newton Security
10.3.1. Business Overview
10.3.2. Company Snapshot
10.3.3. Company Market Share Analysis
10.3.4. Company Product Portfolio
10.3.5. Recent Developments
10.3.6. SWOT Analysis
10.4. Irisys
10.4.1. Business Overview
10.4.2. Company Snapshot
10.4.3. Company Market Share Analysis
10.4.4. Company Product Portfolio
10.4.5. Recent Developments
10.4.6. SWOT Analysis
10.5. Detex
10.5.1. Business Overview
10.5.2. Company Snapshot
10.5.3. Company Market Share Analysis
10.5.4. Company Product Portfolio
10.5.5. Recent Developments
10.5.6. SWOT Analysis
10.6. IEE S.A.
10.6.1. Business Overview
10.6.2. Company Snapshot
10.6.3. Company Market Share Analysis
10.6.4. Company Product Portfolio
10.6.5. Recent Developments
10.6.6. SWOT Analysis
10.7. Keyscan
10.7.1. Business Overview
10.7.2. Company Snapshot
10.7.3. Company Market Share Analysis
10.7.4. Company Product Portfolio
10.7.5. Recent Developments
10.7.6. SWOT Analysis
10.8. Kouba Systems
10.8.1. Business Overview
10.8.2. Company Snapshot
10.8.3. Company Market Share Analysis
10.8.4. Company Product Portfolio
10.8.5. Recent Developments
10.8.6. SWOT Analysis
10.9. TDSi Integrated Security Solutions
10.9.1. Business Overview
10.9.2. Company Snapshot
10.9.3. Company Market Share Analysis
10.9.4. Company Product Portfolio
10.9.5. Recent Developments
10.9.6. SWOT Analysis
10.10. Axis
10.10.1. Business Overview
10.10.2. Company Snapshot
10.10.3. Company Market Share Analysis
10.10.4. Company Product Portfolio
10.10.5. Recent Developments
10.10.6. SWOT Analysis
List of Table
1. Global Tailgating Detection Market, By Type, 2020-2033 (USD Billion)
2. Global Imaging Measurement System, Tailgating Detection Market, By Region, 2020-2033 (USD Billion)
3. Global Non-Imaging System, Tailgating Detection Market, By Region, 2020-2033 (USD Billion)
4. Global Tailgating Detection Market, By Application, 2020-2033 (USD Billion)
5. Global Commercial, Tailgating Detection Market, By Region, 2020-2033 (USD Billion)
6. Global Government Departments and Organizations, Tailgating Detection Market, By Region, 2020-2033 (USD Billion)
7. Global Tailgating Detection Market, By Region, 2020-2033 (USD Billion)
8. North America Tailgating Detection Market, By Type, 2020-2033 (USD Billion)
9. North America Tailgating Detection Market, By Application, 2020-2033 (USD Billion)
10. U.S. Tailgating Detection Market, By Type, 2020-2033 (USD Billion)
11. U.S. Tailgating Detection Market, By Application, 2020-2033 (USD Billion)
12. Canada Tailgating Detection Market, By Type, 2020-2033 (USD Billion)
13. Canada Tailgating Detection Market, By Application, 2020-2033 (USD Billion)
14. Mexico Tailgating Detection Market, By Type, 2020-2033 (USD Billion)
15. Mexico Tailgating Detection Market, By Application, 2020-2033 (USD Billion)
16. Europe Tailgating Detection Market, By Type, 2020-2033 (USD Billion)
17. Europe Tailgating Detection Market, By Application, 2020-2033 (USD Billion)
18. Germany Tailgating Detection Market, By Type, 2020-2033 (USD Billion)
19. Germany Tailgating Detection Market, By Application, 2020-2033 (USD Billion)
20. France Tailgating Detection Market, By Type, 2020-2033 (USD Billion)
21. France Tailgating Detection Market, By Application, 2020-2033 (USD Billion)
22. U.K. Tailgating Detection Market, By Type, 2020-2033 (USD Billion)
23. U.K. Tailgating Detection Market, By Application, 2020-2033 (USD Billion)
24. Italy Tailgating Detection Market, By Type, 2020-2033 (USD Billion)
25. Italy Tailgating Detection Market, By Application, 2020-2033 (USD Billion)
26. Spain Tailgating Detection Market, By Type, 2020-2033 (USD Billion)
27. Spain Tailgating Detection Market, By Application, 2020-2033 (USD Billion)
28. Asia Pacific Tailgating Detection Market, By Type, 2020-2033 (USD Billion)
29. Asia Pacific Tailgating Detection Market, By Application, 2020-2033 (USD Billion)
30. Japan Tailgating Detection Market, By Type, 2020-2033 (USD Billion)
31. Japan Tailgating Detection Market, By Application, 2020-2033 (USD Billion)
32. China Tailgating Detection Market, By Type, 2020-2033 (USD Billion)
33. China Tailgating Detection Market, By Application, 2020-2033 (USD Billion)
34. India Tailgating Detection Market, By Type, 2020-2033 (USD Billion)
35. India Tailgating Detection Market, By Application, 2020-2033 (USD Billion)
36. South America Tailgating Detection Market, By Type, 2020-2033 (USD Billion)
37. South America Tailgating Detection Market, By Application, 2020-2033 (USD Billion)
38. Brazil Tailgating Detection Market, By Type, 2020-2033 (USD Billion)
39. Brazil Tailgating Detection Market, By Application, 2020-2033 (USD Billion)
40. Middle East and Africa Tailgating Detection Market, By Type, 2020-2033 (USD Billion)
41. Middle East and Africa Tailgating Detection Market, By Application, 2020-2033 (USD Billion)
42. UAE Tailgating Detection Market, By Type, 2020-2033 (USD Billion)
43. UAE Tailgating Detection Market, By Application, 2020-2033 (USD Billion)
44. South Africa Tailgating Detection Market, By Type, 2020-2033 (USD Billion)
45. South Africa Tailgating Detection Market, By Application, 2020-2033 (USD Billion)
List of Figures
1. Global Tailgating Detection Market Segmentation
2. Global Tailgating Detection Market: Research Methodology
3. Market Size Estimation Methodology: Bottom-Up Approach
4. Market Size Estimation Methodology: Top-Down Approach
5. Data Triangulation
6. Porter’s Five Forces Analysis
7. Value Chain Analysis
8. Global Tailgating Detection Market Attractiveness Analysis by Type
9. Global Tailgating Detection Market Attractiveness Analysis by Application
10. Global Tailgating Detection Market Attractiveness Analysis by Region
11. Global Tailgating Detection Market: Dynamics
12. Global Tailgating Detection Market Share by Type (2023 & 2033)
13. Global Tailgating Detection Market Share by Application (2023 & 2033)
14. Global Tailgating Detection Market Share by Regions (2023 & 2033)
15. Global Tailgating Detection Market Share by Company (2023)
This study forecasts revenue at global, regional, and country levels from 2020 to 2033. The Brainy Insights has segmented the global tailgating detection market based on below-mentioned segments:
Global Tailgating Detection Market by Type:
Global Tailgating Detection Market by Application:
Global Tailgating Detection Market by Region:
Research has its special purpose to undertake marketing efficiently. In this competitive scenario, businesses need information across all industry verticals; the information about customer wants, market demand, competition, industry trends, distribution channels etc. This information needs to be updated regularly because businesses operate in a dynamic environment. Our organization, The Brainy Insights incorporates scientific and systematic research procedures in order to get proper market insights and industry analysis for overall business success. The analysis consists of studying the market from a miniscule level wherein we implement statistical tools which helps us in examining the data with accuracy and precision.
Our research reports feature both; quantitative and qualitative aspects for any market. Qualitative information for any market research process are fundamental because they reveal the customer needs and wants, usage and consumption for any product/service related to a specific industry. This in turn aids the marketers/investors in knowing certain perceptions of the customers. Qualitative research can enlighten about the different product concepts and designs along with unique service offering that in turn, helps define marketing problems and generate opportunities. On the other hand, quantitative research engages with the data collection process through interviews, e-mail interactions, surveys and pilot studies. Quantitative aspects for the market research are useful to validate the hypotheses generated during qualitative research method, explore empirical patterns in the data with the help of statistical tools, and finally make the market estimations.
The Brainy Insights offers comprehensive research and analysis, based on a wide assortment of factual insights gained through interviews with CXOs and global experts and secondary data from reliable sources. Our analysts and industry specialist assume vital roles in building up statistical tools and analysis models, which are used to analyse the data and arrive at accurate insights with exceedingly informative research discoveries. The data provided by our organization have proven precious to a diverse range of companies, facilitating them to address issues such as determining which products/services are the most appealing, whether or not customers use the product in the manner anticipated, the purchasing intentions of the market and many others.
Our research methodology encompasses an idyllic combination of primary and secondary initiatives. Key phases involved in this process are listed below:

The phase involves the gathering and collecting of market data and its related information with the help of different sources & research procedures.

The data procurement stage involves in data gathering and collecting through various data sources.
This stage involves in extensive research. These data sources includes:
Purchased Database: Purchased databases play a crucial role in estimating the market sizes irrespective of the domain. Our purchased database includes:
Primary Research: The Brainy Insights interacts with leading companies and experts of the concerned domain to develop the analyst team’s market understanding and expertise. It improves and substantiates every single data presented in the market reports. Primary research mainly involves in telephonic interviews, E-mail interactions and face-to-face interviews with the raw material providers, manufacturers/producers, distributors, & independent consultants. The interviews that we conduct provides valuable data on market size and industry growth trends prevailing in the market. Our organization also conducts surveys with the various industry experts in order to gain overall insights of the industry/market. For instance, in healthcare industry we conduct surveys with the pharmacists, doctors, surgeons and nurses in order to gain insights and key information of a medical product/device/equipment which the customers are going to usage. Surveys are conducted in the form of questionnaire designed by our own analyst team. Surveys plays an important role in primary research because surveys helps us to identify the key target audiences of the market. Additionally, surveys helps to identify the key target audience engaged with the market. Our survey team conducts the survey by targeting the key audience, thus gaining insights from them. Based on the perspectives of the customers, this information is utilized to formulate market strategies. Moreover, market surveys helps us to understand the current competitive situation of the industry. To be precise, our survey process typically involve with the 360 analysis of the market. This analytical process begins by identifying the prospective customers for a product or service related to the market/industry to obtain data on how a product/service could fit into customers’ lives.

Secondary Research: The secondary data sources includes information published by the on-profit organizations such as World bank, WHO, company fillings, investor presentations, annual reports, national government documents, statistical databases, blogs, articles, white papers and others. From the annual report, we analyse a company’s revenue to understand the key segment and market share of that organization in a particular region. We analyse the company websites and adopt the product mapping technique which is important for deriving the segment revenue. In the product mapping method, we select and categorize the products offered by the companies catering to domain specific market, deduce the product revenue for each of the companies so as to get overall estimation of the market size. We also source data and analyses trends based on information received from supply side and demand side intermediaries in the value chain. The supply side denotes the data gathered from supplier, distributor, wholesaler and the demand side illustrates the data gathered from the end customers for respective market domain.

The supply side for a domain specific market is analysed by:
The demand side for the market is estimated through:
In-house Library: Apart from these third-party sources, we have our in-house library of qualitative and quantitative information. Our in-house database includes market data for various industry and domains. These data are updated on regular basis as per the changing market scenario. Our library includes, historic databases, internal audit reports and archives.
Sometimes there are instances where there is no metadata or raw data available for any domain specific market. For those cases, we use our expertise to forecast and estimate the market size in order to generate comprehensive data sets. Our analyst team adopt a robust research technique in order to produce the estimates:
Data Synthesis: This stage involves the analysis & mapping of all the information obtained from the previous step. It also involves in scrutinizing the data for any discrepancy observed while data gathering related to the market. The data is collected with consideration to the heterogeneity of sources. Robust scientific techniques are in place for synthesizing disparate data sets and provide the essential contextual information that can orient market strategies. The Brainy Insights has extensive experience in data synthesis where the data passes through various stages:


Market Deduction & Formulation: The final stage comprises of assigning data points at appropriate market spaces so as to deduce feasible conclusions. Analyst perspective & subject matter expert based holistic form of market sizing coupled with industry analysis also plays a crucial role in this stage.
This stage involves in finalization of the market size and numbers that we have collected from data integration step. With data interpolation, it is made sure that there is no gap in the market data. Successful trend analysis is done by our analysts using extrapolation techniques, which provide the best possible forecasts for the market.
Data Validation & Market Feedback: Validation is the most important step in the process. Validation & re-validation via an intricately designed process helps us finalize data-points to be used for final calculations.

The Brainy Insights interacts with leading companies and experts of the concerned domain to develop the analyst team’s market understanding and expertise. It improves and substantiates every single data presented in the market reports. The data validation interview and discussion panels are typically composed of the most experienced industry members. The participants include, however, are not limited to:
Moreover, we always validate our data and findings through primary respondents from all the major regions we are working on.


Free Customization
Fortune 500 Clients
Free Yearly Update On Purchase Of Multi/Corporate License
Companies Served Till Date