- +1-315-215-1633
- sales@thebrainyinsights.com

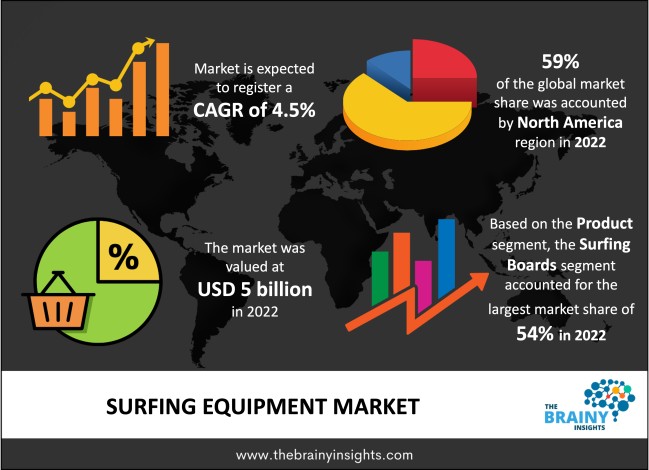
The global surfing equipment market was valued at USD 5 billion in 2022, growing at a CAGR of 4.5% from 2023 to 2032. The market is expected to reach USD 7.76 billion by 2032. Increasing recreational activity adoption due to several health benefits associated with surfing, increased international tourism, growing population, rapid product innovation, and increasing disposable income are a few of the critical surfing equipment market drivers and trends fuelling market growth. Surfing equipment is increasingly being used to help individuals manoeuvre their bodies against the moving wave stream. These advantages of surfing boards, surf gear, and other surfing accessories are growing global demand for surfing equipment.
Surfing is a dangerous water sport in which a person utilises a road to ride on an ocean wave. Surfers utilise surfing equipment to help them surf. Surfboards, fins, surfboard bags, wetsuits, and fins are examples of surfing equipment. Surfing is an exciting hobby that allows you to experience a rush, release stress, and enjoy your leisure time. They are played both recreationally and competitively. Surfing equipment is designed to help people move their bodies against a moving wave. Wood, polyester, fibreglass, and polystyrene are used to make surfboards. Surfing equipment is specifically developed to protect the body from cold water, rashes, and water currents. Surfing has various health benefits, including increasing metabolism, burning calories, strengthening the back, legs, and shoulder muscles, developing core strength, and improving cardiovascular fitness. The growing understanding of the health benefits of surfing has prompted more people to take up the activity. Surfing equipment is in high demand as the sport grows in popularity. Surfing equipment can be purchased through a variety of sources, including online portals, specialty stores, and supermarkets. They are frequently utilised in entertainment, recreational sports, and a variety of sporting competitions. In the United States, there are numerous prominent surfing tournaments and champions, including West Coast Surfing Champions, U.S Open Champions, and United States Surfing Champions. Many manufacturing companies create surfing equipment specifically for consumer demand. The booming tourism business and the increasing health advantages linked with surfing are driving the Global Surfing Equipment business forward. The growing surfing equipment market is boosting the number of tourists that participate in surfing sports along the coast. The booming tourism industry and rising disposable income are important drivers driving market expansion.
Get an overview of this study by requesting a free sample
In March 2023, Vans Surf announced the Surf VR3 Collection, claiming that it is aimed to combine the easy-going vibes of surfing with Vans' ongoing commitment to more sustainably-focused clothing and footwear.
In January 2023, NASCAR announced a clothing cooperation with action-sports company Hurley, selling men's and women's beach and surf wear.
In February 2022, Awake, a Swedish electric surfboard maker, revealed the latest iteration of their flagship model, the Rävik S 22. For greater torque and acceleration, the board included a 12-kW brushless motor and a redesigned impeller.
Rising Popularity of Surfing Growing consumer interest in surfing, as well as aggressive growth techniques employed by surf equipment manufacturers, are driving product demand. Leading manufacturers, like as Quicksilver, Channel Islands Surfboards, and Firewire Surfboards, place a premium on product innovation, which drives the industry's expansion. In July 2019, Billabong, an Australian company, announced the launch of Furnace Graphene, graphene-enhanced surfing apparel. This product's graphene-wrapped yarns are cleverly designed to trap and hold heat more effectively, delivering warmth to the wearer.
High Price- Speciality stores will pay a higher price for higher-quality goods, and they strive to differentiate themselves by presenting themselves as a family store that appeals to young teenagers and their parents. Premium products are preferred by consumers with a lot of discretionary cash; yet, product features, functionality, and comfortability are essential aspects that may stymie market expansion.
Marketing Programmes- Businesses are developing strategic marketing programmes in order to enhance their consumer base and sales. Partnerships with surfing clubs, professional surfers, and surfing superstars, for example, might assist businesses in gaining new customers. Furthermore, the exclusive online community serves as a centralised platform for surf industry enterprises. Famous companies such as Quiksilver/Roxy and Billabong represent niche retail outlets, which are gaining popularity.
The regions analyzed for the market include North America, Europe, South America, Asia Pacific, the Middle East, and Africa. North America emerged as the largest market for the global surfing equipment market, with a 59% market revenue share in 2022.
Surfing's growing appeal among adventure seekers in North America is driving product demand in the region. The surfing boards category represented a significant share of the North America regional market in 2020, and this trend is expected to continue over the forecast period. According to the Sports & Fitness Industry Association, there were 2.87 million surfers in the United States in August 2019. Because of its long beaches, the United States has the largest surfing market, making it a popular site for surfing and other water activities.
North America Region Surfing Equipment Market Share in 2022 - 59%
www.thebrainyinsights.com
Check the geographical analysis of this market by requesting a free sample
The product segment is divided into apparels & accessories and surfing boards. The surfing boards segment dominated the market, with a market share of around 54% in 2022. Sales of surfing boards will increase during the projected period due to increased surfing participation, growing surf tourism, and rising disposable income levels. In addition to surfboards and surfing attire, necessary surfing gear include fins, surf wax, leashes, surf earplugs, a surfboard bag, a surf poncho, boots, hoods, gloves, and surf watches.
The distribution channel segment is divided into offline and online. The online segment dominated the market, with a market share of around 60% in 2022. Due to technical developments and the rising importance given to online platforms for acquiring surfing equipment, particularly by users looking for prices.
| Attribute | Description |
|---|---|
| Market Size | Revenue (USD Billion) |
| Market size value in 2022 | USD 5 Billion |
| Market size value in 2032 | USD 7.76 Billion |
| CAGR (2023 to 2032) | 4.5% |
| Historical data | 2019-2021 |
| Base Year | 2022 |
| Forecast | 2023-2032 |
| Region | The regions analyzed for the market are Asia Pacific, Europe, South America, North America, and Middle East & Africa. Furthermore, the regions are further analyzed at the country level. |
| Segments | Product, Distribution Channel |
As per The Brainy Insights, the size of the surfing equipment market was valued at USD 5 billion in 2022 to USD 7.76 billion by 2032.
The global surfing equipment market is growing at a CAGR of 4.5% during the forecast period 2023-2032.
North America emerged as the largest surfing equipment market.
Key players in the surfing equipment market are Billabong, Quiksilver, Inc., JS Industries, Channel Islands Surfboards, Nike, Inc., Firewire Surfboards, LLC, Rusty Surfboards, Rip Curl. Ltd., Cannibal Surfboards, and O’Neill.
1. Introduction
1.1. Objectives of the Study
1.2. Market Definition
1.3. Research Scope
1.4. Currency
1.5. Key Target Audience
2. Research Methodology and Assumptions
3. Executive Summary
4. Premium Insights
4.1. Porter’s Five Forces Analysis
4.2. Value Chain Analysis
4.3. Top Investment Pockets
4.3.1. Market Attractiveness Analysis by Product
4.3.2. Market Attractiveness Analysis by Distribution Channel
4.3.3. Market Attractiveness Analysis by Region
4.4. Industry Trends
5. Market Dynamics
5.1. Market Evaluation
5.2. Drivers
5.2.1. Rising popularity of nicotine
5.3. Restraints
5.3.1. High price
5.4. Opportunities
5.4.1. Marketing programmes
5.5. Challenges
5.5.1. High cost
6. Global Surfing Equipment Market Analysis and Forecast, By Product
6.1. Segment Overview
6.2. Apparels & Accessories
6.3. Surfing Boards
7. Global Surfing Equipment Market Analysis and Forecast, By Distribution Channel
7.1. Segment Overview
7.2. Offline
7.3. Online
8. Global Surfing Equipment Market Analysis and Forecast, By Regional Analysis
8.1. Segment Overview
8.2. North America
8.2.1. U.S.
8.2.2. Canada
8.2.3. Mexico
8.3. Europe
8.3.1. Germany
8.3.2. France
8.3.3. U.K.
8.3.4. Italy
8.3.5. Spain
8.4. Asia-Pacific
8.4.1. Japan
8.4.2. China
8.4.3. India
8.5. South America
8.5.1. Brazil
8.6. Middle East and Africa
8.6.1. UAE
8.6.2. South Africa
9. Global Surfing Equipment Market-Competitive Landscape
9.1. Overview
9.2. Market Share of Key Players in Global Surfing Equipment Market
9.2.1. Global Company Market Share
9.2.2. North America Company Market Share
9.2.3. Europe Company Market Share
9.2.4. APAC Company Market Share
9.3. Competitive Situations and Trends
9.3.1. Product Launches and Developments
9.3.2. Partnerships, Collaborations, and Agreements
9.3.3. Mergers & Acquisitions
9.3.4. Expansions
10. Company Profiles
10.1. Billabong
10.1.1. Business Overview
10.1.2. Company Snapshot
10.1.3. Company Market Share Analysis
10.1.4. Company Product Portfolio
10.1.5. Recent Developments
10.1.6. SWOT Analysis
10.2. Quiksilver, Inc.
10.2.1. Business Overview
10.2.2. Company Snapshot
10.2.3. Company Market Share Analysis
10.2.4. Company Product Portfolio
10.2.5. Recent Developments
10.2.6. SWOT Analysis
10.3. JS Industries
10.3.1. Business Overview
10.3.2. Company Snapshot
10.3.3. Company Market Share Analysis
10.3.4. Company Product Portfolio
10.3.5. Recent Developments
10.3.6. SWOT Analysis
10.4. Channel Islands Surfboards
10.4.1. Business Overview
10.4.2. Company Snapshot
10.4.3. Company Market Share Analysis
10.4.4. Company Product Portfolio
10.4.5. Recent Developments
10.4.6. SWOT Analysis
10.5. Nike, Inc.
10.5.1. Business Overview
10.5.2. Company Snapshot
10.5.3. Company Market Share Analysis
10.5.4. Company Product Portfolio
10.5.5. Recent Developments
10.5.6. SWOT Analysis
10.6. Firewire Surfboards, LLC
10.6.1. Business Overview
10.6.2. Company Snapshot
10.6.3. Company Market Share Analysis
10.6.4. Company Product Portfolio
10.6.5. Recent Developments
10.6.6. SWOT Analysis
10.7. Rusty Surfboards
10.7.1. Business Overview
10.7.2. Company Snapshot
10.7.3. Company Market Share Analysis
10.7.4. Company Product Portfolio
10.7.5. Recent Developments
10.7.6. SWOT Analysis
10.8. Rip Curl. Ltd.
10.8.1. Business Overview
10.8.2. Company Snapshot
10.8.3. Company Market Share Analysis
10.8.4. Company Product Portfolio
10.8.5. Recent Developments
10.8.6. SWOT Analysis
10.9. Cannibal Surfboards
10.9.1. Business Overview
10.9.2. Company Snapshot
10.9.3. Company Market Share Analysis
10.9.4. Company Product Portfolio
10.9.5. Recent Developments
10.9.6. SWOT Analysis
10.10. O’Neill
10.10.1. Business Overview
10.10.2. Company Snapshot
10.10.3. Company Market Share Analysis
10.10.4. Company Product Portfolio
10.10.5. Recent Developments
10.10.6. SWOT Analysis
List of Table
1. Global Surfing Equipment Market, By Product, 2019-2032 (USD Billion)
2. Global Apparels & Accessories, Surfing Equipment Market, By Region, 2019-2032 (USD Billion)
3. Global Surfing Boards, Surfing Equipment Market, By Region, 2019-2032 (USD Billion)
4. Global Surfing Equipment Market, By Distribution Channel, 2019-2032 (USD Billion)
5. Global Offline, Surfing Equipment Market, By Region, 2019-2032 (USD Billion)
6. Global Online, Surfing Equipment Market, By Region, 2019-2032 (USD Billion)
7. North America Surfing Equipment Market, By Product, 2019-2032 (USD Billion)
8. North America Surfing Equipment Market, By Distribution Channel, 2019-2032 (USD Billion)
9. U.S. Surfing Equipment Market, By Product, 2019-2032 (USD Billion)
10. U.S. Surfing Equipment Market, By Distribution Channel, 2019-2032 (USD Billion)
11. Canada Surfing Equipment Market, By Product, 2019-2032 (USD Billion)
12. Canada Surfing Equipment Market, By Distribution Channel, 2019-2032 (USD Billion)
13. Mexico Surfing Equipment Market, By Product, 2019-2032 (USD Billion)
14. Mexico Surfing Equipment Market, By Distribution Channel, 2019-2032 (USD Billion)
15. Europe Surfing Equipment Market, By Product, 2019-2032 (USD Billion)
16. Europe Surfing Equipment Market, By Distribution Channel, 2019-2032 (USD Billion)
17. Germany Surfing Equipment Market, By Product, 2019-2032 (USD Billion)
18. Germany Surfing Equipment Market, By Distribution Channel, 2019-2032 (USD Billion)
19. France Surfing Equipment Market, By Product, 2019-2032 (USD Billion)
20. France Surfing Equipment Market, By Distribution Channel, 2019-2032 (USD Billion)
21. U.K. Surfing Equipment Market, By Product, 2019-2032 (USD Billion)
22. U.K. Surfing Equipment Market, By Distribution Channel, 2019-2032 (USD Billion)
23. Italy Surfing Equipment Market, By Product, 2019-2032 (USD Billion)
24. Italy Surfing Equipment Market, By Distribution Channel, 2019-2032 (USD Billion)
25. Spain Surfing Equipment Market, By Product, 2019-2032 (USD Billion)
26. Spain Surfing Equipment Market, By Distribution Channel, 2019-2032 (USD Billion)
27. Asia Pacific Surfing Equipment Market, By Product, 2019-2032 (USD Billion)
28. Asia Pacific Surfing Equipment Market, By Distribution Channel, 2019-2032 (USD Billion)
29. Japan Surfing Equipment Market, By Product, 2019-2032 (USD Billion)
30. Japan Surfing Equipment Market, By Distribution Channel, 2019-2032 (USD Billion)
31. China Surfing Equipment Market, By Product, 2019-2032 (USD Billion)
32. China Surfing Equipment Market, By Distribution Channel, 2019-2032 (USD Billion)
33. India Surfing Equipment Market, By Product, 2019-2032 (USD Billion)
34. India Surfing Equipment Market, By Distribution Channel, 2019-2032 (USD Billion)
35. South America Surfing Equipment Market, By Product, 2019-2032 (USD Billion)
36. South America Surfing Equipment Market, By Distribution Channel, 2019-2032 (USD Billion)
37. Brazil Surfing Equipment Market, By Product, 2019-2032 (USD Billion)
38. Brazil Surfing Equipment Market, By Distribution Channel, 2019-2032 (USD Billion)
39. Middle East and Africa Surfing Equipment Market, By Product, 2019-2032 (USD Billion)
40. Middle East and Africa Surfing Equipment Market, By Distribution Channel, 2019-2032 (USD Billion)
41. UAE Surfing Equipment Market, By Product, 2019-2032 (USD Billion)
42. UAE Surfing Equipment Market, By Distribution Channel, 2019-2032 (USD Billion)
43. South Africa Surfing Equipment Market, By Product, 2019-2032 (USD Billion)
44. South Africa Surfing Equipment Market, By Distribution Channel, 2019-2032 (USD Billion)
List of Figures
1. Global Surfing Equipment Market Segmentation
2. Global Surfing Equipment Market: Research Methodology
3. Market Size Estimation Methodology: Bottom-Up Approach
4. Market Size Estimation Methodology: Top-Down Approach
5. Data Triangulation
6. Porter’s Five Forces Analysis
7. Value Chain Analysis
8. Global Surfing Equipment Market Attractiveness Analysis by Product
9. Global Surfing Equipment Market Attractiveness Analysis by Distribution Channel
10. Global Surfing Equipment Market Attractiveness Analysis by Region
11. Global Surfing Equipment Market: Dynamics
12. Global Surfing Equipment Market Share by Product (2023 & 2032)
13. Global Surfing Equipment Market Share by Distribution Channel (2023 & 2032)
14. Global Surfing Equipment Market Share by Regions (2023 & 2032)
15. Global Surfing Equipment Market Share by Company (2022)
This study forecasts global, regional, and country revenue from 2019 to 2032. The Brainy Insights has segmented the global surfing equipment market based on the below-mentioned segments:
Global Surfing Equipment Market By Product:
Global Surfing Equipment Market By Distribution Channel:
Global Surfing Equipment Market By Region:
Research has its special purpose to undertake marketing efficiently. In this competitive scenario, businesses need information across all industry verticals; the information about customer wants, market demand, competition, industry trends, distribution channels etc. This information needs to be updated regularly because businesses operate in a dynamic environment. Our organization, The Brainy Insights incorporates scientific and systematic research procedures in order to get proper market insights and industry analysis for overall business success. The analysis consists of studying the market from a miniscule level wherein we implement statistical tools which helps us in examining the data with accuracy and precision.
Our research reports feature both; quantitative and qualitative aspects for any market. Qualitative information for any market research process are fundamental because they reveal the customer needs and wants, usage and consumption for any product/service related to a specific industry. This in turn aids the marketers/investors in knowing certain perceptions of the customers. Qualitative research can enlighten about the different product concepts and designs along with unique service offering that in turn, helps define marketing problems and generate opportunities. On the other hand, quantitative research engages with the data collection process through interviews, e-mail interactions, surveys and pilot studies. Quantitative aspects for the market research are useful to validate the hypotheses generated during qualitative research method, explore empirical patterns in the data with the help of statistical tools, and finally make the market estimations.
The Brainy Insights offers comprehensive research and analysis, based on a wide assortment of factual insights gained through interviews with CXOs and global experts and secondary data from reliable sources. Our analysts and industry specialist assume vital roles in building up statistical tools and analysis models, which are used to analyse the data and arrive at accurate insights with exceedingly informative research discoveries. The data provided by our organization have proven precious to a diverse range of companies, facilitating them to address issues such as determining which products/services are the most appealing, whether or not customers use the product in the manner anticipated, the purchasing intentions of the market and many others.
Our research methodology encompasses an idyllic combination of primary and secondary initiatives. Key phases involved in this process are listed below:

The phase involves the gathering and collecting of market data and its related information with the help of different sources & research procedures.

The data procurement stage involves in data gathering and collecting through various data sources.
This stage involves in extensive research. These data sources includes:
Purchased Database: Purchased databases play a crucial role in estimating the market sizes irrespective of the domain. Our purchased database includes:
Primary Research: The Brainy Insights interacts with leading companies and experts of the concerned domain to develop the analyst team’s market understanding and expertise. It improves and substantiates every single data presented in the market reports. Primary research mainly involves in telephonic interviews, E-mail interactions and face-to-face interviews with the raw material providers, manufacturers/producers, distributors, & independent consultants. The interviews that we conduct provides valuable data on market size and industry growth trends prevailing in the market. Our organization also conducts surveys with the various industry experts in order to gain overall insights of the industry/market. For instance, in healthcare industry we conduct surveys with the pharmacists, doctors, surgeons and nurses in order to gain insights and key information of a medical product/device/equipment which the customers are going to usage. Surveys are conducted in the form of questionnaire designed by our own analyst team. Surveys plays an important role in primary research because surveys helps us to identify the key target audiences of the market. Additionally, surveys helps to identify the key target audience engaged with the market. Our survey team conducts the survey by targeting the key audience, thus gaining insights from them. Based on the perspectives of the customers, this information is utilized to formulate market strategies. Moreover, market surveys helps us to understand the current competitive situation of the industry. To be precise, our survey process typically involve with the 360 analysis of the market. This analytical process begins by identifying the prospective customers for a product or service related to the market/industry to obtain data on how a product/service could fit into customers’ lives.

Secondary Research: The secondary data sources includes information published by the on-profit organizations such as World bank, WHO, company fillings, investor presentations, annual reports, national government documents, statistical databases, blogs, articles, white papers and others. From the annual report, we analyse a company’s revenue to understand the key segment and market share of that organization in a particular region. We analyse the company websites and adopt the product mapping technique which is important for deriving the segment revenue. In the product mapping method, we select and categorize the products offered by the companies catering to domain specific market, deduce the product revenue for each of the companies so as to get overall estimation of the market size. We also source data and analyses trends based on information received from supply side and demand side intermediaries in the value chain. The supply side denotes the data gathered from supplier, distributor, wholesaler and the demand side illustrates the data gathered from the end customers for respective market domain.

The supply side for a domain specific market is analysed by:
The demand side for the market is estimated through:
In-house Library: Apart from these third-party sources, we have our in-house library of qualitative and quantitative information. Our in-house database includes market data for various industry and domains. These data are updated on regular basis as per the changing market scenario. Our library includes, historic databases, internal audit reports and archives.
Sometimes there are instances where there is no metadata or raw data available for any domain specific market. For those cases, we use our expertise to forecast and estimate the market size in order to generate comprehensive data sets. Our analyst team adopt a robust research technique in order to produce the estimates:
Data Synthesis: This stage involves the analysis & mapping of all the information obtained from the previous step. It also involves in scrutinizing the data for any discrepancy observed while data gathering related to the market. The data is collected with consideration to the heterogeneity of sources. Robust scientific techniques are in place for synthesizing disparate data sets and provide the essential contextual information that can orient market strategies. The Brainy Insights has extensive experience in data synthesis where the data passes through various stages:


Market Deduction & Formulation: The final stage comprises of assigning data points at appropriate market spaces so as to deduce feasible conclusions. Analyst perspective & subject matter expert based holistic form of market sizing coupled with industry analysis also plays a crucial role in this stage.
This stage involves in finalization of the market size and numbers that we have collected from data integration step. With data interpolation, it is made sure that there is no gap in the market data. Successful trend analysis is done by our analysts using extrapolation techniques, which provide the best possible forecasts for the market.
Data Validation & Market Feedback: Validation is the most important step in the process. Validation & re-validation via an intricately designed process helps us finalize data-points to be used for final calculations.

The Brainy Insights interacts with leading companies and experts of the concerned domain to develop the analyst team’s market understanding and expertise. It improves and substantiates every single data presented in the market reports. The data validation interview and discussion panels are typically composed of the most experienced industry members. The participants include, however, are not limited to:
Moreover, we always validate our data and findings through primary respondents from all the major regions we are working on.


Free Customization
Fortune 500 Clients
Free Yearly Update On Purchase Of Multi/Corporate License
Companies Served Till Date