- +1-315-215-1633
- sales@thebrainyinsights.com

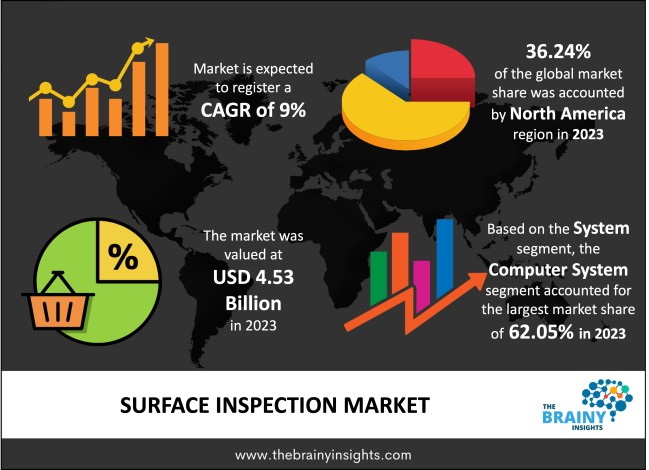
Global surface inspection market is projected to reach USD 10.7 billion by 2033, at a CAGR of 9% from 2024 to 2033. Major factors driving the growth of the surface inspection market include growing demand for premium goods, growth in the manufacturing industries and the automation needs in the industrial sectors. Industries now focus on safety; for this, every industry has certain regulations and quality standards to prevent accidents. At the same time, the demand for the surface inspection market is increasing due to the increasing automation.
Surface inspection helps in the precise, real-time identification of surface defects or features in an item. It is achieved using an angled illumination or smart device, while the items are being created. Surface inspection inspects the existence or lack of features needed in the final product. There are some aspects which are checked using the surface inspection method such as whether the component configuration is right or not, identifying the flaws and deficiencies on the surface of the various sections of the machines or boards. The flaws can be of the sort including cracks, scabs, burnt steel, loops, and guide marks and twist. Most surface inspection systems are for replacing human inspections. That is, the welded imperfections that can be recognized by human eyes have the ability to be examined by a vision system.
Advances in computer science, data analysis, and detection technologies have contributed in many advanced methods for surface inspection. With such developments, the surface inspection systems are able to tackle applications in diverse sectors such as semiconductor, electrical, glass & metal, food, medical and plastics. Using a camera to examine the surface and specifications of objects in many industries is becoming a common practice, particularly for those who employ a high degree of process automation. This system also enables the detection of substrate surface defects such as corrosion or inappropriate coating. Few developers use machine vision cameras to detect surface imperfections such as craters or roughness that are usually difficult for vision instruments. Machine vision has become a common alternative for product or process validation due to the cost reduction in computers and cameras. Most vision systems consist of cameras and a computer running software to obtain and interpret photos from the object of interest. Two of the reasons that drive manufacturers to implement surface inspection procedures are the rising quality concerns and the increasing labour costs. Technological advancements can make surface inspection even more accurate. The integration of artificial intelligence and machine learning can increase the accuracy of surface inspection and improve decision-making ability.
Get an overview of this study by requesting a free sample
This is because labour prices are rising, and by automation companies are lowering costs. Often, automation reduces human error and increases speed. Thus, the increasing demand for automation and quality is anticipated to drive the surface inspection market.
The laws and regulations have been strict, so quality assurance has become a very critical thing for any manufacturer. Therefore to avoid mistakes and do correct identification of faults coupled with tolerance testing, surface vision & inspection systems are used.
Most significant limitation for the surface inspection industry is the shortage of technically qualified people, which poses the question of proper integration of such systems in various industries.
The demand for surface inspection is expected to expand in the coming years due to the rapid technological developments made in this area. The consumers are now seeking premium goods, and so the suppliers are required to use the surface testing techniques in specific applications. The advanced technology such as machine vision (MV) allows to analyze the product automatically and in effect improves the productivity of the manufacturing cycle. The manufacturers prefer MV for visual inspections which involve measurement repeatability, high magnification, and high speed.
The global surface inspection market has been segmented based on component, surface type, system, vertical and regions.
The regions evaluated for the global surface inspection market include North America, Europe, South America, Asia Pacific, and the Middle East and Africa. The North America region emerged as the largest market for the surface inspection with a 36.24% share of market revenue in 2023.
North America Surface Inspection Market Share in 2023 - 36.24%
www.thebrainyinsights.com
Check the geographical analysis of this market by requesting a free sample
The key players are now concentrating on implementing strategies such as adopting new technology, product innovations, mergers & acquisitions, joint venture, alliances and partnerships to improve their market position in the global surface inspection industry.
For example, in 2019, Allied Vision, unveiled the new Alvium Camera at VISION CHINA SHANGHAI 2019. The Allied Vision Alvium Camera Series is a revolutionary camera platform that fixes the shortcomings of existing camera and sensor modules for embedded applications, and provides a level of freedom, previously unknown for device designers.
As per The Brainy Insights, the size of the surface inspection market was valued at USD 4.53 billion in 2023 and is anticipated to reach USD 10.7 billion by 2033.
Global surface inspection market is growing at a CAGR of 9% during the forecast period 2024-2033.
The North America region emerged as the largest market for the surface inspection.
Increasing demand for automation and quality control is the key driving factor for the surface inspection market.
Lack of skilled individuals could hamper the market growth.
Technological advancements will provide huge opportunities to the market.
Key players are Allied Vision Technologies, Ametek, Basler, Baumer, Dark Field Technologies, DatalogicSpA, FLIR Systems, IMS Messsysteme.
1. Introduction
1.1. Objectives of the Study
1.2. Market Definition
1.3. Research Scope
1.4. Currency
1.5. Key Target Audience
2. Research Methodology and Assumptions
3. Executive Summary
4. Premium Insights
4.1. Porter’s Five Forces Analysis
4.2. Value Chain Analysis
4.3. Top Investment Pockets
4.3.1. Market Attractiveness Analysis By Component
4.3.2. Market Attractiveness Analysis By System
4.3.3. Market Attractiveness Analysis By Surface Type
4.3.4. Market Attractiveness Analysis By Vertical
4.3.5. Market Attractiveness Analysis By Region
4.4. Industry Trends
5. Market Dynamics
5.1. Market Evaluation
5.2. Drivers
5.2.1. Increasing Demand for Automation and Quality Control
5.2.2. Stringent Rules and Regulations
5.3. Restrains
5.3.1. Lack of Skilled Individuals
5.4. Opportunities
5.4.1. Technological Advancements
6. Global Surface Inspection Market Analysis and Forecast, By Component
6.1. Segment Overview
6.2. Software
6.3. Frame Grabber
6.4. Camera
6.5. Processor
6.6. Lighting Equipment
7. Global Surface Inspection Market Analysis and Forecast, By System
7.1. Segment Overview
7.2. Computer System
7.3. Camera System
8. Global Surface Inspection Market Analysis and Forecast, By Surface Type
8.1. Segment Overview
8.2. 2D
8.3. 3D
9. Global Surface Inspection Market Analysis and Forecast, By Vertical
9.1. Segment Overview
9.2. Semiconductor
9.3. Automotive
9.4. Paper & Wood
9.5. Electrical & Electronics
9.6. Glass & Metal
9.7. Plastic & Rubber
9.8. Food & Packaging
9.9. Medical & Pharmaceuticals
9.10. Printing
9.11. Non-Woven
9.12. Postal & Logistics
10. Global Surface Inspection Market Analysis and Forecast, By Regional Analysis
10.1. Segment Overview
10.2. North America
10.2.1. U.S.
10.2.2. Canada
10.2.3. Mexico
10.3. Europe
10.3.1. Germany
10.3.2. France
10.3.3. U.K.
10.3.4. Italy
10.3.5. Spain
10.4. Asia-Pacific
10.4.1. Japan
10.4.2. China
10.4.3. India
10.5. South America
10.5.1. Brazil
10.6. Middle East and Africa
10.6.1. UAE
10.6.2. South Africa
11. Global Surface Inspection Market-Competitive Landscape
11.1. Overview
11.2. Market Share of Key Players in Global Surface Inspection Market
11.2.1. Global Company Market Share
11.2.2. North America Company Market Share
11.2.3. Europe Company Market Share
11.2.4. APAC Company Market Share
11.3. Competitive Situations and Trends
11.3.1. Product Launches and Developments
11.3.2. Partnerships, Collaborations, and Agreements
11.3.3. Mergers & Acquisitions
11.3.4. Expansions
12. Company Profiles
12.1. Allied Vision Technologies
12.1.1. Business Overview
12.1.2. Company Snapshot
12.1.3. Company Market Share Analysis
12.1.4. Company Product Portfolio
12.1.5. Recent Developments
12.1.6. SWOT Analysis
12.2. Ametek
12.2.1. Business Overview
12.2.2. Company Snapshot
12.2.3. Company Market Share Analysis
12.2.4. Company Product Portfolio
12.2.5. Recent Developments
12.2.6. SWOT Analysis
12.3. Basler
12.3.1. Business Overview
12.3.2. Company Snapshot
12.3.3. Company Market Share Analysis
12.3.4. Company Product Portfolio
12.3.5. Recent Developments
12.3.6. SWOT Analysis
12.4. Baumer
12.4.1. Business Overview
12.4.2. Company Snapshot
12.4.3. Company Market Share Analysis
12.4.4. Company Product Portfolio
12.4.5. Recent Developments
12.4.6. SWOT Analysis
12.5. Dark Field Technologies
12.5.1. Business Overview
12.5.2. Company Snapshot
12.5.3. Company Market Share Analysis
12.5.4. Company Product Portfolio
12.5.5. Recent Developments
12.5.6. SWOT Analysis
12.6. DatalogicSpA
12.6.1. Business Overview
12.6.2. Company Snapshot
12.6.3. Company Market Share Analysis
12.6.4. Company Product Portfolio
12.6.5. Recent Developments
12.6.6. SWOT Analysis
12.7. FLIR Systems
12.7.1. Business Overview
12.7.2. Company Snapshot
12.7.3. Company Market Share Analysis
12.7.4. Company Product Portfolio
12.7.5. Recent Developments
12.7.6. SWOT Analysis
12.8. IMS Messsysteme
12.8.1. Business Overview
12.8.2. Company Snapshot
12.8.3. Company Market Share Analysis
12.8.4. Company Product Portfolio
12.8.5. Recent Developments
12.8.6. SWOT Analysis
12.9. In-core Systemes
12.9.1. Business Overview
12.9.2. Company Snapshot
12.9.3. Company Market Share Analysis
12.9.4. Company Product Portfolio
12.9.5. Recent Developments
12.9.6. SWOT Analysis
12.10. Industrial Vision System
12.10.1. Business Overview
12.10.2. Company Snapshot
12.10.3. Company Market Share Analysis
12.10.4. Company Product Portfolio
12.10.5. Recent Developments
12.10.6. SWOT Analysis
12.11. ISRA Vision
12.11.1. Business Overview
12.11.2. Company Snapshot
12.11.3. Company Market Share Analysis
12.11.4. Company Product Portfolio
12.11.5. Recent Developments
12.11.6. SWOT Analysis
12.12. Keyence
12.12.1. Business Overview
12.12.2. Company Snapshot
12.12.3. Company Market Share Analysis
12.12.4. Company Product Portfolio
12.12.5. Recent Developments
12.12.6. SWOT Analysis
12.13. Matrox Electronic System
12.13.1. Business Overview
12.13.2. Company Snapshot
12.13.3. Company Market Share Analysis
12.13.4. Company Product Portfolio
12.13.5. Recent Developments
12.13.6. SWOT Analysis
12.14. National Instruments
12.14.1. Business Overview
12.14.2. Company Snapshot
12.14.3. Company Market Share Analysis
12.14.4. Company Product Portfolio
12.14.5. Recent Developments
12.14.6. SWOT Analysis
12.15. Omron
12.15.1. Business Overview
12.15.2. Company Snapshot
12.15.3. Company Market Share Analysis
12.15.4. Company Product Portfolio
12.15.5. Recent Developments
12.15.6. SWOT Analysis
12.16. Sick
12.16.1. Business Overview
12.16.2. Company Snapshot
12.16.3. Company Market Share Analysis
12.16.4. Company Product Portfolio
12.16.5. Recent Developments
12.16.6. SWOT Analysis
12.17. Sony Corporation
12.17.1. Business Overview
12.17.2. Company Snapshot
12.17.3. Company Market Share Analysis
12.17.4. Company Product Portfolio
12.17.5. Recent Developments
12.17.6. SWOT Analysis
12.18. Teledyne Technologies
12.18.1. Business Overview
12.18.2. Company Snapshot
12.18.3. Company Market Share Analysis
12.18.4. Company Product Portfolio
12.18.5. Recent Developments
12.18.6. SWOT Analysis
12.19. Vitronic
12.19.1. Business Overview
12.19.2. Company Snapshot
12.19.3. Company Market Share Analysis
12.19.4. Company Product Portfolio
12.19.5. Recent Developments
12.19.6. SWOT Analysis
12.20. Panasonic
12.20.1. Business Overview
12.20.2. Company Snapshot
12.20.3. Company Market Share Analysis
12.20.4. Company Product Portfolio
12.20.5. Recent Developments
12.20.6. SWOT Analysis
List of Table
1. Global Surface Inspection Market, By Component, 2020–2033(USD Billion)
2. Global Software, Surface Inspection Market, By Region, 2020–2033(USD Billion)
3. Global Frame Grabber, Surface Inspection Market, By Region, 2020–2033(USD Billion)
4. Global Camera, Surface Inspection Market, By Region, 2020–2033(USD Billion)
5. Global Processor, Surface Inspection Market, By Region, 2020–2033(USD Billion)
6. Global Lighting Equipment, Surface Inspection Market, By Region, 2020–2033(USD Billion)
7. Global Surface Inspection Market, By System, 2020–2033(USD Billion)
8. Global Computer System Surface Inspection Market, By Region, 2020–2033(USD Billion)
9. Global Camera System Surface Inspection Market, By Region, 2020–2033(USD Billion)
10. Global Surface Inspection Market, By Surface Type, 2020–2033(USD Billion)
11. Global 2D Surface Inspection Market, By Region, 2020–2033(USD Billion)
12. Global 3D Surface Inspection Market, By Region, 2020–2033(USD Billion)
13. Global Surface Inspection Market, By Vertical, 2020–2033(USD Billion)
14. Global Semiconductor Surface Inspection Market, By Region, 2020–2033(USD Billion)
15. Global Automotive Surface Inspection Market, By Region, 2020–2033(USD Billion)
16. Global Paper & Wood Surface Inspection Market, By Region, 2020–2033(USD Billion)
17. Global Electrical & Electronics Surface Inspection Market, By Region, 2020–2033(USD Billion)
18. Global Glass & Metal Surface Inspection Market, By Region, 2020–2033(USD Billion)
19. Global Plastic & Rubber Surface Inspection Market, By Region, 2020–2033(USD Billion)
20. Global Food & Packaging Surface Inspection Market, By Region, 2020–2033(USD Billion)
21. Global Medical & Pharmaceuticals Surface Inspection Market, By Region, 2020–2033(USD Billion)
22. Global Printing Surface Inspection Market, By Region, 2020–2033(USD Billion)
23. Global Non-Woven Surface Inspection Market, By Region, 2020–2033(USD Billion)
24. Global Postal & Logistics Surface Inspection Market, By Region, 2020–2033(USD Billion)
25. Global Surface Inspection Market, By Region, 2020–2033(USD Billion)
26. Global Surface Inspection Market, By North America, 2020–2033(USD Billion)
27. North America Surface Inspection Market, By Component, 2020–2033(USD Billion)
28. North America Surface Inspection Market, By System, 2020–2033(USD Billion)
29. North America Surface Inspection Market, By Surface Type, 2020–2033(USD Billion)
30. North America Surface Inspection Market, By Vertical, 2020–2033(USD Billion)
31. U.S. Surface Inspection Market, By Component, 2020–2033(USD Billion)
32. U.S. Surface Inspection Market, By System, 2020–2033(USD Billion)
33. U.S. Surface Inspection Market, By Surface Type, 2020–2033(USD Billion)
34. U.S. Surface Inspection Market, By Vertical, 2020–2033(USD Billion)
35. Canada Surface Inspection Market, By Component, 2020–2033(USD Billion)
36. Canada Surface Inspection Market, By System, 2020–2033(USD Billion)
37. Canada Surface Inspection Market, By Surface Type, 2020–2033(USD Billion)
38. Canada Surface Inspection Market, By Vertical, 2020–2033(USD Billion)
39. Mexico Surface Inspection Market, By Component, 2020–2033(USD Billion)
40. Mexico Surface Inspection Market, By System, 2020–2033(USD Billion)
41. Mexico Surface Inspection Market, By Surface Type, 2020–2033(USD Billion)
42. Mexico Surface Inspection Market, By Vertical, 2020–2033(USD Billion)
43. Europe Surface Inspection Market, By Component, 2020–2033(USD Billion)
44. Europe Surface Inspection Market, By System, 2020–2033(USD Billion)
45. Europe Surface Inspection Market, By Surface Type, 2020–2033(USD Billion)
46. Europe Surface Inspection Market, By Vertical, 2020–2033(USD Billion)
47. Germany Surface Inspection Market, By Component, 2020–2033(USD Billion)
48. Germany Surface Inspection Market, By System, 2020–2033(USD Billion)
49. Germany Surface Inspection Market, By Surface Type, 2020–2033(USD Billion)
50. Germany Surface Inspection Market, By Vertical, 2020–2033(USD Billion)
51. France Surface Inspection Market, By Component, 2020–2033(USD Billion)
52. France Surface Inspection Market, By System, 2020–2033(USD Billion)
53. France Surface Inspection Market, By Surface Type, 2020–2033(USD Billion)
54. France Surface Inspection Market, By Vertical, 2020–2033(USD Billion)
55. U.K. Surface Inspection Market, By Component, 2020–2033(USD Billion)
56. U.K. Surface Inspection Market, By System, 2020–2033(USD Billion)
57. U.K. Surface Inspection Market, By Surface Type, 2020–2033(USD Billion)
58. U.K. Surface Inspection Market, By Vertical, 2020–2033(USD Billion)
59. Italy Surface Inspection Market, By Component, 2020–2033(USD Billion)
60. Italy Surface Inspection Market, By System, 2020–2033(USD Billion)
61. Italy Surface Inspection Market, By Surface Type, 2020–2033(USD Billion)
62. Italy Surface Inspection Market, By Vertical, 2020–2033(USD Billion)
63. Spain Surface Inspection Market, By Component, 2020–2033(USD Billion)
64. Spain Surface Inspection Market, By System, 2020–2033(USD Billion)
65. Spain Surface Inspection Market, By Surface Type, 2020–2033(USD Billion)
66. Spain Surface Inspection Market, By Vertical, 2020–2033(USD Billion)
67. Asia Pacific Surface Inspection Market, By Component, 2020–2033(USD Billion)
68. Asia Pacific Surface Inspection Market, By System, 2020–2033(USD Billion)
69. Asia Pacific Surface Inspection Market, By Surface Type, 2020–2033(USD Billion)
70. Asia Pacific Surface Inspection Market, By Vertical, 2020–2033(USD Billion)
71. Japan Surface Inspection Market, By Component, 2020–2033(USD Billion)
72. Japan Surface Inspection Market, By System, 2020–2033(USD Billion)
73. Japan Surface Inspection Market, By Surface Type, 2020–2033(USD Billion)
74. Japan Surface Inspection Market, By Vertical, 2020–2033(USD Billion)
75. China Surface Inspection Market, By Component, 2020–2033(USD Billion)
76. China Surface Inspection Market, By System, 2020–2033(USD Billion)
77. China Surface Inspection Market, By Surface Type, 2020–2033(USD Billion)
78. China Surface Inspection Market, By Vertical, 2020–2033(USD Billion)
79. India Surface Inspection Market, By Component, 2020–2033(USD Billion)
80. India Surface Inspection Market, By System, 2020–2033(USD Billion)
81. India Surface Inspection Market, By Surface Type, 2020–2033(USD Billion)
82. India Surface Inspection Market, By Vertical, 2020–2033(USD Billion)
83. South America Surface Inspection Market, By Component, 2020–2033(USD Billion)
84. South America Surface Inspection Market, By System, 2020–2033(USD Billion)
85. South America Surface Inspection Market, By Surface Type, 2020–2033(USD Billion)
86. South America Surface Inspection Market, By Vertical, 2020–2033(USD Billion)
87. Brazil Surface Inspection Market, By Component, 2020–2033(USD Billion)
88. Brazil Surface Inspection Market, By System, 2020–2033(USD Billion)
89. Brazil Surface Inspection Market, By Surface Type, 2020–2033(USD Billion)
90. Brazil Surface Inspection Market, By Vertical, 2020–2033(USD Billion)
91. Middle East and Africa Surface Inspection Market, By Component, 2020–2033(USD Billion)
92. Middle East and Africa Surface Inspection Market, By System, 2020–2033(USD Billion)
93. Middle East and Africa Surface Inspection Market, By Surface Type, 2020–2033(USD Billion)
94. Middle East and Africa Surface Inspection Market, By Vertical, 2020–2033(USD Billion)
95. UAE Surface Inspection Market, By Component, 2020–2033(USD Billion)
96. UAE Surface Inspection Market, By System, 2020–2033(USD Billion)
97. UAE Surface Inspection Market, By Surface Type, 2020–2033(USD Billion)
98. UAE Surface Inspection Market, By Vertical, 2020–2033(USD Billion)
99. South Africa Surface Inspection Market, By Component, 2020–2033(USD Billion)
100. South Africa Surface Inspection Market, By System, 2020–2033(USD Billion)
101. South Africa Surface Inspection Market, By Surface Type, 2020–2033(USD Billion)
102. South Africa Surface Inspection Market, By Vertical, 2020–2033(USD Billion)
List of Figures
1. Global Surface Inspection Market Segmentation
2. Surface Inspection Market: Research Methodology
3. Market Size Estimation Methodology: Bottom-Up Approach
4. Market Size Estimation Methodology: Top-Down Approach
5. Data Triangulation
6. Porter’s Five Forces Analysis
7. Value Chain Analysis
8. Global Surface Inspection Market Attractiveness Analysis By Component
9. Global Surface Inspection Market Attractiveness Analysis By System
10. Global Surface Inspection Market Attractiveness Analysis By Surface Type
11. Global Surface Inspection Market Attractiveness Analysis By Vertical
12. Global Surface Inspection Market Attractiveness Analysis By Region
13. Global Surface Inspection Market: Dynamics
14. Global Surface Inspection Market Share By Component (2023 & 2033)
15. Global Surface Inspection Market Share By System (2023 & 2033)
16. Global Surface Inspection Market Share By Surface Type (2023 & 2033)
17. Global Surface Inspection Market Share By Vertical (2023 & 2033)
18. Global Surface Inspection Market Share by Regions (2023 & 2033)
19. Global Surface Inspection Market Share by Company (2023)
This study forecasts revenue growth at global, regional, and country levels from 2020 to 2033. The Brainy Insights has segmented the global surface inspection market on the basis of below mentioned segments:
Global Surface Inspection Market by Component:
Global Surface Inspection Market by System:
Global Surface Inspection Market by Type:
Global Surface Inspection Market by Vertical:
Global Surface Inspection Market by Region:
Research has its special purpose to undertake marketing efficiently. In this competitive scenario, businesses need information across all industry verticals; the information about customer wants, market demand, competition, industry trends, distribution channels etc. This information needs to be updated regularly because businesses operate in a dynamic environment. Our organization, The Brainy Insights incorporates scientific and systematic research procedures in order to get proper market insights and industry analysis for overall business success. The analysis consists of studying the market from a miniscule level wherein we implement statistical tools which helps us in examining the data with accuracy and precision.
Our research reports feature both; quantitative and qualitative aspects for any market. Qualitative information for any market research process are fundamental because they reveal the customer needs and wants, usage and consumption for any product/service related to a specific industry. This in turn aids the marketers/investors in knowing certain perceptions of the customers. Qualitative research can enlighten about the different product concepts and designs along with unique service offering that in turn, helps define marketing problems and generate opportunities. On the other hand, quantitative research engages with the data collection process through interviews, e-mail interactions, surveys and pilot studies. Quantitative aspects for the market research are useful to validate the hypotheses generated during qualitative research method, explore empirical patterns in the data with the help of statistical tools, and finally make the market estimations.
The Brainy Insights offers comprehensive research and analysis, based on a wide assortment of factual insights gained through interviews with CXOs and global experts and secondary data from reliable sources. Our analysts and industry specialist assume vital roles in building up statistical tools and analysis models, which are used to analyse the data and arrive at accurate insights with exceedingly informative research discoveries. The data provided by our organization have proven precious to a diverse range of companies, facilitating them to address issues such as determining which products/services are the most appealing, whether or not customers use the product in the manner anticipated, the purchasing intentions of the market and many others.
Our research methodology encompasses an idyllic combination of primary and secondary initiatives. Key phases involved in this process are listed below:

The phase involves the gathering and collecting of market data and its related information with the help of different sources & research procedures.

The data procurement stage involves in data gathering and collecting through various data sources.
This stage involves in extensive research. These data sources includes:
Purchased Database: Purchased databases play a crucial role in estimating the market sizes irrespective of the domain. Our purchased database includes:
Primary Research: The Brainy Insights interacts with leading companies and experts of the concerned domain to develop the analyst team’s market understanding and expertise. It improves and substantiates every single data presented in the market reports. Primary research mainly involves in telephonic interviews, E-mail interactions and face-to-face interviews with the raw material providers, manufacturers/producers, distributors, & independent consultants. The interviews that we conduct provides valuable data on market size and industry growth trends prevailing in the market. Our organization also conducts surveys with the various industry experts in order to gain overall insights of the industry/market. For instance, in healthcare industry we conduct surveys with the pharmacists, doctors, surgeons and nurses in order to gain insights and key information of a medical product/device/equipment which the customers are going to usage. Surveys are conducted in the form of questionnaire designed by our own analyst team. Surveys plays an important role in primary research because surveys helps us to identify the key target audiences of the market. Additionally, surveys helps to identify the key target audience engaged with the market. Our survey team conducts the survey by targeting the key audience, thus gaining insights from them. Based on the perspectives of the customers, this information is utilized to formulate market strategies. Moreover, market surveys helps us to understand the current competitive situation of the industry. To be precise, our survey process typically involve with the 360 analysis of the market. This analytical process begins by identifying the prospective customers for a product or service related to the market/industry to obtain data on how a product/service could fit into customers’ lives.

Secondary Research: The secondary data sources includes information published by the on-profit organizations such as World bank, WHO, company fillings, investor presentations, annual reports, national government documents, statistical databases, blogs, articles, white papers and others. From the annual report, we analyse a company’s revenue to understand the key segment and market share of that organization in a particular region. We analyse the company websites and adopt the product mapping technique which is important for deriving the segment revenue. In the product mapping method, we select and categorize the products offered by the companies catering to domain specific market, deduce the product revenue for each of the companies so as to get overall estimation of the market size. We also source data and analyses trends based on information received from supply side and demand side intermediaries in the value chain. The supply side denotes the data gathered from supplier, distributor, wholesaler and the demand side illustrates the data gathered from the end customers for respective market domain.

The supply side for a domain specific market is analysed by:
The demand side for the market is estimated through:
In-house Library: Apart from these third-party sources, we have our in-house library of qualitative and quantitative information. Our in-house database includes market data for various industry and domains. These data are updated on regular basis as per the changing market scenario. Our library includes, historic databases, internal audit reports and archives.
Sometimes there are instances where there is no metadata or raw data available for any domain specific market. For those cases, we use our expertise to forecast and estimate the market size in order to generate comprehensive data sets. Our analyst team adopt a robust research technique in order to produce the estimates:
Data Synthesis: This stage involves the analysis & mapping of all the information obtained from the previous step. It also involves in scrutinizing the data for any discrepancy observed while data gathering related to the market. The data is collected with consideration to the heterogeneity of sources. Robust scientific techniques are in place for synthesizing disparate data sets and provide the essential contextual information that can orient market strategies. The Brainy Insights has extensive experience in data synthesis where the data passes through various stages:


Market Deduction & Formulation: The final stage comprises of assigning data points at appropriate market spaces so as to deduce feasible conclusions. Analyst perspective & subject matter expert based holistic form of market sizing coupled with industry analysis also plays a crucial role in this stage.
This stage involves in finalization of the market size and numbers that we have collected from data integration step. With data interpolation, it is made sure that there is no gap in the market data. Successful trend analysis is done by our analysts using extrapolation techniques, which provide the best possible forecasts for the market.
Data Validation & Market Feedback: Validation is the most important step in the process. Validation & re-validation via an intricately designed process helps us finalize data-points to be used for final calculations.

The Brainy Insights interacts with leading companies and experts of the concerned domain to develop the analyst team’s market understanding and expertise. It improves and substantiates every single data presented in the market reports. The data validation interview and discussion panels are typically composed of the most experienced industry members. The participants include, however, are not limited to:
Moreover, we always validate our data and findings through primary respondents from all the major regions we are working on.


Free Customization
Fortune 500 Clients
Free Yearly Update On Purchase Of Multi/Corporate License
Companies Served Till Date