- +1-315-215-1633
- sales@thebrainyinsights.com

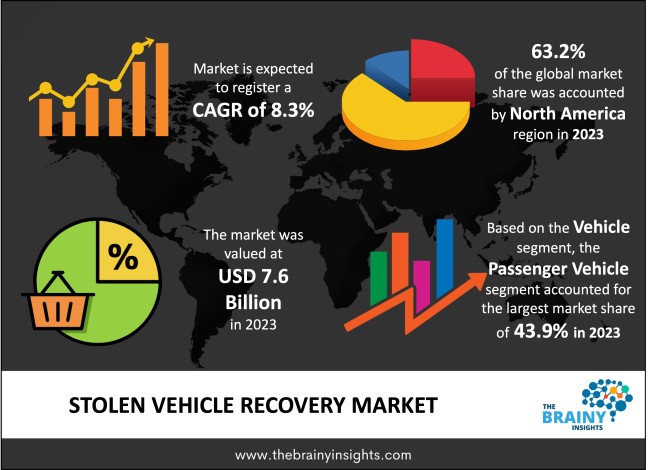
The Stolen Vehicle Recovery Market was valued at USD 7.6 billion in 2023 and grew at a CAGR of 8.3% from 2024 to 2033. The increasing number of IoT devices and connected auto technology is revolutionizing the stolen vehicle recovery sector. These innovations enable real-time communication between cars and monitoring systems, resulting in faster theft detection and reaction. Connected automobiles can immediately notify owners and authorities of illicit movement, whereas IoT sensors detect tampering efforts and send preemptive alerts. This proactive approach to vehicle security and recovery is fueling market expansion and innovation. As more automobiles become "smart" and interconnected, the stolen vehicle recovery infrastructure strengthens and integrates into the larger automotive ecosystem.
The Stolen Vehicle Recovery (SVR) market uses technology such as GPS monitoring, telematics, and RFID to locate and recover stolen automobiles. It serves automakers, insurance, law enforcement, and fleet operators. Rising car theft rates, combined with advances in IoT and connectivity, are driving market expansion. Emerging themes include AI-powered analytics, predictive theft prevention, and connection with connected auto ecosystems. Smart city efforts and legal obligations for car security accelerate uptake. Consumer desire for improved car safety features continues to shape the market, with real-time tracking and recovery solutions positioned as critical components of current automotive security systems.
Get an overview of this study by requesting a free sample
The Stolen Vehicle Recovery (SVR) industry is being driven by rising global vehicle theft rates, creating a demand for effective recovery solutions. Advances in IoT, GPS, and telematics provide real-time car tracking, which improves recovery success. Many nations have regulatory obligations for automobile security systems, which helps to drive adoption. Integration with connected auto ecosystems and smart city projects helps to expand the industry, while growing insurance rates push fleet operators and individuals to embrace. Consumer demand for increased safety features and technical advances, such as AI-powered predictive analytics and theft prevention systems, is also driving growth. Growing awareness of vehicle security drives global market demand.
The Stolen Vehicle Recovery (SVR) market is constrained by expensive installation and subscription costs, which limit acceptance among price-sensitive customers. Some consumers are hesitant to employ tracking systems due to privacy concerns, while reliance on stable internet in remote places presents issues. Limited infrastructure in poor countries, along with the potential of system hacking, further limit expansion. Furthermore, a lack of uniformity in recovery technology and disparate legal frameworks across regions hamper market expansion attempts.
The SVR market is highly promising, considering the IoT, AI, and machine learning developments related to predictive theft prevention. Smart city projects and car-related ecosystems where the technology will be connected extend the applications of SVR technology. The growth will be based on emerging markets, especially when vehicle ownership increases and security systems gain more recognition. Innovation will be driven by partnerships among auto companies, insurance, and technology firms. Customizable recovery solutions tailored for fleet operators and high-value vehicle owners expand market opportunities. Moreover, the regulatory actions that boost the car security systems and increase demand for subscription-based services open opportunities for long-term market growth.
North America led the market in 2023 with the largest market share of 63.2%. High rates of car theft, strong automotive infrastructure, and massive adoption of connected vehicle technology drive the North American stolen vehicle recovery (SVR) market. The largest markets are the United States and Canada, mainly because of the widespread adoption of telematics systems and stringent requirements for car security. The positive synergy between automakers, insurance, and technology companies also accelerates market growth. Increased consumer awareness toward high-end safety features like real-time tracking and predictive analytics, among others; and Smart city initiatives and rising IoT investment create regional development, with additional interest in fleet management and high-end vehicle security systems.
North America Region Stolen Vehicle Recovery Market Share in 2023 - 63.2%
www.thebrainyinsights.com
Check the geographical analysis of this market by requesting a free sample
The Passenger vehicle segment dominated the global market in 2023 with a market share of 43.9%. Passenger cars have the majority share in the SVR market due to a higher passenger theft rate and more demanding customers' need for a better security system. Recovery has been growing for manufacturers. Therefore, manufacturers are focusing on adding such advanced tracking technologies of GPS, telematics, and IoT into their passenger cars. Mid-range and luxury segment has dominated this segment for holding higher risks of the risk of theft, also where the government requires more on safety features. Increased know-how of vehicle security and larger take-up of subscription-based recovery services drives growth in this segment. Development on AI-powered theft detection and getting into the connected car ecosystem have also opened up SVR solutions more to owners of passenger vehicles.
The GPS-based segment dominated the global market in 2023 with a market share of 46.2%. The GPS-based segment leads the SVR market due to its efficiency in real-time tracking and high success rate in recoveries. These systems trace vehicle locations through satellite technology and respond promptly to incidents of theft. With their integration into mobile apps, telematics, and IoT platforms, it enhances accessibility and functionality. Increasing adoption by fleet operators and individual car owners is proof of how attractive this segment is. The advanced features, such as geofencing and route monitoring, enhance the security features. Other growth factors include the decreasing prices of GPS hardware and growing consumer awareness about connected solutions, which is making GPS-based SVR systems popular worldwide.
The individual vehicle owner segment dominated the global market in 2023 with a market share of 61.8%. The individual vehicle owner segment is significant for the SVR market as the growing fears for vehicle theft with increased awareness towards security solutions support this segment. It becomes easy for vehicle owners to monitor and recover through the adoption of GPS-based tracking and telematics systems. Moreover, increased access is also allowed for individual users through cheap subscription plans and easy mobile applications. The value addition includes features like real-time alerts, geofencing, and AI-based theft prediction. The segment also benefits from the rising popularity of connected vehicles, as well as a regulatory mandate for better security. In addition, affordability and technological innovations continue to fuel demand amongst individual vehicle owners.
| Attribute | Description |
|---|---|
| Market Size | Revenue (USD Billion) |
| Market size value in 2023 | USD 7.6 Billion |
| Market size value in 2033 | USD 16.8 Billion |
| CAGR (2024 to 2033) | 8.3% |
| Historical data | 2020-2022 |
| Base Year | 2023 |
| Forecast | 2024-2033 |
| Region | The regions analyzed for the market are Asia Pacific, Europe, South America, North America, and Middle East & Africa. Furthermore, the regions are further analyzed at the country level. |
| Segments | Vehicle, Technology, End-user |
As per The Brainy Insights, the size of the stolen vehicle recovery market was valued at USD 7.6 billion in 2023 to USD 16.8 billion by 2033.
The global stolen vehicle recovery market is growing at a CAGR of 8.3% during the forecast period 2024-2033.
The North America region emerged as the largest market for the stolen vehicle recovery.
Rising vehicle theft rates will influence the market's growth.
1. Introduction
1.1. Objectives of the Study
1.2. Market Definition
1.3. Research Scope
1.4. Currency
1.5. Key Target Audience
2. Research Methodology and Assumptions
3. Executive Summary
4. Premium Insights
4.1. Porter’s Five Forces Analysis
4.2. Value Chain Analysis
4.3. Top Investment Pockets
4.3.1. Market Attractiveness Analysis by Vehicle
4.3.2. Market Attractiveness Analysis by Technology
4.3.3. Market Attractiveness Analysis by End-User
4.3.4. Market Attractiveness Analysis by Region
4.4. Industry Trends
5. Market Dynamics
5.1. Market Evaluation
5.2. Drivers
5.2.1. Rising Vehicle Theft Rates
5.3. Restraints
5.3.1. High installation and subscription costs
5.4. Opportunities
5.4.1. Rise in adoption of SVR systems in developing countries
5.5. Challenges
5.5.1. Challenges in System Adoption
6. Global Stolen Vehicle Recovery Market Analysis and Forecast, By Vehicle
6.1. Segment Overview
6.2. Passenger vehicle
6.3. Commercial vehicle
6.4. Two-Wheelers
7. Global Stolen Vehicle Recovery Market Analysis and Forecast, By Technology
7.1. Segment Overview
7.2. GPS-Based
7.3. RFID-Based
7.4. Cellular-Based
7.5. LoRaWAN (Low Range Wide Area Network)
7.6. Others
8. Global Stolen Vehicle Recovery Market Analysis and Forecast, By End-User
8.1. Segment Overview
8.2. Individual Vehicle Owners
8.3. Fleet Owners
8.4. Insurance Companies
8.5. Government & Law Enforcement
9. Global Stolen Vehicle Recovery Market Analysis and Forecast, By Regional Analysis
9.1. Segment Overview
9.2. North America
9.2.1. U.S.
9.2.2. Canada
9.2.3. Mexico
9.3. Europe
9.3.1. Germany
9.3.2. France
9.3.3. U.K.
9.3.4. Italy
9.3.5. Spain
9.4. Asia-Pacific
9.4.1. Japan
9.4.2. China
9.4.3. India
9.5. South America
9.5.1. Brazil
9.6. Middle East and Africa
9.6.1. UAE
9.6.2. South Africa
10. Global Stolen Vehicle Recovery Market-Competitive Landscape
10.1. Overview
10.2. Market Share of Key Players in the Stolen Vehicle Recovery Market
10.2.1. Global Company Market Share
10.2.2. North America Company Market Share
10.2.3. Europe Company Market Share
10.2.4. APAC Company Market Share
10.3. Competitive Situations and Trends
10.3.1. Product Launches and Developments
10.3.2. Partnerships, Collaborations, and Agreements
10.3.3. Mergers & Acquisitions
10.3.4. Expansions
11. Company Profiles
11.1. Robert Bosch GmbH
11.1.1. Business Overview
11.1.2. Company Snapshot
11.1.3. Company Market Share Analysis
11.1.4. Company Product Portfolio
11.1.5. Recent Developments
11.1.6. SWOT Analysis
11.2. Vodafone Automotive S.p.A.
11.2.1. Business Overview
11.2.2. Company Snapshot
11.2.3. Company Market Share Analysis
11.2.4. Company Product Portfolio
11.2.5. Recent Developments
11.2.6. SWOT Analysis
11.3. CalAmp Wireless Networks Corporation (LoJack Corporation)
11.3.1. Business Overview
11.3.2. Company Snapshot
11.3.3. Company Market Share Analysis
11.3.4. Company Product Portfolio
11.3.5. Recent Developments
11.3.6. SWOT Analysis
11.4. Altron Limited (NETSTAR)
11.4.1. Business Overview
11.4.2. Company Snapshot
11.4.3. Company Market Share Analysis
11.4.4. Company Product Portfolio
11.4.5. Recent Developments
11.4.6. SWOT Analysis
11.5. Tokai Rika Co., Ltd.
11.5.1. Business Overview
11.5.2. Company Snapshot
11.5.3. Company Market Share Analysis
11.5.4. Company Product Portfolio
11.5.5. Recent Developments
11.5.6. SWOT Analysis
11.6. Teletrac Navman
11.6.1. Business Overview
11.6.2. Company Snapshot
11.6.3. Company Market Share Analysis
11.6.4. Company Product Portfolio
11.6.5. Recent Developments
11.6.6. SWOT Analysis
11.7. Verizon Connect
11.7.1. Business Overview
11.7.2. Company Snapshot
11.7.3. Company Market Share Analysis
11.7.4. Company Product Portfolio
11.7.5. Recent Developments
11.7.6. SWOT Analysis
11.8. Cartrack
11.8.1. Business Overview
11.8.2. Company Snapshot
11.8.3. Company Market Share Analysis
11.8.4. Company Product Portfolio
11.8.5. Recent Developments
11.8.6. SWOT Analysis
11.9. Ituran Global
11.9.1. Business Overview
11.9.2. Company Snapshot
11.9.3. Company Market Share Analysis
11.9.4. Company Product Portfolio
11.9.5. Recent Developments
11.9.6. SWOT Analysis
11.10. Spireon, Inc.
11.10.1. Business Overview
11.10.2. Company Snapshot
11.10.3. Company Market Share Analysis
11.10.4. Company Product Portfolio
11.10.5. Recent Developments
11.10.6. SWOT Analysis
List of Table
1. Global Stolen Vehicle Recovery Market, By Vehicle, 2020-2033 (USD Billion)
2. Global Passenger Vehicle, Stolen Vehicle Recovery Market, By Region, 2020-2033 (USD Billion)
3. Global Commercial Vehicle, Stolen Vehicle Recovery Market, By Region, 2020-2033 (USD Billion)
4. Global Two-Wheelers, Stolen Vehicle Recovery Market, By Region, 2020-2033 (USD Billion)
5. Global Stolen Vehicle Recovery Market, By Technology, 2020-2033 (USD Billion)
6. Global GPS-Based, Stolen Vehicle Recovery Market, By Region, 2020-2033 (USD Billion)
7. Global RFID-Based, Stolen Vehicle Recovery Market, By Region, 2020-2033 (USD Billion)
8. Global Cellular-Based, Stolen Vehicle Recovery Market, By Region, 2020-2033 (USD Billion)
9. Global LoRaWAN (Low Range Wide Area Network), Stolen Vehicle Recovery Market, By Region, 2020-2033 (USD Billion)
10. Global Others, Stolen Vehicle Recovery Market, By Region, 2020-2033 (USD Billion)
11. Global Stolen Vehicle Recovery Market, By End-User, 2020-2033 (USD Billion)
12. Global Individual Vehicle Owners, Stolen Vehicle Recovery Market, By Region, 2020-2033 (USD Billion)
13. Global Fleet Owners, Stolen Vehicle Recovery Market, By Region, 2020-2033 (USD Billion)
14. Global Insurance Companies, Stolen Vehicle Recovery Market, By Region, 2020-2033 (USD Billion)
15. Global Government & Law Enforcement, Stolen Vehicle Recovery Market, By Region, 2020-2033 (USD Billion)
16. Global Stolen Vehicle Recovery Market, By Region, 2020-2033 (USD Billion)
17. North America Stolen Vehicle Recovery Market, By Vehicle, 2020-2033 (USD Billion)
18. North America Stolen Vehicle Recovery Market, By Technology, 2020-2033 (USD Billion)
19. North America Stolen Vehicle Recovery Market, By End-User, 2020-2033 (USD Billion)
20. U.S. Stolen Vehicle Recovery Market, By Vehicle, 2020-2033 (USD Billion)
21. U.S. Stolen Vehicle Recovery Market, By Technology, 2020-2033 (USD Billion)
22. U.S. Stolen Vehicle Recovery Market, By End-User, 2020-2033 (USD Billion)
23. Canada Stolen Vehicle Recovery Market, By Vehicle, 2020-2033 (USD Billion)
24. Canada Stolen Vehicle Recovery Market, By Technology, 2020-2033 (USD Billion)
25. Canada Stolen Vehicle Recovery Market, By End-User, 2020-2033 (USD Billion)
26. Mexico Stolen Vehicle Recovery Market, By Vehicle, 2020-2033 (USD Billion)
27. Mexico Stolen Vehicle Recovery Market, By Technology, 2020-2033 (USD Billion)
28. Mexico Stolen Vehicle Recovery Market, By End-User, 2020-2033 (USD Billion)
29. Europe Stolen Vehicle Recovery Market, By Vehicle, 2020-2033 (USD Billion)
30. Europe Stolen Vehicle Recovery Market, By Technology, 2020-2033 (USD Billion)
31. Europe Stolen Vehicle Recovery Market, By End-User, 2020-2033 (USD Billion)
32. Germany Stolen Vehicle Recovery Market, By Vehicle, 2020-2033 (USD Billion)
33. Germany Stolen Vehicle Recovery Market, By Technology, 2020-2033 (USD Billion)
34. Germany Stolen Vehicle Recovery Market, By End-User, 2020-2033 (USD Billion)
35. France Stolen Vehicle Recovery Market, By Vehicle, 2020-2033 (USD Billion)
36. France Stolen Vehicle Recovery Market, By Technology, 2020-2033 (USD Billion)
37. France Stolen Vehicle Recovery Market, By End-User, 2020-2033 (USD Billion)
38. U.K. Stolen Vehicle Recovery Market, By Vehicle, 2020-2033 (USD Billion)
39. U.K. Stolen Vehicle Recovery Market, By Technology, 2020-2033 (USD Billion)
40. U.K. Stolen Vehicle Recovery Market, By End-User, 2020-2033 (USD Billion)
41. Italy Stolen Vehicle Recovery Market, By Vehicle, 2020-2033 (USD Billion)
42. Italy Stolen Vehicle Recovery Market, By Technology, 2020-2033 (USD Billion)
43. Italy Stolen Vehicle Recovery Market, By End-User, 2020-2033 (USD Billion)
44. Spain Stolen Vehicle Recovery Market, By Vehicle, 2020-2033 (USD Billion)
45. Spain Stolen Vehicle Recovery Market, By Technology, 2020-2033 (USD Billion)
46. Spain Stolen Vehicle Recovery Market, By End-User, 2020-2033 (USD Billion)
47. Asia Pacific Stolen Vehicle Recovery Market, By Vehicle, 2020-2033 (USD Billion)
48. Asia Pacific Stolen Vehicle Recovery Market, By Technology, 2020-2033 (USD Billion)
49. Asia Pacific Stolen Vehicle Recovery Market, By End-User, 2020-2033 (USD Billion)
50. Japan Stolen Vehicle Recovery Market, By Vehicle, 2020-2033 (USD Billion)
51. Japan Stolen Vehicle Recovery Market, By Technology, 2020-2033 (USD Billion)
52. Japan Stolen Vehicle Recovery Market, By End-User, 2020-2033 (USD Billion)
53. China Stolen Vehicle Recovery Market, By Vehicle, 2020-2033 (USD Billion)
54. China Stolen Vehicle Recovery Market, By Technology, 2020-2033 (USD Billion)
55. China Stolen Vehicle Recovery Market, By End-User, 2020-2033 (USD Billion)
56. India Stolen Vehicle Recovery Market, By Vehicle, 2020-2033 (USD Billion)
57. India Stolen Vehicle Recovery Market, By Technology, 2020-2033 (USD Billion)
58. India Stolen Vehicle Recovery Market, By End-User, 2020-2033 (USD Billion)
59. South America Stolen Vehicle Recovery Market, By Vehicle, 2020-2033 (USD Billion)
60. South America Stolen Vehicle Recovery Market, By Technology, 2020-2033 (USD Billion)
61. South America Stolen Vehicle Recovery Market, By End-User, 2020-2033 (USD Billion)
62. Brazil Stolen Vehicle Recovery Market, By Vehicle, 2020-2033 (USD Billion)
63. Brazil Stolen Vehicle Recovery Market, By Technology, 2020-2033 (USD Billion)
64. Brazil Stolen Vehicle Recovery Market, By End-User, 2020-2033 (USD Billion)
65. Middle East and Africa Stolen Vehicle Recovery Market, By Vehicle, 2020-2033 (USD Billion)
66. Middle East and Africa Stolen Vehicle Recovery Market, By Technology, 2020-2033 (USD Billion)
67. Middle East and Africa Stolen Vehicle Recovery Market, By End-User, 2020-2033 (USD Billion)
68. UAE Stolen Vehicle Recovery Market, By Vehicle, 2020-2033 (USD Billion)
69. UAE Stolen Vehicle Recovery Market, By Technology, 2020-2033 (USD Billion)
70. UAE Stolen Vehicle Recovery Market, By End-User, 2020-2033 (USD Billion)
71. South Africa Stolen Vehicle Recovery Market, By Vehicle, 2020-2033 (USD Billion)
72. South Africa Stolen Vehicle Recovery Market, By Technology, 2020-2033 (USD Billion)
73. South Africa Stolen Vehicle Recovery Market, By End-User, 2020-2033 (USD Billion)
List of Figures
1. Global Stolen Vehicle Recovery Market Segmentation
2. Stolen Vehicle Recovery Market: Research Methodology
3. Market Size Estimation Methodology: Bottom-Up Approach
4. Market Size Estimation Methodology: Top-Down Approach
5. Data Triangulation
6. Porter’s Five Forces Analysis
7. Value Chain Analysis
8. Global Stolen Vehicle Recovery Market Attractiveness Analysis By Vehicle
9. Global Stolen Vehicle Recovery Market Attractiveness Analysis By Technology
10. Global Stolen Vehicle Recovery Market Attractiveness Analysis By End-User
11. Global Stolen Vehicle Recovery Market Attractiveness Analysis by Region
12. Global Stolen Vehicle Recovery Market: Dynamics
13. Global Stolen Vehicle Recovery Market Share By Vehicle (2023 & 2033)
14. Global Stolen Vehicle Recovery Market Share By Technology (2023 & 2033)
15. Global Stolen Vehicle Recovery Market Share By End-User (2023 & 2033)
16. Global Stolen Vehicle Recovery Market Share by Regions (2023 & 2033)
17. Global Stolen Vehicle Recovery Market Share by Company (2023)
This study forecasts revenue at global, regional, and country levels from 2020 to 2033. The Brainy Insights has segmented the global stolen vehicle recovery market based on below-mentioned segments:
Global Stolen Vehicle Recovery Market by Vehicle:
Global Stolen Vehicle Recovery Market by Technology:
Global Stolen Vehicle Recovery Market by End-User:
Global Stolen Vehicle Recovery Market by Region:
Research has its special purpose to undertake marketing efficiently. In this competitive scenario, businesses need information across all industry verticals; the information about customer wants, market demand, competition, industry trends, distribution channels etc. This information needs to be updated regularly because businesses operate in a dynamic environment. Our organization, The Brainy Insights incorporates scientific and systematic research procedures in order to get proper market insights and industry analysis for overall business success. The analysis consists of studying the market from a miniscule level wherein we implement statistical tools which helps us in examining the data with accuracy and precision.
Our research reports feature both; quantitative and qualitative aspects for any market. Qualitative information for any market research process are fundamental because they reveal the customer needs and wants, usage and consumption for any product/service related to a specific industry. This in turn aids the marketers/investors in knowing certain perceptions of the customers. Qualitative research can enlighten about the different product concepts and designs along with unique service offering that in turn, helps define marketing problems and generate opportunities. On the other hand, quantitative research engages with the data collection process through interviews, e-mail interactions, surveys and pilot studies. Quantitative aspects for the market research are useful to validate the hypotheses generated during qualitative research method, explore empirical patterns in the data with the help of statistical tools, and finally make the market estimations.
The Brainy Insights offers comprehensive research and analysis, based on a wide assortment of factual insights gained through interviews with CXOs and global experts and secondary data from reliable sources. Our analysts and industry specialist assume vital roles in building up statistical tools and analysis models, which are used to analyse the data and arrive at accurate insights with exceedingly informative research discoveries. The data provided by our organization have proven precious to a diverse range of companies, facilitating them to address issues such as determining which products/services are the most appealing, whether or not customers use the product in the manner anticipated, the purchasing intentions of the market and many others.
Our research methodology encompasses an idyllic combination of primary and secondary initiatives. Key phases involved in this process are listed below:

The phase involves the gathering and collecting of market data and its related information with the help of different sources & research procedures.

The data procurement stage involves in data gathering and collecting through various data sources.
This stage involves in extensive research. These data sources includes:
Purchased Database: Purchased databases play a crucial role in estimating the market sizes irrespective of the domain. Our purchased database includes:
Primary Research: The Brainy Insights interacts with leading companies and experts of the concerned domain to develop the analyst team’s market understanding and expertise. It improves and substantiates every single data presented in the market reports. Primary research mainly involves in telephonic interviews, E-mail interactions and face-to-face interviews with the raw material providers, manufacturers/producers, distributors, & independent consultants. The interviews that we conduct provides valuable data on market size and industry growth trends prevailing in the market. Our organization also conducts surveys with the various industry experts in order to gain overall insights of the industry/market. For instance, in healthcare industry we conduct surveys with the pharmacists, doctors, surgeons and nurses in order to gain insights and key information of a medical product/device/equipment which the customers are going to usage. Surveys are conducted in the form of questionnaire designed by our own analyst team. Surveys plays an important role in primary research because surveys helps us to identify the key target audiences of the market. Additionally, surveys helps to identify the key target audience engaged with the market. Our survey team conducts the survey by targeting the key audience, thus gaining insights from them. Based on the perspectives of the customers, this information is utilized to formulate market strategies. Moreover, market surveys helps us to understand the current competitive situation of the industry. To be precise, our survey process typically involve with the 360 analysis of the market. This analytical process begins by identifying the prospective customers for a product or service related to the market/industry to obtain data on how a product/service could fit into customers’ lives.

Secondary Research: The secondary data sources includes information published by the on-profit organizations such as World bank, WHO, company fillings, investor presentations, annual reports, national government documents, statistical databases, blogs, articles, white papers and others. From the annual report, we analyse a company’s revenue to understand the key segment and market share of that organization in a particular region. We analyse the company websites and adopt the product mapping technique which is important for deriving the segment revenue. In the product mapping method, we select and categorize the products offered by the companies catering to domain specific market, deduce the product revenue for each of the companies so as to get overall estimation of the market size. We also source data and analyses trends based on information received from supply side and demand side intermediaries in the value chain. The supply side denotes the data gathered from supplier, distributor, wholesaler and the demand side illustrates the data gathered from the end customers for respective market domain.

The supply side for a domain specific market is analysed by:
The demand side for the market is estimated through:
In-house Library: Apart from these third-party sources, we have our in-house library of qualitative and quantitative information. Our in-house database includes market data for various industry and domains. These data are updated on regular basis as per the changing market scenario. Our library includes, historic databases, internal audit reports and archives.
Sometimes there are instances where there is no metadata or raw data available for any domain specific market. For those cases, we use our expertise to forecast and estimate the market size in order to generate comprehensive data sets. Our analyst team adopt a robust research technique in order to produce the estimates:
Data Synthesis: This stage involves the analysis & mapping of all the information obtained from the previous step. It also involves in scrutinizing the data for any discrepancy observed while data gathering related to the market. The data is collected with consideration to the heterogeneity of sources. Robust scientific techniques are in place for synthesizing disparate data sets and provide the essential contextual information that can orient market strategies. The Brainy Insights has extensive experience in data synthesis where the data passes through various stages:


Market Deduction & Formulation: The final stage comprises of assigning data points at appropriate market spaces so as to deduce feasible conclusions. Analyst perspective & subject matter expert based holistic form of market sizing coupled with industry analysis also plays a crucial role in this stage.
This stage involves in finalization of the market size and numbers that we have collected from data integration step. With data interpolation, it is made sure that there is no gap in the market data. Successful trend analysis is done by our analysts using extrapolation techniques, which provide the best possible forecasts for the market.
Data Validation & Market Feedback: Validation is the most important step in the process. Validation & re-validation via an intricately designed process helps us finalize data-points to be used for final calculations.

The Brainy Insights interacts with leading companies and experts of the concerned domain to develop the analyst team’s market understanding and expertise. It improves and substantiates every single data presented in the market reports. The data validation interview and discussion panels are typically composed of the most experienced industry members. The participants include, however, are not limited to:
Moreover, we always validate our data and findings through primary respondents from all the major regions we are working on.


Free Customization
Fortune 500 Clients
Free Yearly Update On Purchase Of Multi/Corporate License
Companies Served Till Date