- +1-315-215-1633
- sales@thebrainyinsights.com

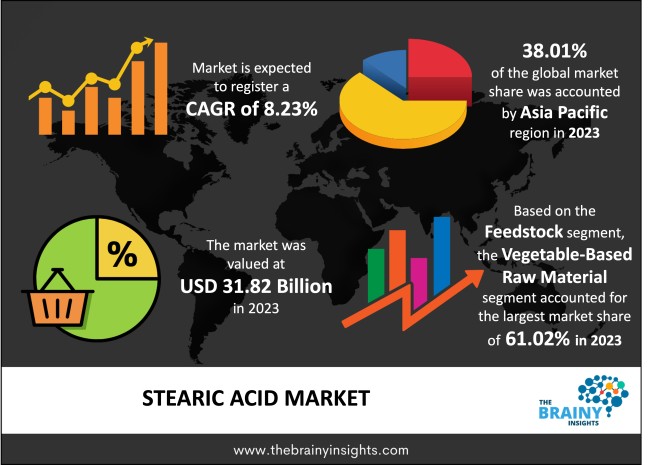
The global stearic acid market was valued at USD 31.82 Billion in 2023 and grew at a CAGR of 8.23% from 2024 to 2033. The market is expected to reach USD 70.17 Billion by 2033. The growth of the stearic acid market can be attributed to the rising applications of it in different end-user industries such as personal care, lubricants, soaps, detergents, etc. Further, the increasing investment in automotive batteries has played a pivotal role in the market growth.
The colourless, waxy substance known as stearic acid has a faint smell. It floats on water because it dissolves easily in oil-based solvents but not much in water. Shea butter and cocoa butter are primarily composed of this saturated fatty acid. Plants' naturally occurring fatty portions, such as palm oil, are a good source of stearic acid. It can be utilized in natural preparations and is used in cosmetic items due to the rise in demand for natural ingredients. Stearic acid is a product-hardening agent. They are extensively utilized in candles and soap bars. It has the same foaming ability but is also used in shaving foams. Stearic acid thickens and solidifies soap recipes by acting as a solidifier. Stearic acid's surfactant characteristic lowers oil’s surface tension, making it easier for water molecules to mix with oil and increasing the product's efficacy and shelf life.
Get an overview of this study by requesting a free sample
Increasing application in cosmetics products: There are many attributes of stearic acid which makes it a favourable material for skincare and cosmetics products. Stearic acid is an emollient, emulsifier, and lubricant, helps in softening and moisturizing the skin. It works well for binding in other components and keeping them from disintegrating. It maintains the skin's hydration and softness. Moreover, it unites the components and prevents them from splitting. Many skincare and personal care products, such as infant lotions, moisturizers, and sunscreens, include stearic acid. Stearic acid's occlusive properties prevent or delay moisture loss from the skin's surface, keeping the skin moisturized. In emulsions, stearic acid works well as a stabilizer, thickening, and softener, giving the skin a cooling sensation. The skin is shielded from environmental aggressors like pollution, UV radiation, and inclement weather by the barrier that stearic acid forms on its surface.
Fluctuating cost of materials: Manufacturers of stearic acid are always more concerned about the cost of raw materials. The market is being severely restrained by the protests of animal rights organizations against items created from animal fat, which is causing issues with stearic acid products made from animal fats as a source. Many businesses need help to maintain sustainable margins and remain competitive in raw material price fluctuation.
Increased spending on product innovation: The opportunities that will propel the market include the growing demand for biodegradable products and the rise in research and development spending for new product development. Research and development expenditures have increased to improve product distribution, particularly for personal care products. During the projection period, this market will be driven by the increased use of stearic acid in personal care products, such as shaving creams, shampoos, and soap. The beauty business, a vibrant segment ready for upheaval, has rebuilt itself around an ever-expanding assortment of goods, channels, and markets. Younger demographic dividends will drive this change as their ideas of beauty change along with their views on everything, including the value of personal care products and the concept of sustainability.
The regions analyzed for the market include North America, Europe, South America, Asia Pacific, the Middle East, and Africa. Asia-Pacific emerged as the most significant stearic acid market, with a 38.01% market revenue share in 2023.
Asia Pacific region will account for the largest market share with revenue growth. The market is being driven by the numerous end-user businesses in the regional countries. The region has a high demand for stearic acid, especially for manufacturing personal care products such as skincare and cosmetics, lubricants, detergents and soaps, and plastics. The growing investment in the pharmaceutical industry, especially in India and Japan, is attracting more regional manufacturers.
Asia-Pacific region Stearic Acid Market Share in 2023 - 38.01%
www.thebrainyinsights.com
Check the geographical analysis of this market by requesting a free sample
The feedstock segment is divided into vegetable-based raw materials and animal-based raw materials. The vegetable-based raw material segment dominated the market, with a share of around 61.02% in 2023. The availability of various sunflower oils high in oleic and stearic acids primarily drove the vegetable-based raw materials category. The increased investment in research and development in extracting different vegetable-based sources has prompted the demand.
The end-user segment is divided into personal care, rubber processing, lubricants, soaps and detergents, textiles, plastics and others. The personal care segment dominated the market, with a share of around 32.19% in 2023. This is because producers of personal care products frequently utilize stearic acid as a surfactant and washing agent. The production of sodium and magnesium stearate, two ingredients in personal care products used in skincare and hair care products, requires stearic acid. Stearic acid is used in detergents and soaps in a variety of ways.
Report Description:
| Attribute | Description |
|---|---|
| Market Size | Revenue (USD Billion) |
| Market size value in 2023 | USD 31.82 Billion |
| Market size value in 2033 | USD 70.17 Billion |
| CAGR (2024 to 2033) | 8.23% |
| Historical data | 2020-2022 |
| Base Year | 2023 |
| Forecast | 2024-2033 |
| Region | The market's regions are Asia Pacific, Europe, South America, North America, the Middle East and Africa. Furthermore, the regions are further analyzed at the country level. |
| Segments | Feedstock and End-user |
As per The Brainy Insights, the size of the stearic acid market was valued USD 31.82 Billion in 2023 to USD 70.17 Billion by 2033.
Global stearic acid market is growing at a CAGR of 8.23% during the forecast period 2024-2033.
The global stearic acid market has been segmented based on feedstock, end-user, and regions. Vegetable-based raw materials led the market in 2023 in the feedstock segment. Personal care led the market in 2023 in the end-user segment.
Asia Pacific region emerged as the largest market for the stearic acid.
The market's growth will be influenced by the growing usage of stearic acid in different applications.
The cost of materials effects can hamper the market growth.
The increasing growth of personal care industry is providing huge opportunities to the market.
1. Introduction
1.1. Objectives of the Study
1.2. Market Definition
1.3. Research Scope
1.4. Currency
1.5. Key Target Audience
2. Research Methodology and Assumptions
3. Executive Summary
4. Premium Insights
4.1. Porter’s Five Forces Analysis
4.2. Value Chain Analysis
4.3. Top Investment Pockets
4.3.1. Market Attractiveness Analysis by Feedstock
4.3.2. Market Attractiveness Analysis by Application
4.3.3. Market Attractiveness Analysis by Region
4.4. Industry Trends
5. Market Dynamics
5.1. Market Evaluation
5.2. Drivers
5.2.1. Increasing usage of stearic acid across applications
5.3. Restraints
5.3.1. Fluctuating cost of raw materials
5.4. Opportunities
5.4.1. Increasing investment in bio-based products
5.5. Challenges
5.5.1. Regulatory concerns
6. Global Stearic Acid Market Analysis and Forecast, By Feedstock
6.1. Segment Overview
6.2. Vegetable Based Raw Material
6.3. Animal Based Raw Material
7. Global Stearic Acid Market Analysis and Forecast, By Application
7.1. Segment Overview
7.2. Personal Care
7.3. Rubber Processing
7.4. Lubricants
7.5. Soaps and Detergents
7.6. Textile
7.7. Plastics
7.8. Others
8. Global Stearic Acid Market Analysis and Forecast, By Regional Analysis
8.1. Segment Overview
8.2. North America
8.2.1. U.S.
8.2.2. Canada
8.2.3. Mexico
8.3. Europe
8.3.1. Germany
8.3.2. France
8.3.3. U.K.
8.3.4. Italy
8.3.5. Spain
8.4. Asia-Pacific
8.4.1. Japan
8.4.2. China
8.4.3. India
8.5. South America
8.5.1. Brazil
8.6. Middle East and Africa
8.6.1. UAE
8.6.2. South Africa
9. Global Stearic Acid Market-Competitive Landscape
9.1. Overview
9.2. Market Share of Key Players in the Stearic Acid Market
9.2.1. Global Company Market Share
9.2.2. North America Company Market Share
9.2.3. Europe Company Market Share
9.2.4. APAC Company Market Share
9.3. Competitive Situations and Trends
9.3.1. Product Launches and Developments
9.3.2. Partnerships, Collaborations, and Agreements
9.3.3. Mergers & Acquisitions
9.3.4. Expansions
10. Company Profiles
10.1. The Chemical Company
10.1.1. Business Overview
10.1.2. Company Snapshot
10.1.3. Company Market Share Analysis
10.1.4. Company Product Portfolio
10.1.5. Recent Developments
10.1.6. SWOT Analysis
10.2. Cayman Chemical
10.2.1. Business Overview
10.2.2. Company Snapshot
10.2.3. Company Market Share Analysis
10.2.4. Company Product Portfolio
10.2.5. Recent Developments
10.2.6. SWOT Analysis
10.3. VVF LLC
10.3.1. Business Overview
10.3.2. Company Snapshot
10.3.3. Company Market Share Analysis
10.3.4. Company Product Portfolio
10.3.5. Recent Developments
10.3.6. SWOT Analysis
10.4. U.S. Chemicals LLC
10.4.1. Business Overview
10.4.2. Company Snapshot
10.4.3. Company Market Share Analysis
10.4.4. Company Product Portfolio
10.4.5. Recent Developments
10.4.6. SWOT Analysis
10.5. Deeno Group
10.5.1. Business Overview
10.5.2. Company Snapshot
10.5.3. Company Market Share Analysis
10.5.4. Company Product Portfolio
10.5.5. Recent Developments
10.5.6. SWOT Analysis
10.6. Pacific Oleochemicals
10.6.1. Business Overview
10.6.2. Company Snapshot
10.6.3. Company Market Share Analysis
10.6.4. Company Product Portfolio
10.6.5. Recent Developments
10.6.6. SWOT Analysis
10.7. Parchem
10.7.1. Business Overview
10.7.2. Company Snapshot
10.7.3. Company Market Share Analysis
10.7.4. Company Product Portfolio
10.7.5. Recent Developments
10.7.6. SWOT Analysis
10.8. Kao Chemicals
10.8.1. Business Overview
10.8.2. Company Snapshot
10.8.3. Company Market Share Analysis
10.8.4. Company Product Portfolio
10.8.5. Recent Developments
10.8.6. SWOT Analysis
10.9. BASF
10.9.1. Business Overview
10.9.2. Company Snapshot
10.9.3. Company Market Share Analysis
10.9.4. Company Product Portfolio
10.9.5. Recent Developments
10.9.6. SWOT Analysis
10.10. Emery Oleochemicals
10.10.1. Business Overview
10.10.2. Company Snapshot
10.10.3. Company Market Share Analysis
10.10.4. Company Product Portfolio
10.10.5. Recent Developments
10.11. AkzoNobel
10.11.1. Business Overview
10.11.2. Company Snapshot
10.11.3. Company Market Share Analysis
10.11.4. Company Product Portfolio
10.11.5. Recent Developments
10.11.6. SWOT Analysis
10.12. Godrej industries
10.12.1. Business Overview
10.12.2. Company Snapshot
10.12.3. Company Market Share Analysis
10.12.4. Company Product Portfolio
10.12.5. Recent Developments
10.12.6. SWOT Analysis
10.13. Wilmar International
10.13.1. Business Overview
10.13.2. Company Snapshot
10.13.3. Company Market Share Analysis
10.13.4. Company Product Portfolio
10.13.5. Recent Developments
10.13.6. SWOT Analysis
10.14. Oleon
10.14.1. Business Overview
10.14.2. Company Snapshot
10.14.3. Company Market Share Analysis
10.14.4. Company Product Portfolio
10.14.5. Recent Developments
10.14.6. SWOT Analysis
10.15. Merck KGaA
10.15.1. Business Overview
10.15.2. Company Snapshot
10.15.3. Company Market Share Analysis
10.15.4. Company Product Portfolio
10.15.5. Recent Developments
10.15.6. SWOT Analysis
10.16. Kuala Lumpur Kepong
10.16.1. Business Overview
10.16.2. Company Snapshot
10.16.3. Company Market Share Analysis
10.16.4. Company Product Portfolio
10.16.5. Recent Developments
10.16.6. SWOT Analysis
10.17. IOI Oleochemicals
10.17.1. Business Overview
10.17.2. Company Snapshot
10.17.3. Company Market Share Analysis
10.17.4. Company Product Portfolio
10.17.5. Recent Developments
10.17.6. SWOT Analysis
10.18. Procter & Gamble
10.18.1. Business Overview
10.18.2. Company Snapshot
10.18.3. Company Market Share Analysis
10.18.4. Company Product Portfolio
10.18.5. Recent Developments
10.18.6. SWOT Analysis
List of Table
1. Global Stearic Acid Market, By Feedstock, 2020-2033 (USD Billion)
2. Global Vegetable Based Raw Material, Stearic Acid Market, By Region, 2020-2033 (USD Billion)
3. Global Animal Based Raw Material, Stearic Acid Market, By Region, 2020-2033 (USD Billion)
4. Global Stearic Acid Market, By Application, 2020-2033 (USD Billion)
5. Global Personal Care, Stearic Acid Market, By Region, 2020-2033 (USD Billion)
6. Global Rubber Processing, Stearic Acid Market, By Region, 2020-2033 (USD Billion)
7. Global Lubricants, Stearic Acid Market, By Region, 2020-2033 (USD Billion)
8. Global Soaps and Detergents, Stearic Acid Market, By Region, 2020-2033 (USD Billion)
9. Global Textile, Stearic Acid Market, By Region, 2020-2033 (USD Billion)
10. Global Plastics, Stearic Acid Market, By Region, 2020-2033 (USD Billion)
11. Global Others, Stearic Acid Market, By Region, 2020-2033 (USD Billion)
12. Global Stearic Acid Market, By Region, 2020-2033 (USD Billion)
13. North America Stearic Acid Market, By Feedstock, 2020-2033 (USD Billion)
14. North America Stearic Acid Market, By Application, 2020-2033 (USD Billion)
15. U.S. Stearic Acid Market, By Feedstock, 2020-2033 (USD Billion)
16. U.S. Stearic Acid Market, By Application, 2020-2033 (USD Billion)
17. Canada Stearic Acid Market, By Feedstock, 2020-2033 (USD Billion)
18. Canada Stearic Acid Market, By Application, 2020-2033 (USD Billion)
19. Mexico Stearic Acid Market, By Feedstock, 2020-2033 (USD Billion)
20. Mexico Stearic Acid Market, By Application, 2020-2033 (USD Billion)
21. Europe Stearic Acid Market, By Feedstock, 2020-2033 (USD Billion)
22. Europe Stearic Acid Market, By Application, 2020-2033 (USD Billion)
23. Germany Stearic Acid Market, By Feedstock, 2020-2033 (USD Billion)
24. Germany Stearic Acid Market, By Application, 2020-2033 (USD Billion)
25. France Stearic Acid Market, By Feedstock, 2020-2033 (USD Billion)
26. France Stearic Acid Market, By Application, 2020-2033 (USD Billion)
27. U.K. Stearic Acid Market, By Feedstock, 2020-2033 (USD Billion)
28. U.K. Stearic Acid Market, By Application, 2020-2033 (USD Billion)
29. Italy Stearic Acid Market, By Feedstock, 2020-2033 (USD Billion)
30. Italy Stearic Acid Market, By Application, 2020-2033 (USD Billion)
31. Spain Stearic Acid Market, By Feedstock, 2020-2033 (USD Billion)
32. Spain Stearic Acid Market, By Application, 2020-2033 (USD Billion)
33. Asia Pacific Stearic Acid Market, By Feedstock, 2020-2033 (USD Billion)
34. Asia Pacific Stearic Acid Market, By Application, 2020-2033 (USD Billion)
35. Japan Stearic Acid Market, By Feedstock, 2020-2033 (USD Billion)
36. Japan Stearic Acid Market, By Application, 2020-2033 (USD Billion)
37. China Stearic Acid Market, By Feedstock, 2020-2033 (USD Billion)
38. China Stearic Acid Market, By Application, 2020-2033 (USD Billion)
39. India Stearic Acid Market, By Feedstock, 2020-2033 (USD Billion)
40. India Stearic Acid Market, By Application, 2020-2033 (USD Billion)
41. South America Stearic Acid Market, By Feedstock, 2020-2033 (USD Billion)
42. South America Stearic Acid Market, By Application, 2020-2033 (USD Billion)
43. Brazil Stearic Acid Market, By Feedstock, 2020-2033 (USD Billion)
44. Brazil Stearic Acid Market, By Application, 2020-2033 (USD Billion)
45. Middle East and Africa Stearic Acid Market, By Feedstock, 2020-2033 (USD Billion)
46. Middle East and Africa Stearic Acid Market, By Application, 2020-2033 (USD Billion)
47. UAE Stearic Acid Market, By Feedstock, 2020-2033 (USD Billion)
48. UAE Stearic Acid Market, By Application, 2020-2033 (USD Billion)
49. South Africa Stearic Acid Market, By Feedstock, 2020-2033 (USD Billion)
50. South Africa Stearic Acid Market, By Application, 2020-2033 (USD Billion)
List of Figures
1. Global Stearic Acid Market Segmentation
2. Stearic Acid Market: Research Methodology
3. Market Size Estimation Methodology: Bottom-Up Approach
4. Market Size Estimation Methodology: Top-Down Approach
5. Data Triangulation
6. Porter’s Five Forces Analysis
7. Value Chain Analysis
8. Global Stearic Acid Market Attractiveness Analysis by Feedstock
9. Global Stearic Acid Market Attractiveness Analysis by Application
10. Global Stearic Acid Market Attractiveness Analysis by Region
11. Global Stearic Acid Market: Dynamics
12. Global Stearic Acid Market Share by Feedstock (2023 & 2033)
13. Global Stearic Acid Market Share by Application (2023 & 2033)
14. Global Stearic Acid Market Share by Regions (2023 & 2033)
15. Global Stearic Acid Market Share by Company (2023)
This study forecasts revenue at global, regional, and country levels from 2020 to 2033. The Brainy Insights has segmented the global stearic acid market based on below mentioned segments:
Global Stearic Acid Market by Type:
Global Stearic Acid Market by Application:
Global Stearic Acid Market by Region:
Research has its special purpose to undertake marketing efficiently. In this competitive scenario, businesses need information across all industry verticals; the information about customer wants, market demand, competition, industry trends, distribution channels etc. This information needs to be updated regularly because businesses operate in a dynamic environment. Our organization, The Brainy Insights incorporates scientific and systematic research procedures in order to get proper market insights and industry analysis for overall business success. The analysis consists of studying the market from a miniscule level wherein we implement statistical tools which helps us in examining the data with accuracy and precision.
Our research reports feature both; quantitative and qualitative aspects for any market. Qualitative information for any market research process are fundamental because they reveal the customer needs and wants, usage and consumption for any product/service related to a specific industry. This in turn aids the marketers/investors in knowing certain perceptions of the customers. Qualitative research can enlighten about the different product concepts and designs along with unique service offering that in turn, helps define marketing problems and generate opportunities. On the other hand, quantitative research engages with the data collection process through interviews, e-mail interactions, surveys and pilot studies. Quantitative aspects for the market research are useful to validate the hypotheses generated during qualitative research method, explore empirical patterns in the data with the help of statistical tools, and finally make the market estimations.
The Brainy Insights offers comprehensive research and analysis, based on a wide assortment of factual insights gained through interviews with CXOs and global experts and secondary data from reliable sources. Our analysts and industry specialist assume vital roles in building up statistical tools and analysis models, which are used to analyse the data and arrive at accurate insights with exceedingly informative research discoveries. The data provided by our organization have proven precious to a diverse range of companies, facilitating them to address issues such as determining which products/services are the most appealing, whether or not customers use the product in the manner anticipated, the purchasing intentions of the market and many others.
Our research methodology encompasses an idyllic combination of primary and secondary initiatives. Key phases involved in this process are listed below:

The phase involves the gathering and collecting of market data and its related information with the help of different sources & research procedures.

The data procurement stage involves in data gathering and collecting through various data sources.
This stage involves in extensive research. These data sources includes:
Purchased Database: Purchased databases play a crucial role in estimating the market sizes irrespective of the domain. Our purchased database includes:
Primary Research: The Brainy Insights interacts with leading companies and experts of the concerned domain to develop the analyst team’s market understanding and expertise. It improves and substantiates every single data presented in the market reports. Primary research mainly involves in telephonic interviews, E-mail interactions and face-to-face interviews with the raw material providers, manufacturers/producers, distributors, & independent consultants. The interviews that we conduct provides valuable data on market size and industry growth trends prevailing in the market. Our organization also conducts surveys with the various industry experts in order to gain overall insights of the industry/market. For instance, in healthcare industry we conduct surveys with the pharmacists, doctors, surgeons and nurses in order to gain insights and key information of a medical product/device/equipment which the customers are going to usage. Surveys are conducted in the form of questionnaire designed by our own analyst team. Surveys plays an important role in primary research because surveys helps us to identify the key target audiences of the market. Additionally, surveys helps to identify the key target audience engaged with the market. Our survey team conducts the survey by targeting the key audience, thus gaining insights from them. Based on the perspectives of the customers, this information is utilized to formulate market strategies. Moreover, market surveys helps us to understand the current competitive situation of the industry. To be precise, our survey process typically involve with the 360 analysis of the market. This analytical process begins by identifying the prospective customers for a product or service related to the market/industry to obtain data on how a product/service could fit into customers’ lives.

Secondary Research: The secondary data sources includes information published by the on-profit organizations such as World bank, WHO, company fillings, investor presentations, annual reports, national government documents, statistical databases, blogs, articles, white papers and others. From the annual report, we analyse a company’s revenue to understand the key segment and market share of that organization in a particular region. We analyse the company websites and adopt the product mapping technique which is important for deriving the segment revenue. In the product mapping method, we select and categorize the products offered by the companies catering to domain specific market, deduce the product revenue for each of the companies so as to get overall estimation of the market size. We also source data and analyses trends based on information received from supply side and demand side intermediaries in the value chain. The supply side denotes the data gathered from supplier, distributor, wholesaler and the demand side illustrates the data gathered from the end customers for respective market domain.

The supply side for a domain specific market is analysed by:
The demand side for the market is estimated through:
In-house Library: Apart from these third-party sources, we have our in-house library of qualitative and quantitative information. Our in-house database includes market data for various industry and domains. These data are updated on regular basis as per the changing market scenario. Our library includes, historic databases, internal audit reports and archives.
Sometimes there are instances where there is no metadata or raw data available for any domain specific market. For those cases, we use our expertise to forecast and estimate the market size in order to generate comprehensive data sets. Our analyst team adopt a robust research technique in order to produce the estimates:
Data Synthesis: This stage involves the analysis & mapping of all the information obtained from the previous step. It also involves in scrutinizing the data for any discrepancy observed while data gathering related to the market. The data is collected with consideration to the heterogeneity of sources. Robust scientific techniques are in place for synthesizing disparate data sets and provide the essential contextual information that can orient market strategies. The Brainy Insights has extensive experience in data synthesis where the data passes through various stages:


Market Deduction & Formulation: The final stage comprises of assigning data points at appropriate market spaces so as to deduce feasible conclusions. Analyst perspective & subject matter expert based holistic form of market sizing coupled with industry analysis also plays a crucial role in this stage.
This stage involves in finalization of the market size and numbers that we have collected from data integration step. With data interpolation, it is made sure that there is no gap in the market data. Successful trend analysis is done by our analysts using extrapolation techniques, which provide the best possible forecasts for the market.
Data Validation & Market Feedback: Validation is the most important step in the process. Validation & re-validation via an intricately designed process helps us finalize data-points to be used for final calculations.

The Brainy Insights interacts with leading companies and experts of the concerned domain to develop the analyst team’s market understanding and expertise. It improves and substantiates every single data presented in the market reports. The data validation interview and discussion panels are typically composed of the most experienced industry members. The participants include, however, are not limited to:
Moreover, we always validate our data and findings through primary respondents from all the major regions we are working on.


Free Customization
Fortune 500 Clients
Free Yearly Update On Purchase Of Multi/Corporate License
Companies Served Till Date