- +1-315-215-1633
- sales@thebrainyinsights.com

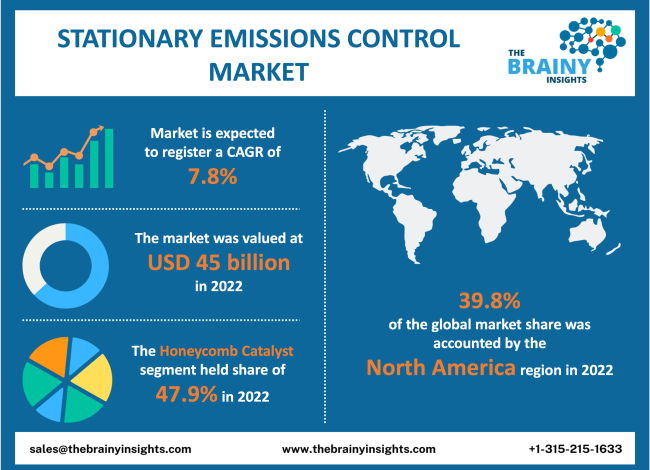
The global stationary emissions control market was valued at USD 45 billion in 2022 and is anticipated to growing at a CAGR of 7.8% from 2023 to 2032. The global stationary emissions control market is expected to reach USD 95.3 billion by 2032. The Asia Pacific is expected to grow the fastest during the forecast period.
Today, emission control catalysts are employed in a variety of stationary applications as well as on all sorts of internal combustion engines. Catalyst-coated monolithic substrates are used in catalytic reactors for mobile applications, also called catalytic converters. Conversion efficiency, light-off temperature, and space velocity are all used to describe the catalyst's performance. The significance of emission control catalysts has grown as environmental issues and efforts to combat pollution have gained prominence on a global scale. According to the source of the emissions, emission control catalysts are separated into two categories: stationary and mobile sources (such as automotive catalysts). The market's mobile emission catalyst segment is the largest; the demand for inactive emission catalysts is smaller. The market is seeing increased revenue growth due to strict emission control rules, expanding industrial and urbanization, and other reasons. Due to on-road and off-road emission sources, automotive and industrial emissions are rapidly rising, contributing to air pollution and other environmental problems. End-use businesses operating in different nations are putting ideas into practice, including the quick uptake of catalytic converters.
Get an overview of this study by requesting a free sample
The rise in stationary emission control catalyst- One of the main factors promoting the growth of the stationary emission control catalyst market is the strict emission control laws that drive the demand for emission control catalysts. The principal causes of the growing environmental pollution, a huge worldwide issue, include rapid industrialization and urbanization. Due to the development of on- and off-road pollution sources, industrial and automobile emissions have been growing tremendously. Additionally, as people's awareness of pollution rises, stricter emission regulations are imposed globally, driving up demand for stationary catalysts for emission control that utilize precious metals. More stringent pollution rules are expected to accelerate the expansion, increasing the need for lighter, quicker, and fuel-efficient automobiles.
High cost- One of the things preventing the stationary emission control catalyst market from expanding is high maintenance costs. While ammonia leaks through without participating in the process, catalysts employed in stationary emission control applications have a limited lifetime in the flue gas. Additionally, this system is highly vulnerable to contamination and plugging during operation. Because of this, some flue gas pollutants may prevent the system from reducing NOx levels or cause the ammonia to oxidize, producing more NOx. This can raise the price of reagents.
Increasing significance- One significant stationary emission control catalyst trend that boosts market expansion is the growing significance of adding catalytic converters to minimize vehicle emissions. Emission control catalysts are used in many automobiles and industrial processing units due to the requirement to reduce emissions from internal combustion engine (ICE)-based vehicles and industrial activities. Improvements in car engine technology and catalytic converters address the issues brought on by emissions into the environment. 98% of the hydrocarbons, carbon monoxide, and nitrogen oxides produced by an automobile's engine can be eliminated with a catalytic converter. Automobile manufacturers are developing cutting-edge systems that enhance catalytic converters' overall performance to meet the necessary emission regulations.
Low-cost alternatives- Power generation plant operators may use low-cost technologies, such as low NOx burners or selective non-catalytic reduction (SNCR) systems, to control NOx as a result of the high cost of SCR systems. Therefore, throughout the forecast period, low-cost alternatives will restrain the expansion of the global stationary emission control catalyst market.
The regions analyzed for the market include North America, Europe, South America, Asia Pacific, the Middle East, and Africa. North America emerged as the largest market for the global stationary emissions control market, with a 39.8% share of the market revenue in 2022.
North America currently dominates the stationary emissions control market. In the US, there are more than 3,400 fossil fuel-fired power facilities. As a result, a significant amount of gas is discharged into the atmosphere. The Environment Protection Agency (EPA) released the clean power plan in August 2015 to address this. The National Emission Standards for Hazardous Air Pollutants (NESHAP) and New Source Performance Standards of the EPA also contain stationary engine rules that must be adhered to (NSPS). This pollution control plan and EPA rules drive the country's emission control catalysts market. One of the biggest businesses in the US is the chemical industry, the other end-user sector. The chemical sector in the US economy is worth USD 768 billion and contributes 25% to the country's GDP.
The Asia Pacific market is expected to rise in the forecast period. With increasing economic activity in China, coal-fired power generation worldwide had a significant resurgence in 2021. With natural gas costs skyrocketing and electricity demand exceeding low-carbon supply, the world's coal power generation will climb by 9% to 10,350 terawatt-hours (TWh) in 2021, setting a new record. However, it is anticipated that coal will make up 36% of the world's energy mix in 2022.
North America Region Stationary Emissions Control Market Share in 2022 - 39.8%
www.thebrainyinsights.com
Check the geographical analysis of this market by requesting a free sample
The type segment is divided into the corrugated catalyst, plate catalyst, and honeycomb catalyst. The honeycomb catalyst segment dominated the market, with a market share of around 47.9% in 2022. The capacity of honeycomb catalysts to reduce air pollution in end-use industries is the main factor contributing to their increased demand. Another essential aspect boosting this segment's revenue growth is production innovations and strategic alliances targeted at producing products of the highest quality. The honeycomb catalyst has characteristics like a high specific area, high activity, changeable pitch, and a wide range of applications, including, among others, cement manufacturing and coal-fired power plants. Market players from different nations are making considerable investments to make their products resistant to sulfur poisoning, which also boosts this segment's revenue growth.
The application segment is divided into industrial, power generation, and others. Over the forecast period, the power generation segment is expected to grow at the fastest CAGR of 8.4%. One of the primary uses of stationary catalysts is the regulation of emissions from power plants. In particular, SCR or NOx dissociation is used to reduce NOx emissions. NOx emissions from power stations must be reduced to prevent acid rain and photochemical smog. As a result of higher gas costs in the United States and Europe and increasing economic activity in China, coal-fired power generation worldwide had a significant resurgence in 2021. With natural gas costs skyrocketing and electricity demand exceeding low-carbon supply, the world's coal power generation will climb by 9% to 10,350 terawatt-hours (TWh) in 2021, setting a new record. However, it is anticipated that coal will make up 36% of the world's energy mix in 2022.
| Attribute | Description |
|---|---|
| Market Size | Revenue (USD Billion) |
| Market size value in 2022 | USD 45 billion |
| Market size value in 2032 | USD 95.3 billion |
| CAGR (2023 to 2032) | 7. 8% |
| Historical data | 2019-2021 |
| Base Year | 2022 |
| Forecast | 2023-2032 |
| Regional Segments | North America, Asia Pacific, Europe, Latin America, Middle East and Africa |
| Segments | Type, Application |
As per The Brainy Insights, the size of the stationary emissions control market was valued at USD 45 billion in 2022 to USD 95.3 billion by 2032.
The global stationary emissions control market is growing at a CAGR of 7.8% during the forecast period 2023-2032.
North America emerged as the largest market for stationary emissions control.
1. Introduction
1.1. Objectives of the Study
1.2. Market Definition
1.3. Research Scope
1.4. Currency
1.5. Key Target Audience
2. Research Methodology and Assumptions
3. Executive Summary
4. Premium Insights
4.1. Porter’s Five Forces Analysis
4.2. Value Chain Analysis
4.3. Top Investment Pockets
4.3.1. Market Attractiveness Analysis By Type
4.3.2. Market Attractiveness Analysis By Application
4.3.3. Market Attractiveness Analysis By Region
4.4. Industry Trends
5. Market Dynamics
5.1. Market Evaluation
5.2. Drivers
5.2.1. Rise in stationary emission control catalyst
5.3. Restraints
5.3.1. High cost
5.4. Opportunities
5.4.1. Increasing significance
5.5. Challenges
5.5.1. Low-cost alternatives
6. Global Stationary Emissions Control Market Analysis and Forecast, By Type
6.1. Segment Overview
6.2. Corrugated Catalyst
6.3. Plate Catalyst
6.4. Honeycomb Catalyst
7. Global Stationary Emissions Control Market Analysis and Forecast, By Application
7.1. Segment Overview
7.2. Industrial
7.3. Power Generation
7.4. Others
8. Global Stationary Emissions Control Market Analysis and Forecast, By Regional Analysis
8.1. Segment Overview
8.2. North America
8.2.1. U.S.
8.2.2. Canada
8.2.3. Mexico
8.3. Europe
8.3.1. Germany
8.3.2. France
8.3.3. U.K.
8.3.4. Italy
8.3.5. Spain
8.4. Asia-Pacific
8.4.1. Japan
8.4.2. China
8.4.3. India
8.5. South America
8.5.1. Brazil
8.6. Middle East and Africa
8.6.1. UAE
8.6.2. South Africa
9. Global Stationary Emissions Control Market-Competitive Landscape
9.1. Overview
9.2. Market Share of Key Players in Global Stationary Emissions Control Market
9.2.1. Global Company Market Share
9.2.2. North America Company Market Share
9.2.3. Europe Company Market Share
9.2.4. APAC Company Market Share
9.3. Competitive Situations and Trends
9.3.1. Product Launches and Developments
9.3.2. Partnerships, Collaborations, and Agreements
9.3.3. Mergers & Acquisitions
9.3.4. Expansions
10. Company Profiles
10.1. BASF SE
10.1.1. Business Overview
10.1.2. Company Snapshot
10.1.3. Company Market Share Analysis
10.1.4. Company Product Portfolio
10.1.5. Recent Developments
10.1.6. SWOT Analysis
10.2. AeriNOx Inc.
10.2.1. Business Overview
10.2.2. Company Snapshot
10.2.3. Company Market Share Analysis
10.2.4. Company Product Portfolio
10.2.5. Recent Developments
10.2.6. SWOT Analysis
10.3. Bosal Nederland BV
10.3.1. Business Overview
10.3.2. Company Snapshot
10.3.3. Company Market Share Analysis
10.3.4. Company Product Portfolio
10.3.5. Recent Developments
10.3.6. SWOT Analysis
10.4. Cataler Corp.
10.4.1. Business Overview
10.4.2. Company Snapshot
10.4.3. Company Market Share Analysis
10.4.4. Company Product Portfolio
10.4.5. Recent Developments
10.4.6. SWOT Analysis
10.5. CDTi Advanced Materials Inc.
10.5.1. Business Overview
10.5.2. Company Snapshot
10.5.3. Company Market Share Analysis
10.5.4. Company Product Portfolio
10.5.5. Recent Developments
10.5.6. SWOT Analysis
10.6. Clariant International Ltd.
10.6.1. Business Overview
10.6.2. Company Snapshot
10.6.3. Company Market Share Analysis
10.6.4. Company Product Portfolio
10.6.5. Recent Developments
10.6.6. SWOT Analysis
10.7. CORMETECH Inc.
10.7.1. Business Overview
10.7.2. Company Snapshot
10.7.3. Company Market Share Analysis
10.7.4. Company Product Portfolio
10.7.5. Recent Developments
10.7.6. SWOT Analysis
10.8. Corning Inc.
10.8.1. Business Overview
10.8.2. Company Snapshot
10.8.3. Company Market Share Analysis
10.8.4. Company Product Portfolio
10.8.5. Recent Developments
10.8.6. SWOT Analysis
10.9. DCL International Inc.
10.9.1. Business Overview
10.9.2. Company Snapshot
10.9.3. Company Market Share Analysis
10.9.4. Company Product Portfolio
10.9.5. Recent Developments
10.9.6. SWOT Analysis
List of Table
1. Global Stationary Emissions Control Market, By Type, 2019-2032 (USD Billion)
2. Global Corrugated Catalyst, Stationary Emissions Control Market, By Region, 2019-2032 (USD Billion)
3. Global Plate Catalyst, Stationary Emissions Control Market, By Region, 2019-2032 (USD Billion)
4. Global Honeycomb Catalyst, Stationary Emissions Control Market, By Region, 2019-2032 (USD Billion)
5. Global Stationary Emissions Control Market, By Application, 2019-2032 (USD Billion)
6. Global Industrial, Stationary Emissions Control Market, By Region, 2019-2032 (USD Billion)
7. Global Power Generation, Stationary Emissions Control Market, By Region, 2019-2032 (USD Billion)
8. Global Others, Stationary Emissions Control Market, By Region, 2019-2032 (USD Billion)
9. North America Stationary Emissions Control Market, Type, 2019-2032 (USD Billion)
10. North America Stationary Emissions Control Market, By Application, 2019-2032 (USD Billion)
11. U.S. Stationary Emissions Control Market, Type, 2019-2032 (USD Billion)
12. U.S. Stationary Emissions Control Market, By Application, 2019-2032 (USD Billion)
13. Canada Stationary Emissions Control Market, Type, 2019-2032 (USD Billion)
14. Canada Stationary Emissions Control Market, By Application, 2019-2032 (USD Billion)
15. Mexico Stationary Emissions Control Market, Type, 2019-2032 (USD Billion)
16. Mexico Stationary Emissions Control Market, By Application, 2019-2032 (USD Billion)
17. Europe Stationary Emissions Control Market, Type, 2019-2032 (USD Billion)
18. Europe Stationary Emissions Control Market, By Application, 2019-2032 (USD Billion)
19. Germany Stationary Emissions Control Market, Type, 2019-2032 (USD Billion)
20. Germany Stationary Emissions Control Market, By Application, 2019-2032 (USD Billion)
21. France Stationary Emissions Control Market, Type, 2019-2032 (USD Billion)
22. France Stationary Emissions Control Market, By Application, 2019-2032 (USD Billion)
23. U.K. Stationary Emissions Control Market, Type, 2019-2032 (USD Billion)
24. U.K. Stationary Emissions Control Market, By Application, 2019-2032 (USD Billion)
25. Italy Stationary Emissions Control Market, Type, 2019-2032 (USD Billion)
26. Italy Stationary Emissions Control Market, By Application, 2019-2032 (USD Billion)
27. Spain Stationary Emissions Control Market, Type, 2019-2032 (USD Billion)
28. Spain Stationary Emissions Control Market, By Application, 2019-2032 (USD Billion)
29. Asia Pacific Stationary Emissions Control Market, Type, 2019-2032 (USD Billion)
30. Asia Pacific Stationary Emissions Control Market, By Application, 2019-2032 (USD Billion)
31. Japan Stationary Emissions Control Market, Type, 2019-2032 (USD Billion)
32. Japan Stationary Emissions Control Market, By Application, 2019-2032 (USD Billion)
33. China Stationary Emissions Control Market, Type, 2019-2032 (USD Billion)
34. China Stationary Emissions Control Market, By Application, 2019-2032 (USD Billion)
35. India Stationary Emissions Control Market, Type, 2019-2032 (USD Billion)
36. India Stationary Emissions Control Market, By Application, 2019-2032 (USD Billion)
37. South America Stationary Emissions Control Market, Type, 2019-2032 (USD Billion)
38. South America Stationary Emissions Control Market, By Application, 2019-2032 (USD Billion)
39. Brazil Stationary Emissions Control Market, Type, 2019-2032 (USD Billion)
40. Brazil Stationary Emissions Control Market, By Application, 2019-2032 (USD Billion)
41. Middle East and Africa Stationary Emissions Control Market, Type, 2019-2032 (USD Billion)
42. Middle East and Africa Stationary Emissions Control Market, By Application, 2019-2032 (USD Billion)
43. UAE Stationary Emissions Control Market, Type, 2019-2032 (USD Billion)
44. UAE Stationary Emissions Control Market, By Application, 2019-2032 (USD Billion)
45. South Africa Stationary Emissions Control Market, Type, 2019-2032 (USD Billion)
46. South Africa Stationary Emissions Control Market, By Application, 2019-2032 (USD Billion)
List of Figures
1. Global Stationary Emissions Control Market Segmentation
2. Global Stationary Emissions Control Market: Research Methodology
3. Market Size Estimation Methodology: Bottom-Up Approach
4. Market Size Estimation Methodology: Top-Down Approach
5. Data Triangulation
6. Porter’s Five Forces Analysis
7. Value Chain Analysis
8. Global Stationary Emissions Control Market Attractiveness Analysis Type
9. Global Stationary Emissions Control Market Attractiveness Analysis By Application
10. Global Stationary Emissions Control Market Attractiveness Analysis By Region
11. Global Stationary Emissions Control Market: Dynamics
12. Global Stationary Emissions Control Market Share Type (2023 & 2032)
13. Global Stationary Emissions Control Market Share By Application (2023 & 2032)
14. Global Stationary Emissions Control Market Share By Regions (2023 & 2032)
15. Global Stationary Emissions Control Market Share By Company (2022)
This study forecasts global, regional, and country revenue from 2019 to 2032. Brainy Insights has segmented the global stationary emissions control market based on the below-mentioned segments:
Global Stationary Emissions Control Market by Type:
Global Stationary Emissions Control Market by Application:
Global Stationary Emissions Control Market by Region:
Research has its special purpose to undertake marketing efficiently. In this competitive scenario, businesses need information across all industry verticals; the information about customer wants, market demand, competition, industry trends, distribution channels etc. This information needs to be updated regularly because businesses operate in a dynamic environment. Our organization, The Brainy Insights incorporates scientific and systematic research procedures in order to get proper market insights and industry analysis for overall business success. The analysis consists of studying the market from a miniscule level wherein we implement statistical tools which helps us in examining the data with accuracy and precision.
Our research reports feature both; quantitative and qualitative aspects for any market. Qualitative information for any market research process are fundamental because they reveal the customer needs and wants, usage and consumption for any product/service related to a specific industry. This in turn aids the marketers/investors in knowing certain perceptions of the customers. Qualitative research can enlighten about the different product concepts and designs along with unique service offering that in turn, helps define marketing problems and generate opportunities. On the other hand, quantitative research engages with the data collection process through interviews, e-mail interactions, surveys and pilot studies. Quantitative aspects for the market research are useful to validate the hypotheses generated during qualitative research method, explore empirical patterns in the data with the help of statistical tools, and finally make the market estimations.
The Brainy Insights offers comprehensive research and analysis, based on a wide assortment of factual insights gained through interviews with CXOs and global experts and secondary data from reliable sources. Our analysts and industry specialist assume vital roles in building up statistical tools and analysis models, which are used to analyse the data and arrive at accurate insights with exceedingly informative research discoveries. The data provided by our organization have proven precious to a diverse range of companies, facilitating them to address issues such as determining which products/services are the most appealing, whether or not customers use the product in the manner anticipated, the purchasing intentions of the market and many others.
Our research methodology encompasses an idyllic combination of primary and secondary initiatives. Key phases involved in this process are listed below:

The phase involves the gathering and collecting of market data and its related information with the help of different sources & research procedures.

The data procurement stage involves in data gathering and collecting through various data sources.
This stage involves in extensive research. These data sources includes:
Purchased Database: Purchased databases play a crucial role in estimating the market sizes irrespective of the domain. Our purchased database includes:
Primary Research: The Brainy Insights interacts with leading companies and experts of the concerned domain to develop the analyst team’s market understanding and expertise. It improves and substantiates every single data presented in the market reports. Primary research mainly involves in telephonic interviews, E-mail interactions and face-to-face interviews with the raw material providers, manufacturers/producers, distributors, & independent consultants. The interviews that we conduct provides valuable data on market size and industry growth trends prevailing in the market. Our organization also conducts surveys with the various industry experts in order to gain overall insights of the industry/market. For instance, in healthcare industry we conduct surveys with the pharmacists, doctors, surgeons and nurses in order to gain insights and key information of a medical product/device/equipment which the customers are going to usage. Surveys are conducted in the form of questionnaire designed by our own analyst team. Surveys plays an important role in primary research because surveys helps us to identify the key target audiences of the market. Additionally, surveys helps to identify the key target audience engaged with the market. Our survey team conducts the survey by targeting the key audience, thus gaining insights from them. Based on the perspectives of the customers, this information is utilized to formulate market strategies. Moreover, market surveys helps us to understand the current competitive situation of the industry. To be precise, our survey process typically involve with the 360 analysis of the market. This analytical process begins by identifying the prospective customers for a product or service related to the market/industry to obtain data on how a product/service could fit into customers’ lives.

Secondary Research: The secondary data sources includes information published by the on-profit organizations such as World bank, WHO, company fillings, investor presentations, annual reports, national government documents, statistical databases, blogs, articles, white papers and others. From the annual report, we analyse a company’s revenue to understand the key segment and market share of that organization in a particular region. We analyse the company websites and adopt the product mapping technique which is important for deriving the segment revenue. In the product mapping method, we select and categorize the products offered by the companies catering to domain specific market, deduce the product revenue for each of the companies so as to get overall estimation of the market size. We also source data and analyses trends based on information received from supply side and demand side intermediaries in the value chain. The supply side denotes the data gathered from supplier, distributor, wholesaler and the demand side illustrates the data gathered from the end customers for respective market domain.

The supply side for a domain specific market is analysed by:
The demand side for the market is estimated through:
In-house Library: Apart from these third-party sources, we have our in-house library of qualitative and quantitative information. Our in-house database includes market data for various industry and domains. These data are updated on regular basis as per the changing market scenario. Our library includes, historic databases, internal audit reports and archives.
Sometimes there are instances where there is no metadata or raw data available for any domain specific market. For those cases, we use our expertise to forecast and estimate the market size in order to generate comprehensive data sets. Our analyst team adopt a robust research technique in order to produce the estimates:
Data Synthesis: This stage involves the analysis & mapping of all the information obtained from the previous step. It also involves in scrutinizing the data for any discrepancy observed while data gathering related to the market. The data is collected with consideration to the heterogeneity of sources. Robust scientific techniques are in place for synthesizing disparate data sets and provide the essential contextual information that can orient market strategies. The Brainy Insights has extensive experience in data synthesis where the data passes through various stages:


Market Deduction & Formulation: The final stage comprises of assigning data points at appropriate market spaces so as to deduce feasible conclusions. Analyst perspective & subject matter expert based holistic form of market sizing coupled with industry analysis also plays a crucial role in this stage.
This stage involves in finalization of the market size and numbers that we have collected from data integration step. With data interpolation, it is made sure that there is no gap in the market data. Successful trend analysis is done by our analysts using extrapolation techniques, which provide the best possible forecasts for the market.
Data Validation & Market Feedback: Validation is the most important step in the process. Validation & re-validation via an intricately designed process helps us finalize data-points to be used for final calculations.

The Brainy Insights interacts with leading companies and experts of the concerned domain to develop the analyst team’s market understanding and expertise. It improves and substantiates every single data presented in the market reports. The data validation interview and discussion panels are typically composed of the most experienced industry members. The participants include, however, are not limited to:
Moreover, we always validate our data and findings through primary respondents from all the major regions we are working on.


Free Customization
Fortune 500 Clients
Free Yearly Update On Purchase Of Multi/Corporate License
Companies Served Till Date