- +1-315-215-1633
- sales@thebrainyinsights.com

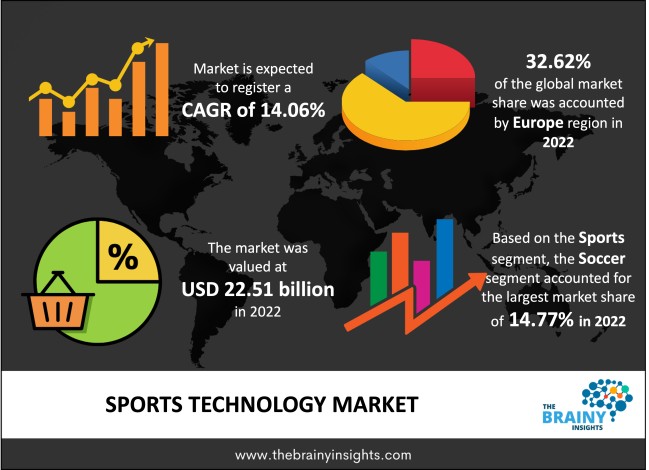
The global sports technology market was valued at USD 22.51 billion in 2022, which is anticipated to grow at a CAGR of 14.06% from 2023 to 2032. The expansion can be associated with the growing demand for technology-based services in the sports industry, driven by a strong emphasis on audience participation and entertainment activities and the digital transformation of arenas and stadiums. The market is anticipated to expand considerably during the forecast period as the number of sporting events and the demand for data-driven decision-making and operations rises. The rising use of social media, the Internet of Things (IoT), and data analytics is also helping the market to grow.
High-end exercise equipment has developed the ability to track steps, monitor heart rates, and even transmit ECG readings over Bluetooth because of advancements in sports science technology. Manufacturers constantly push product development to meet consumer demand and new fashion trends. As technology and data play a significant part in enhancing player development and athletic performance, the commercial sports industry has seen a rise in gross income. The focus on audience participation and entertainment-related activities, along with technological developments in venues and stadiums, are predicted to be the main drivers of the growing demand for technology-based services in sporting events. Sports event organizers have also invested in digital technologies to offer an unmatched game-viewing experience in stadiums and on electronic devices. The market for sports technology is also expected to grow as more sports use artificial intelligence (AI), data analytics, the Internet of Things (IoT), wearable technology, drones, and social media participation. Sports technology has been significantly incorporated into outdoor sports, including rugby, football, and soccer. Games dominate the sports technology business in terms of revenue. Indoor sports activities are also a significant contributor to the market because of the rise in the use of sports technology in activities like badminton, chess, and swimming. Sports technology adoption in indoor sports remains slower than in outdoor sports. The primary focus of the sports technology department is developing new applications and technologies to support research and formulating intervention techniques to enhance athletic performance. In recent years, sports technology and data have taken a vital role in the development and performance of athletes. The financial side of sports is expanding due to the significant role that technology and data have in enhancing player development and athletic performances. The increased interest in sports among participants and spectators worldwide is fueling a rapid expansion of the global sports technology market. The need for technology in the sports sector is expected to be fueled by a significant emphasis on audience engagement and entertainment activities and the digital transformation of arenas and stadiums. The sports technology business has improved due to increasing investments made by numerous organizations in integrating cutting-edge technology for tracking athletes' performances and communicating with fans.
Get an overview of this study by requesting a free sample
Effort towards entertaining and involving stadium audience- The goal of digital technologies investment by sports event planners is to produce a fantastic game-viewing experience in stadiums and digital devices. Stadium owners are installing and equipping a range of technology to improve the fan experience inside stadiums, including high-density Wi-Fi, location-based services, digital kiosks, 360-degree ultra-high definition (UHD) cameras, and digital signs.
Budgetary restrictions and substantial initial costs- Technology for sports is costly. To make a stadium smart, stadium operators must make significant investments. Millions of dollars are needed for a typical stadium to be renovated and to adopt cutting-edge technology. Stadium operators hesitate to make significant investments due to the rarely occurring and unpredictable engagement. The location of a stadium, such as in industrial districts, enterprise zones, or economically deprived areas, and event hosting compatibilities, can be responsible for the low frequency of events. The teams that would participate in the event, estimated attendance, and returns are other factors that stadium operators need to consider before making such investments.
AR and VR are becoming increasingly popular in sports- Various stadiums are implementing AR and VR to improve the fan and player experience, sports broadcasts, interactive advertising, etc.
Difficulties in replacing and upgrading old systems- Sports technologies incorporate a variety of hardware, software, and network components, some of which can be challenging to set up. Combining automation software with various hardware, such as proximity sensors, smart metres, smart thermostats, relays, network switches, gateways, and actuators, over traditional infrastructure, can be challenging. In addition, protocol problems prevent these systems from integrating with newer generations of smart devices. Therefore, outdated systems cannot effectively communicate with technologically modern systems. In the upcoming years, the expansion of the market is anticipated to be hampered by integration difficulties.
The regions analyzed for the market include North America, Europe, South America, Asia Pacific, the Middle East, and Africa. Europe emerged as the most significant global sports technology market, with a 36.62% market revenue share in 2022. The existence of numerous sports leagues, such as the Premier League, English Football League, and La Liga, has been responsible. Additionally, the rising level of cooperation among important regional companies is improving the outlook for the market.
Europe Region Sports Technology Market Share in 2022 - 32.62%
www.thebrainyinsights.com
Check the geographical analysis of this market by requesting a free sample
The sports segment is divided into baseball, cricket, ice hockey, soccer, american football/rugby, golf, basketball, tennis, and others. The soccer segment dominated, with a market share of around 14.77% in 2022. Sports technology is crucial in soccer to make educated decisions and acquire practical insights about a player's fitness. The Video Assistant Referee (VAR) system first appeared at the FIFA World Cup in 2022 to assist on-field officials with critical match decisions. To help on-field officials and video match officials make more accurate offside rulings, FIFA World Cup 2022 witnessed the introduction of Semi-Automated Offside Technology (SAOT). Throughout the projection period, this is anticipated to fuel market expansion.
The type segment is divided into smart stadium, e-sports, devices, and analytics & statistics. The smart stadium segment dominated the market, with a market share of around 27.39% in 2022. It is because these smart venues are becoming more and more popular. After all, they offer owners and visitors various advantages, including ticket management, seat upgrades, crowd control, closet bathroom lines, social media updates, Wi-Fi, food ordering, merchandise sales, smart lighting, integrated security systems, and emergency response management. Several stadiums are being transformed into smart stadiums to provide a comprehensive experience around the event. These stadiums will include a range of aspects like operational efficiency, improved security, and smart parking.
The end-user segment is divided into sports associations, sports clubs, sports leagues, and others. The sports leagues segment dominated the market, with a market share of around 28.24% in 2022. It is because prominent leagues use more technical tools to help with accurate decision-making and better fan experiences. For instance, some of the often utilized technology in football includes semi-automated offside technology, goal-line technology, and video assistant referee.
| Attribute | Description |
|---|---|
| Market Size | Revenue (USD Billion) |
| Market size value in 2022 | USD 22.51 Billion |
| Market size value in 2032 | USD 83.88 Billion |
| CAGR (2023 to 2032) | 14.06% |
| Historical data | 2019-2021 |
| Base Year | 2022 |
| Forecast | 2023-2032 |
| Region | The regions analyzed for the market are Asia Pacific, Europe, South America, North America, and Middle East & Africa. Furthermore, the regions are further analyzed at the country level. |
| Segments | Sports, Type, End-user |
As per The Brainy Insights, the size of the sports technology market was valued at USD 22.51 Billion in 2022 & USD 83.88 Billion by 2032.
Global sports technology market is growing at a CAGR of 14.06% during the forecast period 2023-2032.
Europe region emerged as the largest market for the sports technology.
Effort towards entertaining and involving stadium audience is a significant driving factor for the growth of the sports technology market.
Budgetary restrictions and substantial initial costs is a significant restraining factor for the growth of the sports technology market.
AR and VR are becoming increasingly popular in sports is a significant opportunity for the growth of the sports technology market.
Difficulties in replacing and upgrading old systems is a significant challenge for the growth of the sports technology market.
1. Introduction
1.1. Objective of the Study
1.2. Market Definition
1.3. Research Scope
1.4. Currency
1.5. Key Target Audience
2. Research Methodology and Assumptions
3. Executive Summary
4. Premium Insights
4.1. Porter’s Five Forces Analysis
4.2. Value Chain Analysis
4.3. Top Investment Pockets
4.3.1. Market Attractiveness Analysis By Sports
4.3.2. Market Attractiveness Analysis By Type
4.3.3. Market Attractiveness Analysis By End-user
4.3.4. Market Attractiveness Analysis By Region
4.4. Industry Trends
5. Market Dynamics
5.1. Market Evaluation
5.2. Drivers
5.2.1. Effort towards entertaining and involving stadium audience
5.3. Restraints
5.3.1. Budgetary restrictions and substantial initial costs
5.4. Opportunities
5.4.1. AR and VR are becoming increasingly popular in sports
5.5. Challenges
5.5.1. Difficulties in replacing and upgrading old systems
6. Global Sports Technology Market Analysis and Forecast, By Sports
6.1. Segment Overview
6.2. Baseball
6.3. Cricket
6.4. Ice Hockey
6.5. Soccer
6.6. American Football/Rugby
6.7. Golf
6.8. Basketball
6.9. Tennis
6.10. Others
7. Global Sports Technology Market Analysis and Forecast, By Type
7.1. Segment Overview
7.2. Smart Stadium
7.3. E-sports
7.4. Devices
7.5. Analytics & Statistics
8. Global Sports Technology Market Analysis and Forecast, By End-user
8.1. Segment Overview
8.2. Sports Associations
8.3. Sports Clubs
8.4. Sports Leagues
8.5. Others
9. Global Sports Technology Market Analysis and Forecast, By Regional Analysis
9.1. Segment Overview
9.2. North America
9.2.1. U.S.
9.2.2. Canada
9.2.3. Mexico
9.3. Europe
9.3.1. Germany
9.3.2. France
9.3.3. U.K.
9.3.4. Italy
9.3.5. Spain
9.4. Asia-Pacific
9.4.1. Japan
9.4.2. China
9.4.3. India
9.5. South America
9.5.1. Brazil
9.6. Middle East and Africa
9.6.1. UAE
9.6.2. South Africa
10. Global Sports Technology Market-Competitive Landscape
10.1. Overview
10.2. Market Share of Key Players in the Sports Technology Market
10.2.1. Global Company Market Share
10.2.2. North America Company Market Share
10.2.3. Europe Company Market Share
10.2.4. APAC Company Market Share
10.3. Competitive Situations and Trends
10.3.1. Product Launches and Developments
10.3.2. Partnerships, Collaborations, and Agreements
10.3.3. Mergers & Acquisitions
10.3.4. Expansions
11. Company Profiles
11.1. Catapult Group
11.1.1. Business Overview
11.1.2. Company Snapshot
11.1.3. Company Market Share Analysis
11.1.4. Company Product Portfolio
11.1.5. Recent Developments
11.1.6. SWOT Analysis
11.2. Cisco Systems, Inc.
11.2.1. Business Overview
11.2.2. Company Snapshot
11.2.3. Company Market Share Analysis
11.2.4. Company Product Portfolio
11.2.5. Recent Developments
11.2.6. SWOT Analysis
11.3. IBM Corporation
11.3.1. Business Overview
11.3.2. Company Snapshot
11.3.3. Company Market Share Analysis
11.3.4. Company Product Portfolio
11.3.5. Recent Developments
11.3.6. SWOT Analysis
11.4. Modern Times Group MTG
11.4.1. Business Overview
11.4.2. Company Snapshot
11.4.3. Company Market Share Analysis
11.4.4. Company Product Portfolio
11.4.5. Recent Developments
11.4.6. SWOT Analysis
11.5. Panasonic Corporation
11.5.1. Business Overview
11.5.2. Company Snapshot
11.5.3. Company Market Share Analysis
11.5.4. Company Product Portfolio
11.5.5. Recent Developments
11.5.6. SWOT Analysis
11.6. Sony Corporation
11.6.1. Business Overview
11.6.2. Company Snapshot
11.6.3. Company Market Share Analysis
11.6.4. Company Product Portfolio
11.6.5. Recent Developments
11.6.6. SWOT Analysis
11.7. Telefonaktiebolaget LM Ericsson
11.7.1. Business Overview
11.7.2. Company Snapshot
11.7.3. Company Market Share Analysis
11.7.4. Company Product Portfolio
11.7.5. Recent Developments
11.7.6. SWOT Analysis
11.8. DELTATRE
11.8.1. Business Overview
11.8.2. Company Snapshot
11.8.3. Company Market Share Analysis
11.8.4. Company Product Portfolio
11.8.5. Recent Developments
11.8.6. SWOT Analysis
11.9. Genius Sports Group
11.9.1. Business Overview
11.9.2. Company Snapshot
11.9.3. Company Market Share Analysis
11.9.4. Company Product Portfolio
11.9.5. Recent Developments
11.9.6. SWOT Analysis
11.10. SAS Institute Inc.
11.10.1. Business Overview
11.10.2. Company Snapshot
11.10.3. Company Market Share Analysis
11.10.4. Company Product Portfolio
11.10.5. Recent Developments
11.10.6. SWOT Analysis
11.11. Synergy Sports
11.11.1. Business Overview
11.11.2. Company Snapshot
11.11.3. Company Market Share Analysis
11.11.4. Company Product Portfolio
11.11.5. Recent Developments
11.11.6. SWOT Analysis
11.12. Draft Kings, Inc
11.12.1. Business Overview
11.12.2. Company Snapshot
11.12.3. Company Market Share Analysis
11.12.4. Company Product Portfolio
11.12.5. Recent Developments
11.12.6. SWOT Analysis
11.13. Dream Sports Group
11.13.1. Business Overview
11.13.2. Company Snapshot
11.13.3. Company Market Share Analysis
11.13.4. Company Product Portfolio
11.13.5. Recent Developments
11.13.6. SWOT Analysis
11.14. Apple Inc.
11.14.1. Business Overview
11.14.2. Company Snapshot
11.14.3. Company Market Share Analysis
11.14.4. Company Product Portfolio
11.14.5. Recent Developments
11.14.6. SWOT Analysis
11.15. HCL Technologies Limited
11.15.1. Business Overview
11.15.2. Company Snapshot
11.15.3. Company Market Share Analysis
11.15.4. Company Product Portfolio
11.15.5. Recent Developments
11.15.6. SWOT Analysis
List of Table
1. Global Sports Technology Market, By Sports, 2019-2032 (USD Billion)
2. Global Baseball, Sports Technology Market, By Region, 2019-2032 (USD Billion)
3. Global Cricket, Sports Technology Market, By Region, 2019-2032 (USD Billion)
4. Global Ice Hockey, Sports Technology Market, By Region, 2019-2032 (USD Billion)
5. Global Soccer, Sports Technology Market, By Region, 2019-2032 (USD Billion)
6. Global American Football/Rugby, Sports Technology Market, By Region, 2019-2032 (USD Billion)
7. Global Golf, Sports Technology Market, By Region, 2019-2032 (USD Billion)
8. Global Basketball, Sports Technology Market, By Region, 2019-2032 (USD Billion)
9. Global Tennis, Sports Technology Market, By Region, 2019-2032 (USD Billion)
10. Global Others, Sports Technology Market, By Region, 2019-2032 (USD Billion)
11. Global Sports Technology Market, By Type, 2019-2032 (USD Billion)
12. Global Smart Stadium, Sports Technology Market, By Region, 2019-2032 (USD Billion)
13. Global E-sports, Sports Technology Market, By Region, 2019-2032 (USD Billion)
14. Global Devices, Sports Technology Market, By Region, 2019-2032 (USD Billion)
15. Global Analytics & Statistics, Sports Technology Market, By Region, 2019-2032 (USD Billion)
16. Global Sports Technology Market, By End-user, 2019-2032 (USD Billion)
17. Global Sports Associations, Sports Technology Market, By Region, 2019-2032 (USD Billion)
18. Global Sports Clubs, Sports Technology Market, By Region, 2019-2032 (USD Billion)
19. Global Sports Leagues, Sports Technology Market, By Region, 2019-2032 (USD Billion)
20. Global Others, Sports Technology Market, By Region, 2019-2032 (USD Billion)
21. Global Sports Technology Market, By Region, 2019-2032 (USD Billion)
22. North America Sports Technology Market, By Sports, 2019-2032 (USD Billion)
23. North America Sports Technology Market, By Type, 2019-2032 (USD Billion)
24. North America Sports Technology Market, By End-user, 2019-2032 (USD Billion)
25. U.S. Sports Technology Market, By Sports, 2019-2032 (USD Billion)
26. U.S. Sports Technology Market, By Type, 2019-2032 (USD Billion)
27. U.S. Sports Technology Market, By End-user, 2019-2032 (USD Billion)
28. Canada Sports Technology Market, By Sports, 2019-2032 (USD Billion)
29. Canada Sports Technology Market, By Type, 2019-2032 (USD Billion)
30. Canada Sports Technology Market, By End-user, 2019-2032 (USD Billion)
31. Mexico Sports Technology Market, By Sports, 2019-2032 (USD Billion)
32. Mexico Sports Technology Market, By Type, 2019-2032 (USD Billion)
33. Mexico Sports Technology Market, By End-user, 2019-2032 (USD Billion)
34. Europe Sports Technology Market, By Sports, 2019-2032 (USD Billion)
35. Europe Sports Technology Market, By Type, 2019-2032 (USD Billion)
36. Europe Sports Technology Market, By End-user, 2019-2032 (USD Billion)
37. Germany Sports Technology Market, By Sports, 2019-2032 (USD Billion)
38. Germany Sports Technology Market, By Type, 2019-2032 (USD Billion)
39. Germany Sports Technology Market, By End-user, 2019-2032 (USD Billion)
40. France Sports Technology Market, By Sports, 2019-2032 (USD Billion)
41. France Sports Technology Market, By Type, 2019-2032 (USD Billion)
42. France Sports Technology Market, By End-user, 2019-2032 (USD Billion)
43. U.K. Sports Technology Market, By Sports, 2019-2032 (USD Billion)
44. U.K. Sports Technology Market, By Type, 2019-2032 (USD Billion)
45. U.K. Sports Technology Market, By End-user, 2019-2032 (USD Billion)
46. Italy Sports Technology Market, By Sports, 2019-2032 (USD Billion)
47. Italy Sports Technology Market, By Type, 2019-2032 (USD Billion)
48. Italy Sports Technology Market, By End-user, 2019-2032 (USD Billion)
49. Spain Sports Technology Market, By Sports, 2019-2032 (USD Billion)
50. Spain Sports Technology Market, By Type, 2019-2032 (USD Billion)
51. Spain Sports Technology Market, By End-user, 2019-2032 (USD Billion)
52. Asia Pacific Sports Technology Market, By Sports, 2019-2032 (USD Billion)
53. Asia Pacific Sports Technology Market, By Type, 2019-2032 (USD Billion)
54. Asia Pacific Sports Technology Market, By End-user, 2019-2032 (USD Billion)
55. Japan Sports Technology Market, By Sports, 2019-2032 (USD Billion)
56. Japan Sports Technology Market, By Type, 2019-2032 (USD Billion)
57. Japan Sports Technology Market, By End-user, 2019-2032 (USD Billion)
58. China Sports Technology Market, By Sports, 2019-2032 (USD Billion)
59. China Sports Technology Market, By Type, 2019-2032 (USD Billion)
60. China Sports Technology Market, By End-user, 2019-2032 (USD Billion)
61. India Sports Technology Market, By Sports, 2019-2032 (USD Billion)
62. India Sports Technology Market, By Type, 2019-2032 (USD Billion)
63. India Sports Technology Market, By End-user, 2019-2032 (USD Billion)
64. South America Sports Technology Market, By Sports, 2019-2032 (USD Billion)
65. South America Sports Technology Market, By Type, 2019-2032 (USD Billion)
66. South America Sports Technology Market, By End-user, 2019-2032 (USD Billion)
67. Brazil Sports Technology Market, By Sports, 2019-2032 (USD Billion)
68. Brazil Sports Technology Market, By Type, 2019-2032 (USD Billion)
69. Brazil Sports Technology Market, By End-user, 2019-2032 (USD Billion)
70. Middle East and Africa Sports Technology Market, By Sports, 2019-2032 (USD Billion)
71. Middle East and Africa Sports Technology Market, By Type, 2019-2032 (USD Billion)
72. Middle East and Africa Sports Technology Market, By End-user, 2019-2032 (USD Billion)
73. UAE Sports Technology Market, By Sports, 2019-2032 (USD Billion)
74. UAE Sports Technology Market, By Type, 2019-2032 (USD Billion)
75. UAE Sports Technology Market, By End-user, 2019-2032 (USD Billion)
76. South Africa Sports Technology Market, By Sports, 2019-2032 (USD Billion)
77. South Africa Sports Technology Market, By Type, 2019-2032 (USD Billion)
78. South Africa Sports Technology Market, By End-user, 2019-2032 (USD Billion)
List of Figures
1. Global Sports Technology Market Segmentation
2. Sports Technology Market: Research Methodology
3. Market Size Estimation Methodology: Bottom-Up Approach
4. Market Size Estimation Methodology: Top-Down Approach
5. Data Triangulation
6. Porter’s Five Forces Analysis
7. Value Chain Analysis
8. Global Sports Technology Market Attractiveness Analysis By Sports
9. Global Sports Technology Market Attractiveness Analysis By Type
10. Global Sports Technology Market Attractiveness Analysis By End-user
11. Global Sports Technology Market Attractiveness Analysis By Region
12. Global Sports Technology Market: Dynamics
13. Global Sports Technology Market Share by Sports (2023 & 2032)
14. Global Sports Technology Market Share by Type (2023 & 2032)
15. Global Sports Technology Market Share by End-user (2023 & 2032)
16. Global Sports Technology Market Share by Regions (2023 & 2032)
17. Global Sports Technology Market Share by Company (2022)
This study forecasts revenue at global, regional, and country levels from 2019 to 2032. The Brainy Insights has segmented the global sports technology market based on below mentioned segments:
Global Sports Technology by Sports:
Global Sports Technology by Type:
Global Sports Technology by End-user:
Global Sports Technology by Region:
Research has its special purpose to undertake marketing efficiently. In this competitive scenario, businesses need information across all industry verticals; the information about customer wants, market demand, competition, industry trends, distribution channels etc. This information needs to be updated regularly because businesses operate in a dynamic environment. Our organization, The Brainy Insights incorporates scientific and systematic research procedures in order to get proper market insights and industry analysis for overall business success. The analysis consists of studying the market from a miniscule level wherein we implement statistical tools which helps us in examining the data with accuracy and precision.
Our research reports feature both; quantitative and qualitative aspects for any market. Qualitative information for any market research process are fundamental because they reveal the customer needs and wants, usage and consumption for any product/service related to a specific industry. This in turn aids the marketers/investors in knowing certain perceptions of the customers. Qualitative research can enlighten about the different product concepts and designs along with unique service offering that in turn, helps define marketing problems and generate opportunities. On the other hand, quantitative research engages with the data collection process through interviews, e-mail interactions, surveys and pilot studies. Quantitative aspects for the market research are useful to validate the hypotheses generated during qualitative research method, explore empirical patterns in the data with the help of statistical tools, and finally make the market estimations.
The Brainy Insights offers comprehensive research and analysis, based on a wide assortment of factual insights gained through interviews with CXOs and global experts and secondary data from reliable sources. Our analysts and industry specialist assume vital roles in building up statistical tools and analysis models, which are used to analyse the data and arrive at accurate insights with exceedingly informative research discoveries. The data provided by our organization have proven precious to a diverse range of companies, facilitating them to address issues such as determining which products/services are the most appealing, whether or not customers use the product in the manner anticipated, the purchasing intentions of the market and many others.
Our research methodology encompasses an idyllic combination of primary and secondary initiatives. Key phases involved in this process are listed below:

The phase involves the gathering and collecting of market data and its related information with the help of different sources & research procedures.

The data procurement stage involves in data gathering and collecting through various data sources.
This stage involves in extensive research. These data sources includes:
Purchased Database: Purchased databases play a crucial role in estimating the market sizes irrespective of the domain. Our purchased database includes:
Primary Research: The Brainy Insights interacts with leading companies and experts of the concerned domain to develop the analyst team’s market understanding and expertise. It improves and substantiates every single data presented in the market reports. Primary research mainly involves in telephonic interviews, E-mail interactions and face-to-face interviews with the raw material providers, manufacturers/producers, distributors, & independent consultants. The interviews that we conduct provides valuable data on market size and industry growth trends prevailing in the market. Our organization also conducts surveys with the various industry experts in order to gain overall insights of the industry/market. For instance, in healthcare industry we conduct surveys with the pharmacists, doctors, surgeons and nurses in order to gain insights and key information of a medical product/device/equipment which the customers are going to usage. Surveys are conducted in the form of questionnaire designed by our own analyst team. Surveys plays an important role in primary research because surveys helps us to identify the key target audiences of the market. Additionally, surveys helps to identify the key target audience engaged with the market. Our survey team conducts the survey by targeting the key audience, thus gaining insights from them. Based on the perspectives of the customers, this information is utilized to formulate market strategies. Moreover, market surveys helps us to understand the current competitive situation of the industry. To be precise, our survey process typically involve with the 360 analysis of the market. This analytical process begins by identifying the prospective customers for a product or service related to the market/industry to obtain data on how a product/service could fit into customers’ lives.

Secondary Research: The secondary data sources includes information published by the on-profit organizations such as World bank, WHO, company fillings, investor presentations, annual reports, national government documents, statistical databases, blogs, articles, white papers and others. From the annual report, we analyse a company’s revenue to understand the key segment and market share of that organization in a particular region. We analyse the company websites and adopt the product mapping technique which is important for deriving the segment revenue. In the product mapping method, we select and categorize the products offered by the companies catering to domain specific market, deduce the product revenue for each of the companies so as to get overall estimation of the market size. We also source data and analyses trends based on information received from supply side and demand side intermediaries in the value chain. The supply side denotes the data gathered from supplier, distributor, wholesaler and the demand side illustrates the data gathered from the end customers for respective market domain.

The supply side for a domain specific market is analysed by:
The demand side for the market is estimated through:
In-house Library: Apart from these third-party sources, we have our in-house library of qualitative and quantitative information. Our in-house database includes market data for various industry and domains. These data are updated on regular basis as per the changing market scenario. Our library includes, historic databases, internal audit reports and archives.
Sometimes there are instances where there is no metadata or raw data available for any domain specific market. For those cases, we use our expertise to forecast and estimate the market size in order to generate comprehensive data sets. Our analyst team adopt a robust research technique in order to produce the estimates:
Data Synthesis: This stage involves the analysis & mapping of all the information obtained from the previous step. It also involves in scrutinizing the data for any discrepancy observed while data gathering related to the market. The data is collected with consideration to the heterogeneity of sources. Robust scientific techniques are in place for synthesizing disparate data sets and provide the essential contextual information that can orient market strategies. The Brainy Insights has extensive experience in data synthesis where the data passes through various stages:


Market Deduction & Formulation: The final stage comprises of assigning data points at appropriate market spaces so as to deduce feasible conclusions. Analyst perspective & subject matter expert based holistic form of market sizing coupled with industry analysis also plays a crucial role in this stage.
This stage involves in finalization of the market size and numbers that we have collected from data integration step. With data interpolation, it is made sure that there is no gap in the market data. Successful trend analysis is done by our analysts using extrapolation techniques, which provide the best possible forecasts for the market.
Data Validation & Market Feedback: Validation is the most important step in the process. Validation & re-validation via an intricately designed process helps us finalize data-points to be used for final calculations.

The Brainy Insights interacts with leading companies and experts of the concerned domain to develop the analyst team’s market understanding and expertise. It improves and substantiates every single data presented in the market reports. The data validation interview and discussion panels are typically composed of the most experienced industry members. The participants include, however, are not limited to:
Moreover, we always validate our data and findings through primary respondents from all the major regions we are working on.


Free Customization
Fortune 500 Clients
Free Yearly Update On Purchase Of Multi/Corporate License
Companies Served Till Date