- +1-315-215-1633
- sales@thebrainyinsights.com

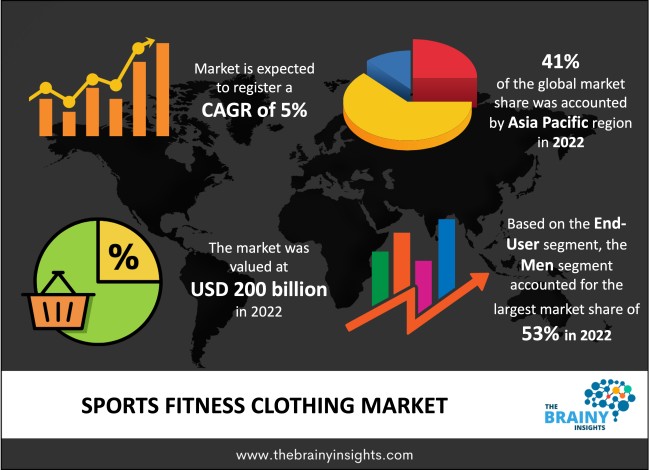
The global sports fitness clothing market was valued at USD 200 billion in 2022 and grew at a CAGR of 5% from 2023 to 2032. The market is expected to reach USD 325.77 billion by 2032. The growing adoption of an active lifestyle will drive the growth of the global sports fitness clothing market.
Sports fitness clothing is specialized garments and accessories for various sports and physical activities. Improving performance and providing comfort are primarily made to help athletes and fitness enthusiasts. Common sportswear includes tracksuits, shorts, T-shirts, and polo shirts. Specialized gear includes leotards, ski suits, swimsuits and wet suits. Ideal sports fitness gear has the following characteristics: strength, stretchability, elastic recovery, abrasion resistance, tear resistance, colour fading, body odour resistance, and UV resistance. The degree to which these qualities are utilized will depend on the sport or fitness activity. Sports and fitness apparel is preferred for quick drying, temperature management, good air and water permeability, moisture wicking, and quick absorption capabilities. Wearing the appropriate clothing decreases the likelihood of getting wounded, boosts confidence, improves performance, and speeds up recovery. The right sports clothing improves performance and may help prevent injuries and speed up recovery between workouts. , the correct clothing also aids in improving blood flow By boosting compression, reducing lactic acid accumulation, and wicking away sweat. Sweat-wicking fabric is used to construct sports gear to keep players dry and comfortable. Nylon, polyester, and other materials are used to make sportswear.
Get an overview of this study by requesting a free sample
The rising adoption of an active lifestyle – The increasing incidence of lifestyle diseases has shifted consumer preferences towards healthy and regular exercising for longevity and overall physical and mental wellbeing. Social media fitness influencers are also crucial in increasing the adoption of an active lifestyle, regular gym, yoga, outdoor sports and other fitness activities. Introducing fitness centres, gyms, yoga studios, and sports clubs in tier-2 and 3 cities has also helped the rising adoption of fitness or an active lifestyle. Furthermore, the introduction of accessible and affordable clothing offered by multiple brands giving consumers a wide variety of choices is augmenting the market's growth. The increasing use of online shopping has also significantly driven the sales of sports Times clothing. The introduction of athleisure, an amalgamation of athletic and leisure wear, has expanded the consumer market given the comfortable yet aesthetic appearance these clothes enable. Fashion influencers are incorporating athleisure in their wardrobes, thereby driving the sales of these clothing articles and contributing to the market’s growth.
Fluctuating raw material prices – global geopolitical uncertainties or health events lead to supply chain disruptions. The production, transportation and processing are all affected by uncertainties, leading to supply shortages and cost increases. Therefore, fluctuating raw material prices can potentially negatively impact the market’s growth.
The introduction of innovative clothing materials – sports, especially outdoor sports, are physically enduring tasks, and appropriate clothes must be worn to improve performance, comfort and functionality. Constant research and development have led to innovative clothing like apparel with anti-microbial quick drying capability. Moisture-wicking fabrics with temperature regulation technology are a few other examples of innovation in sports fitness clothing. Compression technology is another example that has gained significant popularity in the fitness industry. Similar innovations that enhance athletes' performance have contributed to increasing research and development to improve such technologies. Therefore, the increasing innovations in sports fitness clothing will bode well for the market's growth.
The regions analyzed for the market include North America, Europe, South America, Asia Pacific, the Middle East, and Africa. Asia Pacific emerged as the largest market for the global sports fitness clothing market, with a 41% share of the market revenue in 2022.
The populations of India and China combined form a significant proportion of the global population, thereby driving the consumer demand for clothing. Furthermore, the region's young demographic will drive the demand for sports clothing as more and more individuals are adopting an active lifestyle to stay healthy in the increasingly stressful work environment. The presence of significant market players with an extensive distribution chain reaching tier-1 and 2 cities will also bode well for the market. Home-grown brands have also gained traction recently, and the proliferation of social media, especially fitness and fashion influencers, is driving the sales for these brands.
Asia Pacific Region Sports Fitness Clothing Market Share in 2022 - 41%
www.thebrainyinsights.com
Check the geographical analysis of this market by requesting a free sample
The end-user segment is divided into men, women and children. The men segment dominated the market, with a market share of around 53% in 2022. Societal roles and other deep-rooted traditional and irrational beliefs have left women to do house chores. Women working out and playing sports was not a norm until recently. However, despite introducing the women's category and breaking societal stereotypes, the proportion of men in sports is far more than that of women. Furthermore, the number of men hitting the gym or adopting new sports is much more than that of women, contributing to their dominance in the segment.
The distribution channel segment is divided into online and offline. The offline segment dominated the market, with a share of around 56% in 2022. The offline section includes supermarkets, hypermarkets, speciality shops, department stores, and other store-based distribution channels. These shops are favoured over internet retailers because they let customers visually examine the products, try them on, and get help if necessary. They provide a wide choice of brands and prices to suit every customer's budget, wants, and preferences. They are trusted, real merchants selling authentic goods that provide customers peace of mind. Leading market companies have a vast global network of stores, which fuels the segment's expansion.
| Attribute | Description |
|---|---|
| Market Size | Revenue (USD Billion) |
| Market size value in 2022 | USD 200 Billion |
| Market size value in 2032 | USD 325.77 Billion |
| CAGR (2023 to 2032) | 5% |
| Historical data | 2019-2021 |
| Base Year | 2022 |
| Forecast | 2023-2032 |
| Region | The regions analyzed for the market are Asia Pacific, Europe, South America, North America, the Middle East and Africa. Furthermore, the regions are further analyzed at the country level. |
| Segments | End User and Distribution Channel |
As per The Brainy Insights, the size of the global sports fitness clothing market was valued at USD 200 billion in 2022 to USD 325.77 billion by 2032.
Global sports fitness clothing market is growing at a CAGR of 5% during the forecast period 2023-2032.
The market's growth will be influenced by the rising adoption of active lifestyle.
Fluctuating raw material prices could hamper the market growth.
1. Introduction
1.1. Objectives of the Study
1.2. Market Definition
1.3. Research Scope
1.4. Currency
1.5. Key Target Audience
2. Research Methodology and Assumptions
3. Executive Summary
4. Premium Insights
4.1. Porter’s Five Forces Analysis
4.2. Value Chain Analysis
4.3. Top Investment Pockets
4.3.1. Market Attractiveness Analysis By End User
4.3.2. Market Attractiveness Analysis By Distribution Channel
4.3.3. Market Attractiveness Analysis By Region
4.4. Industry Trends
5. Market Dynamics
5.1. Market Evaluation
5.2. Drivers
5.2.1. The rising adoption of active lifestyle
5.3. Restraints
5.3.1. Fluctuating raw material prices
5.4. Opportunities
5.4.1. The introduction of innovative clothing materials
5.5. Challenges
5.5.1. Highly fragmented market
6. Global Sports Fitness Clothing Market Analysis and Forecast, By End User
6.1. Segment Overview
6.2. Men
6.3. Women
6.4. Children
7. Global Sports Fitness Clothing Market Analysis and Forecast, By Distribution Channel
7.1. Segment Overview
7.2. Online
7.3. Offline
8. Global Sports Fitness Clothing Market Analysis and Forecast, By Regional Analysis
8.1. Segment Overview
8.2. North America
8.2.1. U.S.
8.2.2. Canada
8.2.3. Mexico
8.3. Europe
8.3.1. Germany
8.3.2. France
8.3.3. U.K.
8.3.4. Italy
8.3.5. Spain
8.4. Asia-Pacific
8.4.1. Japan
8.4.2. China
8.4.3. India
8.5. South America
8.5.1. Brazil
8.6. Middle East and Africa
8.6.1. UAE
8.6.2. South Africa
9. Global Sports Fitness Clothing Market-Competitive Landscape
9.1. Overview
9.2. Market Share of Key Players in the Sports Fitness Clothing Market
9.2.1. Global Company Market Share
9.2.2. North America Company Market Share
9.2.3. Europe Company Market Share
9.2.4. APAC Company Market Share
9.3. Competitive Situations and Trends
9.3.1. Product Launches and Developments
9.3.2. Partnerships, Collaborations, and Agreements
9.3.3. Mergers & Acquisitions
9.3.4. Expansions
10. Company Profiles
10.1. Adidas AG
10.1.1. Business Overview
10.1.2. Company Snapshot
10.1.3. Company Market Share Analysis
10.1.4. Company Product Portfolio
10.1.5. Recent Developments
10.1.6. SWOT Analysis
10.2. Columbia Sportswear Company
10.2.1. Business Overview
10.2.2. Company Snapshot
10.2.3. Company Market Share Analysis
10.2.4. Company Product Portfolio
10.2.5. Recent Developments
10.2.6. SWOT Analysis
10.3. Fila Holdings Corp.
10.3.1. Business Overview
10.3.2. Company Snapshot
10.3.3. Company Market Share Analysis
10.3.4. Company Product Portfolio
10.3.5. Recent Developments
10.3.6. SWOT Analysis
10.4. Iconix International
10.4.1. Business Overview
10.4.2. Company Snapshot
10.4.3. Company Market Share Analysis
10.4.4. Company Product Portfolio
10.4.5. Recent Developments
10.4.6. SWOT Analysis
10.5. lululemon
10.5.1. Business Overview
10.5.2. Company Snapshot
10.5.3. Company Market Share Analysis
10.5.4. Company Product Portfolio
10.5.5. Recent Developments
10.5.6. SWOT Analysis
10.6. New Balance Athletics, Inc.
10.6.1. Business Overview
10.6.2. Company Snapshot
10.6.3. Company Market Share Analysis
10.6.4. Company Product Portfolio
10.6.5. Recent Developments
10.6.6. SWOT Analysis
10.7. Nike, Inc.
10.7.1. Business Overview
10.7.2. Company Snapshot
10.7.3. Company Market Share Analysis
10.7.4. Company Product Portfolio
10.7.5. Recent Developments
10.7.6. SWOT Analysis
10.8. Puma SE
10.8.1. Business Overview
10.8.2. Company Snapshot
10.8.3. Company Market Share Analysis
10.8.4. Company Product Portfolio
10.8.5. Recent Developments
10.8.6. SWOT Analysis
10.9. Ralph Lauren Corporation
10.9.1. Business Overview
10.9.2. Company Snapshot
10.9.3. Company Market Share Analysis
10.9.4. Company Product Portfolio
10.9.5. Recent Developments
10.9.6. SWOT Analysis
10.10. Under Armour Inc.
10.10.1. Business Overview
10.10.2. Company Snapshot
10.10.3. Company Market Share Analysis
10.10.4. Company Component Portfolio
10.10.5. Recent Developments
10.10.6. SWOT Analysis
List of Table
1. Global Sports Fitness Clothing Market, By End User, 2019-2032 (USD Billion)
2. Global Men Sports Fitness Clothing Market, By Region, 2019-2032 (USD Billion)
3. Global Women Sports Fitness Clothing Market, By Region, 2019-2032 (USD Billion)
4. Global Children Sports Fitness Clothing Market, By Region, 2019-2032 (USD Billion)
5. Global Sports Fitness Clothing Market, By Distribution Channel, 2019-2032 (USD Billion)
6. Global Online Sports Fitness Clothing Market, By Region, 2019-2032 (USD Billion)
7. Global Offline Sports Fitness Clothing Market, By Region, 2019-2032 (USD Billion)
8. Global Sports Fitness Clothing Market, By Region, 2019-2032 (USD Billion)
9. North America Sports Fitness Clothing Market, By End User, 2019-2032 (USD Billion)
10. North America Sports Fitness Clothing Market, By Distribution Channel, 2019-2032 (USD Billion)
11. U.S. Sports Fitness Clothing Market, By End User, 2019-2032 (USD Billion)
12. U.S. Sports Fitness Clothing Market, By Distribution Channel, 2019-2032 (USD Billion)
13. Canada Sports Fitness Clothing Market, By End User, 2019-2032 (USD Billion)
14. Canada Sports Fitness Clothing Market, By Distribution Channel, 2019-2032 (USD Billion)
15. Mexico Sports Fitness Clothing Market, By End User, 2019-2032 (USD Billion)
16. Mexico Sports Fitness Clothing Market, By Distribution Channel, 2019-2032 (USD Billion)
17. Europe Sports Fitness Clothing Market, By End User, 2019-2032 (USD Billion)
18. Europe Sports Fitness Clothing Market, By Distribution Channel, 2019-2032 (USD Billion)
19. Germany Sports Fitness Clothing Market, By End User, 2019-2032 (USD Billion)
20. Germany Sports Fitness Clothing Market, By Distribution Channel, 2019-2032 (USD Billion)
21. France Sports Fitness Clothing Market, By End User, 2019-2032 (USD Billion)
22. France Sports Fitness Clothing Market, By Distribution Channel, 2019-2032 (USD Billion)
23. U.K. Sports Fitness Clothing Market, By End User, 2019-2032 (USD Billion)
24. U.K. Sports Fitness Clothing Market, By Distribution Channel, 2019-2032 (USD Billion)
25. Italy Sports Fitness Clothing Market, By End User, 2019-2032 (USD Billion)
26. Italy Sports Fitness Clothing Market, By Distribution Channel, 2019-2032 (USD Billion)
27. Spain Sports Fitness Clothing Market, By End User, 2019-2032 (USD Billion)
28. Spain Sports Fitness Clothing Market, By Distribution Channel, 2019-2032 (USD Billion)
29. Asia Pacific Sports Fitness Clothing Market, By End User, 2019-2032 (USD Billion)
30. Asia Pacific Sports Fitness Clothing Market, By Distribution Channel, 2019-2032 (USD Billion)
31. Japan Sports Fitness Clothing Market, By End User, 2019-2032 (USD Billion)
32. Japan Sports Fitness Clothing Market, By Distribution Channel, 2019-2032 (USD Billion)
33. China Sports Fitness Clothing Market, By End User, 2019-2032 (USD Billion)
34. China Sports Fitness Clothing Market, By Distribution Channel, 2019-2032 (USD Billion)
35. India Sports Fitness Clothing Market, By End User, 2019-2032 (USD Billion)
36. India Sports Fitness Clothing Market, By Distribution Channel, 2019-2032 (USD Billion)
37. South America Sports Fitness Clothing Market, By End User, 2019-2032 (USD Billion)
38. South America Sports Fitness Clothing Market, By Distribution Channel, 2019-2032 (USD Billion)
39. Brazil Sports Fitness Clothing Market, By End User, 2019-2032 (USD Billion)
40. Brazil Sports Fitness Clothing Market, By Distribution Channel, 2019-2032 (USD Billion)
41. Middle East and Africa Sports Fitness Clothing Market, By End User, 2019-2032 (USD Billion)
42. Middle East and Africa Sports Fitness Clothing Market, By Distribution Channel, 2019-2032 (USD Billion)
43. UAE Sports Fitness Clothing Market, By End User, 2019-2032 (USD Billion)
44. UAE Sports Fitness Clothing Market, By Distribution Channel, 2019-2032 (USD Billion)
45. South Africa Sports Fitness Clothing Market, By End User, 2019-2032 (USD Billion)
46. South Africa Sports Fitness Clothing Market, By Distribution Channel, 2019-2032 (USD Billion)
List of Figures
1. Global Sports Fitness Clothing Market Segmentation
2. Sports Fitness Clothing Market: Research Methodology
3. Market Size Estimation Methodology: Bottom-Up Approach
4. Market Size Estimation Methodology: Top-Down Approach
5. Data Triangulation
6. Porter’s Five Forces Analysis
7. Value Chain Analysis
8. Global Sports Fitness Clothing Market Attractiveness Analysis By End User
9. Global Sports Fitness Clothing Market Attractiveness Analysis By Distribution Channel
10. Global Sports Fitness Clothing Market Attractiveness Analysis By Region
11. Global Sports Fitness Clothing Market: Dynamics
12. Global Sports Fitness Clothing Market Share by End User (2022 & 2032)
13. Global Sports Fitness Clothing Market Share by Distribution Channel (2022 & 2032)
14. Global Sports Fitness Clothing Market Share by Regions (2022 & 2032)
15. Global Sports Fitness Clothing Market Share by Company (2022)
This study forecasts revenue at global, regional, and country levels from 2019 to 2032. The Brainy Insights has segmented the global sports fitness clothing market based on below mentioned segments:
Global Sports Fitness Clothing Market by End User:
Global Sports Fitness Clothing Market by Distribution Channel:
Global Sports Fitness Clothing Market by Region:
Research has its special purpose to undertake marketing efficiently. In this competitive scenario, businesses need information across all industry verticals; the information about customer wants, market demand, competition, industry trends, distribution channels etc. This information needs to be updated regularly because businesses operate in a dynamic environment. Our organization, The Brainy Insights incorporates scientific and systematic research procedures in order to get proper market insights and industry analysis for overall business success. The analysis consists of studying the market from a miniscule level wherein we implement statistical tools which helps us in examining the data with accuracy and precision.
Our research reports feature both; quantitative and qualitative aspects for any market. Qualitative information for any market research process are fundamental because they reveal the customer needs and wants, usage and consumption for any product/service related to a specific industry. This in turn aids the marketers/investors in knowing certain perceptions of the customers. Qualitative research can enlighten about the different product concepts and designs along with unique service offering that in turn, helps define marketing problems and generate opportunities. On the other hand, quantitative research engages with the data collection process through interviews, e-mail interactions, surveys and pilot studies. Quantitative aspects for the market research are useful to validate the hypotheses generated during qualitative research method, explore empirical patterns in the data with the help of statistical tools, and finally make the market estimations.
The Brainy Insights offers comprehensive research and analysis, based on a wide assortment of factual insights gained through interviews with CXOs and global experts and secondary data from reliable sources. Our analysts and industry specialist assume vital roles in building up statistical tools and analysis models, which are used to analyse the data and arrive at accurate insights with exceedingly informative research discoveries. The data provided by our organization have proven precious to a diverse range of companies, facilitating them to address issues such as determining which products/services are the most appealing, whether or not customers use the product in the manner anticipated, the purchasing intentions of the market and many others.
Our research methodology encompasses an idyllic combination of primary and secondary initiatives. Key phases involved in this process are listed below:

The phase involves the gathering and collecting of market data and its related information with the help of different sources & research procedures.

The data procurement stage involves in data gathering and collecting through various data sources.
This stage involves in extensive research. These data sources includes:
Purchased Database: Purchased databases play a crucial role in estimating the market sizes irrespective of the domain. Our purchased database includes:
Primary Research: The Brainy Insights interacts with leading companies and experts of the concerned domain to develop the analyst team’s market understanding and expertise. It improves and substantiates every single data presented in the market reports. Primary research mainly involves in telephonic interviews, E-mail interactions and face-to-face interviews with the raw material providers, manufacturers/producers, distributors, & independent consultants. The interviews that we conduct provides valuable data on market size and industry growth trends prevailing in the market. Our organization also conducts surveys with the various industry experts in order to gain overall insights of the industry/market. For instance, in healthcare industry we conduct surveys with the pharmacists, doctors, surgeons and nurses in order to gain insights and key information of a medical product/device/equipment which the customers are going to usage. Surveys are conducted in the form of questionnaire designed by our own analyst team. Surveys plays an important role in primary research because surveys helps us to identify the key target audiences of the market. Additionally, surveys helps to identify the key target audience engaged with the market. Our survey team conducts the survey by targeting the key audience, thus gaining insights from them. Based on the perspectives of the customers, this information is utilized to formulate market strategies. Moreover, market surveys helps us to understand the current competitive situation of the industry. To be precise, our survey process typically involve with the 360 analysis of the market. This analytical process begins by identifying the prospective customers for a product or service related to the market/industry to obtain data on how a product/service could fit into customers’ lives.

Secondary Research: The secondary data sources includes information published by the on-profit organizations such as World bank, WHO, company fillings, investor presentations, annual reports, national government documents, statistical databases, blogs, articles, white papers and others. From the annual report, we analyse a company’s revenue to understand the key segment and market share of that organization in a particular region. We analyse the company websites and adopt the product mapping technique which is important for deriving the segment revenue. In the product mapping method, we select and categorize the products offered by the companies catering to domain specific market, deduce the product revenue for each of the companies so as to get overall estimation of the market size. We also source data and analyses trends based on information received from supply side and demand side intermediaries in the value chain. The supply side denotes the data gathered from supplier, distributor, wholesaler and the demand side illustrates the data gathered from the end customers for respective market domain.

The supply side for a domain specific market is analysed by:
The demand side for the market is estimated through:
In-house Library: Apart from these third-party sources, we have our in-house library of qualitative and quantitative information. Our in-house database includes market data for various industry and domains. These data are updated on regular basis as per the changing market scenario. Our library includes, historic databases, internal audit reports and archives.
Sometimes there are instances where there is no metadata or raw data available for any domain specific market. For those cases, we use our expertise to forecast and estimate the market size in order to generate comprehensive data sets. Our analyst team adopt a robust research technique in order to produce the estimates:
Data Synthesis: This stage involves the analysis & mapping of all the information obtained from the previous step. It also involves in scrutinizing the data for any discrepancy observed while data gathering related to the market. The data is collected with consideration to the heterogeneity of sources. Robust scientific techniques are in place for synthesizing disparate data sets and provide the essential contextual information that can orient market strategies. The Brainy Insights has extensive experience in data synthesis where the data passes through various stages:


Market Deduction & Formulation: The final stage comprises of assigning data points at appropriate market spaces so as to deduce feasible conclusions. Analyst perspective & subject matter expert based holistic form of market sizing coupled with industry analysis also plays a crucial role in this stage.
This stage involves in finalization of the market size and numbers that we have collected from data integration step. With data interpolation, it is made sure that there is no gap in the market data. Successful trend analysis is done by our analysts using extrapolation techniques, which provide the best possible forecasts for the market.
Data Validation & Market Feedback: Validation is the most important step in the process. Validation & re-validation via an intricately designed process helps us finalize data-points to be used for final calculations.

The Brainy Insights interacts with leading companies and experts of the concerned domain to develop the analyst team’s market understanding and expertise. It improves and substantiates every single data presented in the market reports. The data validation interview and discussion panels are typically composed of the most experienced industry members. The participants include, however, are not limited to:
Moreover, we always validate our data and findings through primary respondents from all the major regions we are working on.


Free Customization
Fortune 500 Clients
Free Yearly Update On Purchase Of Multi/Corporate License
Companies Served Till Date