- +1-315-215-1633
- sales@thebrainyinsights.com

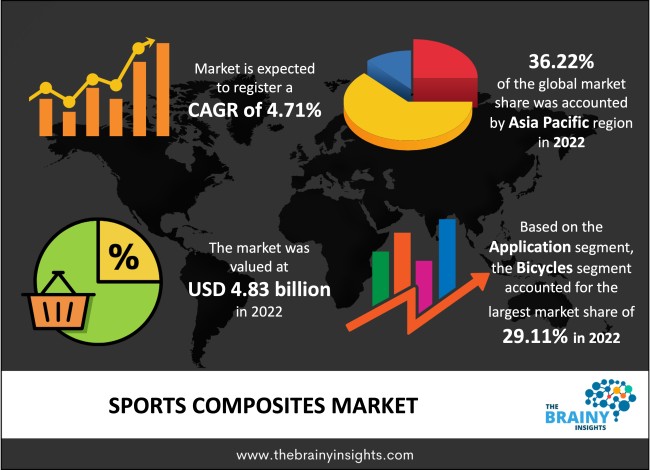
The global sports composites market was valued at USD 4.83 Billion in 2022 and grew at a CAGR of 4.71% from 2023 to 2032. The market is expected to reach USD 7.66 Billion by 2032. The growth of the Sports composites market can be attributed to the rise in demand for lightweight sports equipment.
A new class of high-performance materials called sports composites was created to satisfy the demands of most sports-demanding operating environments. Composite materials aid athletes worldwide in maximizing performance in anything from football helmets and hockey sticks to kayaks and bobsleds. Carbon or glass fibre composites have applications in almost every sport, and many Olympians and Little League players use high-performance composite sports equipment. Sports equipment is made of composites because they are lightweight, easy to transport, durable, and require little maintenance.
Get an overview of this study by requesting a free sample
Increasing use in different applications: Composites are a material used for various sports equipment. Many composites have gained prominence, in the manufacturing of sports equipment. Sports composite is a revolutionary material for increasing the toughness and reduction of weight in sports equipment. The development of rigid and, light weight materials that can endure higher operating temperatures using composites raises the possibility of weight reduction. Compared to conventional materials, advanced composites are a viable alternative for various sports applications due to their superior corrosion resistance, high hardness, erosion resistance, low density, strong elastic modulus, and lower friction coefficients.
Fluctuating cost: The fluctuation in the price of raw materials used for manufacturing sports composites impacts the market. The fluctuating cost of raw materials could disrupt the supply chain of the sports composite market. The gap in demand and supply is responsible for the fluctuation in the cost of raw materials. Thus the fluctuation in the raw materials is a restraint for the market.
Increasing investment in the sports industry: In the next three to five years, institutional investment in sports will increase as the outlook for the sports business improves compared to last year. Sport investment levels are predicted to continue increasing, as are prices. Sports organizations need more funding than ever to stay competitive both on and off the pitch, and investors have been encouraged by the underlying stability of consumer demand. Sports play a more significant role in people's daily lives, and interest in more specialized sports like skiing and surfing and outdoor pursuits like camping is rising. Thus this factor promotes the use of the sports composites market.
The regions analyzed for the market include North America, Europe, South America, Asia Pacific, the Middle East, and Africa. Asia Pacific emerged as the most significant sports composites market, with a 36.22% market revenue share in 2022.
Asia Pacific region will account for the largest market share with revenue growth. The growing number of regional sports events leads to high demand for sports composites. Also, many sports equipment manufacturers use composites to produce sports equipment to reduce overall weight.
Asia Pacific region Sports composites Market Share in 2022 - 36.22%
www.thebrainyinsights.com
Check the geographical analysis of this market by requesting a free sample
The resin type segment is divided into polyamide, epoxy, polypropylene, and polyurethane. The polyurethane segment dominated the market, with a share of around 34.91% in 2022. Commercially significant polyurethanes come in various forms, and they can be categorized into flexible foams, elastomers, surface coatings, and adhesives. Due to their adaptability, durability, lightweight, production, and cost-effectiveness, polyurethane foams are employed in a wide range of sports goods.
The fibre type segment is divided into glass and carbon. The carbon segment dominated the market, with a share of around 58.92% in 2022. Carbon fibres are widely available and used to manufacture tackles, racquets, golf shafts, etc. Carbon fibres are lightweight and increased compressive strength. Sports equipment manufactured using carbon fibre develops resistance and longevity.
The application segment is divided into hockey sticks, golf sticks, bicycles, rackets and, skis & snowboards. The bicycles segment dominated the market, with a share of around 29.11% in 2022. Manufacturers are developing bicycles with composites to reduce weight significantly and improve resistance.
| Attribute | Description |
|---|---|
| Market Size | Revenue (USD Billion) |
| Market size value in 2022 | USD 4.83 Billion |
| Market size value in 2032 | USD 7.66 Billion |
| CAGR (2023 to 2032) | 4.71% |
| Historical data | 2019-2021 |
| Base Year | 2022 |
| Forecast | 2023-2032 |
| Region | The regions analyzed for the market are Asia Pacific, Europe, South America, North America, and Middle East & Africa. Furthermore, the regions are further analyzed at the country level. |
| Segments | Resin Type, Fiber Type and Application |
As per The Brainy Insights, the size of the sports composites market was valued 4.83 billion in 2022 to USD 7.66 Billion by 2032.
Global sports composites market is growing at a CAGR of 4.71% during the forecast period 2023-2032.
Asia Pacific region emerged as the largest market for the sports composites.
The market's growth will be influenced by the growing usage of composites in sports equipment.
The fluctuating cost of raw materials can hamper the market growth.
The increasing investment in sports industry is providing huge opportunities to the market.
1. Introduction
1.1. Objectives of the Study
1.2. Market Definition
1.3. Research Scope
1.4. Currency
1.5. Key Target Audience
2. Research Methodology and Assumptions
3. Executive Summary
4. Premium Insights
4.1. Porter’s Five Forces Analysis
4.2. Value Chain Analysis
4.3. Top Investment Pockets
4.3.1. Market Attractiveness Analysis By Resin Type
4.3.2. Market Attractiveness Analysis By Fiber Type
4.3.3. Market Attractiveness Analysis By Application
4.3.4. Market Attractiveness Analysis By Region
4.4. Industry Trends
5. Market Dynamics
5.1. Market Evaluation
5.2. Drivers
5.2.1. Increasing usage of sports composites
5.3. Restraints
5.3.1. Fluctuating cost of raw materials
5.4. Opportunities
5.4.1. Increasing investment in sports equipment
5.5. Challenges
5.5.1. Availability of substitutes
6. Global Sports Composites Market Analysis and Forecast, By Resin Type
6.1. Segment Overview
6.2. Polyamide
6.3. Epoxy
6.4. Polypropylene
6.5. Polyurethane
7. Global Sports Composites Market Analysis and Forecast, By Fiber Type
7.1. Segment Overview
7.2. Glass
7.3. Carbon
8. Global Sports Composites Market Analysis and Forecast, By Application
8.1. Segment Overview
8.2. Hockey Sticks
8.3. Golf Sticks
8.4. Bicycles
8.5. Rackets
8.6. Skis & Snowboards
9. Global Sports Composites Market Analysis and Forecast, By Regional Analysis
9.1. Segment Overview
9.2. North America
9.2.1. U.S.
9.2.2. Canada
9.2.3. Mexico
9.3. Europe
9.3.1. Germany
9.3.2. France
9.3.3. U.K.
9.3.4. Italy
9.3.5. Spain
9.4. Asia-Pacific
9.4.1. Japan
9.4.2. China
9.4.3. India
9.5. South America
9.5.1. Brazil
9.6. Middle East and Africa
9.6.1. UAE
9.6.2. South Africa
10. Global Sports Composites Market-Competitive Landscape
10.1. Overview
10.2. Market Share of Key Players in the Sports Composites Market
10.2.1. Global Company Market Share
10.2.2. North America Company Market Share
10.2.3. Europe Company Market Share
10.2.4. APAC Company Market Share
10.3. Competitive Situations and Trends
10.3.1. Product Launches and Developments
10.3.2. Partnerships, Collaborations, and Agreements
10.3.3. Mergers & Acquisitions
10.3.4. Expansions
11. Company Profiles
11.1. Zoltek Carbon Fibers
11.1.1. Business Overview
11.1.2. Company Snapshot
11.1.3. Company Market Share Analysis
11.1.4. Company Product Portfolio
11.1.5. Recent Developments
11.1.6. SWOT Analysis
11.2. Protech Composites
11.2.1. Business Overview
11.2.2. Company Snapshot
11.2.3. Company Market Share Analysis
11.2.4. Company Product Portfolio
11.2.5. Recent Developments
11.2.6. SWOT Analysis
11.3. Rockwood Composites Limited
11.3.1. Business Overview
11.3.2. Company Snapshot
11.3.3. Company Market Share Analysis
11.3.4. Company Product Portfolio
11.3.5. Recent Developments
11.3.6. SWOT Analysis
11.4. Saint-Gobain Vetrotex
11.4.1. Business Overview
11.4.2. Company Snapshot
11.4.3. Company Market Share Analysis
11.4.4. Company Product Portfolio
11.4.5. Recent Developments
11.4.6. SWOT Analysis
11.5. Entropy Resins Inc.
11.5.1. Business Overview
11.5.2. Company Snapshot
11.5.3. Company Market Share Analysis
11.5.4. Company Product Portfolio
11.5.5. Recent Developments
11.5.6. SWOT Analysis
11.6. Amer Sports
11.6.1. Business Overview
11.6.2. Company Snapshot
11.6.3. Company Market Share Analysis
11.6.4. Company Product Portfolio
11.6.5. Recent Developments
11.6.6. SWOT Analysis
11.7. Rossignol
1.1.1. Business Overview
1.1.2. Company Snapshot
1.1.3. Company Market Share Analysis
1.1.4. Company Product Portfolio
1.1.5. Recent Developments
1.1.6. SWOT Analysis
11.8. Ficher Sports
11.8.1. Business Overview
11.8.2. Company Snapshot
11.8.3. Company Market Share Analysis
11.8.4. Company Product Portfolio
11.8.5. Recent Developments
11.8.6. SWOT Analysis
11.9. ALDILA
11.9.1. Business Overview
11.9.2. Company Snapshot
11.9.3. Company Market Share Analysis
11.9.4. Company Product Portfolio
11.9.5. Recent Developments
11.9.6. SWOT Analysis
11.10. Callway Golf
11.10.1. Business Overview
11.10.2. Company Snapshot
11.10.3. Company Market Share Analysis
11.10.4. Company Product Portfolio
11.10.5. Recent Developments
11.10.6. SWOT Analysis
11.11. Prokennex
11.11.1. Business Overview
11.11.2. Company Snapshot
11.11.3. Company Market Share Analysis
11.11.4. Company Product Portfolio
11.11.5. Recent Developments
11.11.6. SWOT Analysis
11.12. Topkey Corporation
11.12.1. Business Overview
11.12.2. Company Snapshot
11.12.3. Company Market Share Analysis
11.12.4. Company Product Portfolio
11.12.5. Recent Developments
11.12.6. SWOT Analysis
List of Table
1. Global Sports Composites Market, By Resin Type, 2019-2032 (USD Billion)
2. Global Polyamide, Sports Composites Market, By Region, 2019-2032 (USD Billion)
3. Global Epoxy, Sports Composites Market, By Region, 2019-2032 (USD Billion)
4. Global Polypropylene, Sports Composites Market, By Region, 2019-2032 (USD Billion)
5. Global Polyurethane, Sports Composites Market, By Region, 2019-2032 (USD Billion)
6. Global Sports Composites Market, By Fiber Type, 2019-2032 (USD Billion)
7. Global Glass, Sports Composites Market, By Region, 2019-2032 (USD Billion)
8. Global Carbon, Sports Composites Market, By Region, 2019-2032 (USD Billion)
9. Global Sports Composites Market, By Application, 2019-2032 (USD Billion)
10. Global Hockey Sticks, Sports Composites Market, By Region, 2019-2032 (USD Billion)
11. Global Golf Sticks, Sports Composites Market, By Region, 2019-2032 (USD Billion)
12. Global Bicycles, Sports Composites Market, By Region, 2019-2032 (USD Billion)
13. Global Rackets, Sports Composites Market, By Region, 2019-2032 (USD Billion)
14. Global Skis & Snowboards, Sports Composites Market, By Region, 2019-2032 (USD Billion)
15. Global Sports Composites Market, By Region, 2019-2032 (USD Billion)
16. North America Sports Composites Market, By Resin Type, 2019-2032 (USD Billion)
17. North America Sports Composites Market, By Fiber Type, 2019-2032 (USD Billion)
18. North America Sports Composites Market, By Application, 2019-2032 (USD Billion)
19. U.S. Sports Composites Market, By Resin Type, 2019-2032 (USD Billion)
20. U.S. Sports Composites Market, By Fiber Type, 2019-2032 (USD Billion)
21. U.S. Sports Composites Market, By Application, 2019-2032 (USD Billion)
22. Canada Sports Composites Market, By Resin Type, 2019-2032 (USD Billion)
23. Canada Sports Composites Market, By Fiber Type, 2019-2032 (USD Billion)
24. Canada Sports Composites Market, By Application, 2019-2032 (USD Billion)
25. Mexico Sports Composites Market, By Resin Type, 2019-2032 (USD Billion)
26. Mexico Sports Composites Market, By Fiber Type, 2019-2032 (USD Billion)
27. Mexico Sports Composites Market, By Application, 2019-2032 (USD Billion)
28. Europe Sports Composites Market, By Resin Type, 2019-2032 (USD Billion)
29. Europe Sports Composites Market, By Fiber Type, 2019-2032 (USD Billion)
30. Europe Sports Composites Market, By Application, 2019-2032 (USD Billion)
31. Germany Sports Composites Market, By Resin Type, 2019-2032 (USD Billion)
32. Germany Sports Composites Market, By Fiber Type, 2019-2032 (USD Billion)
33. Germany Sports Composites Market, By Application, 2019-2032 (USD Billion)
34. France Sports Composites Market, By Resin Type, 2019-2032 (USD Billion)
35. France Sports Composites Market, By Fiber Type, 2019-2032 (USD Billion)
36. France Sports Composites Market, By Application, 2019-2032 (USD Billion)
37. U.K. Sports Composites Market, By Resin Type, 2019-2032 (USD Billion)
38. U.K. Sports Composites Market, By Fiber Type, 2019-2032 (USD Billion)
39. U.K. Sports Composites Market, By Application, 2019-2032 (USD Billion)
40. Italy Sports Composites Market, By Resin Type, 2019-2032 (USD Billion)
41. Italy Sports Composites Market, By Fiber Type, 2019-2032 (USD Billion)
42. Italy Sports Composites Market, By Application, 2019-2032 (USD Billion)
43. Spain Sports Composites Market, By Resin Type, 2019-2032 (USD Billion)
44. Spain Sports Composites Market, By Fiber Type, 2019-2032 (USD Billion)
45. Spain Sports Composites Market, By Application, 2019-2032 (USD Billion)
46. Asia Pacific Sports Composites Market, By Resin Type, 2019-2032 (USD Billion)
47. Asia Pacific Sports Composites Market, By Fiber Type, 2019-2032 (USD Billion)
48. Asia Pacific Sports Composites Market, By Application, 2019-2032 (USD Billion)
49. Japan Sports Composites Market, By Resin Type, 2019-2032 (USD Billion)
50. Japan Sports Composites Market, By Fiber Type, 2019-2032 (USD Billion)
51. Japan Sports Composites Market, By Application, 2019-2032 (USD Billion)
52. China Sports Composites Market, By Resin Type, 2019-2032 (USD Billion)
53. China Sports Composites Market, By Fiber Type, 2019-2032 (USD Billion)
54. China Sports Composites Market, By Application, 2019-2032 (USD Billion)
55. India Sports Composites Market, By Resin Type, 2019-2032 (USD Billion)
56. India Sports Composites Market, By Fiber Type, 2019-2032 (USD Billion)
57. India Sports Composites Market, By Application, 2019-2032 (USD Billion)
58. South America Sports Composites Market, By Resin Type, 2019-2032 (USD Billion)
59. South America Sports Composites Market, By Fiber Type, 2019-2032 (USD Billion)
60. South America Sports Composites Market, By Application, 2019-2032 (USD Billion)
61. Brazil Sports Composites Market, By Resin Type, 2019-2032 (USD Billion)
62. Brazil Sports Composites Market, By Fiber Type, 2019-2032 (USD Billion)
63. Brazil Sports Composites Market, By Application, 2019-2032 (USD Billion)
64. Middle East and Africa Sports Composites Market, By Resin Type, 2019-2032 (USD Billion)
65. Middle East and Africa Sports Composites Market, By Fiber Type, 2019-2032 (USD Billion)
66. Middle East and Africa Sports Composites Market, By Application, 2019-2032 (USD Billion)
67. UAE Sports Composites Market, By Resin Type, 2019-2032 (USD Billion)
68. UAE Sports Composites Market, By Fiber Type, 2019-2032 (USD Billion)
69. UAE Sports Composites Market, By Application, 2019-2032 (USD Billion)
70. South Africa Sports Composites Market, By Resin Type, 2019-2032 (USD Billion)
71. South Africa Sports Composites Market, By Fiber Type, 2019-2032 (USD Billion)
72. South Africa Sports Composites Market, By Application, 2019-2032 (USD Billion)
List of Figures
1. Global Sports Composites Market Segmentation
2. Sports Composites Market: Research Methodology
3. Market Size Estimation Methodology: Bottom-Up Approach
4. Market Size Estimation Methodology: Top-Down Approach
5. Data Triangulation
6. Porter’s Five Forces Analysis
7. Value Chain Analysis
8. Global Sports Composites Market Attractiveness Analysis By Resin Type
9. Global Sports Composites Market Attractiveness Analysis By Fiber Type
10. Global Sports Composites Market Attractiveness Analysis By Application
11. Global Sports Composites Market Attractiveness Analysis By Region
12. Global Sports Composites Market: Dynamics
13. Global Sports Composites Market Share By Resin Type (2022 & 2032)
14. Global Sports Composites Market Share by Fiber Type (2022 & 2032)
15. Global Sports Composites Market Share by Application (2022 & 2032)
16. Global Sports Composites Market Share by Regions (2022 & 2032)
17. Global Sports Composites Market Share by Company (2022)
This study forecasts revenue at global, regional, and country levels from 2023 to 2032. The Brainy Insights has segmented the global sports composites market based on below mentioned segments:
Global Sports Composites Market by Resin Type:
Global Sports Composites Market by Fiber Type:
Global Sports Composites Market by Application:
Global Sports Composites Market by Region:
Research has its special purpose to undertake marketing efficiently. In this competitive scenario, businesses need information across all industry verticals; the information about customer wants, market demand, competition, industry trends, distribution channels etc. This information needs to be updated regularly because businesses operate in a dynamic environment. Our organization, The Brainy Insights incorporates scientific and systematic research procedures in order to get proper market insights and industry analysis for overall business success. The analysis consists of studying the market from a miniscule level wherein we implement statistical tools which helps us in examining the data with accuracy and precision.
Our research reports feature both; quantitative and qualitative aspects for any market. Qualitative information for any market research process are fundamental because they reveal the customer needs and wants, usage and consumption for any product/service related to a specific industry. This in turn aids the marketers/investors in knowing certain perceptions of the customers. Qualitative research can enlighten about the different product concepts and designs along with unique service offering that in turn, helps define marketing problems and generate opportunities. On the other hand, quantitative research engages with the data collection process through interviews, e-mail interactions, surveys and pilot studies. Quantitative aspects for the market research are useful to validate the hypotheses generated during qualitative research method, explore empirical patterns in the data with the help of statistical tools, and finally make the market estimations.
The Brainy Insights offers comprehensive research and analysis, based on a wide assortment of factual insights gained through interviews with CXOs and global experts and secondary data from reliable sources. Our analysts and industry specialist assume vital roles in building up statistical tools and analysis models, which are used to analyse the data and arrive at accurate insights with exceedingly informative research discoveries. The data provided by our organization have proven precious to a diverse range of companies, facilitating them to address issues such as determining which products/services are the most appealing, whether or not customers use the product in the manner anticipated, the purchasing intentions of the market and many others.
Our research methodology encompasses an idyllic combination of primary and secondary initiatives. Key phases involved in this process are listed below:

The phase involves the gathering and collecting of market data and its related information with the help of different sources & research procedures.

The data procurement stage involves in data gathering and collecting through various data sources.
This stage involves in extensive research. These data sources includes:
Purchased Database: Purchased databases play a crucial role in estimating the market sizes irrespective of the domain. Our purchased database includes:
Primary Research: The Brainy Insights interacts with leading companies and experts of the concerned domain to develop the analyst team’s market understanding and expertise. It improves and substantiates every single data presented in the market reports. Primary research mainly involves in telephonic interviews, E-mail interactions and face-to-face interviews with the raw material providers, manufacturers/producers, distributors, & independent consultants. The interviews that we conduct provides valuable data on market size and industry growth trends prevailing in the market. Our organization also conducts surveys with the various industry experts in order to gain overall insights of the industry/market. For instance, in healthcare industry we conduct surveys with the pharmacists, doctors, surgeons and nurses in order to gain insights and key information of a medical product/device/equipment which the customers are going to usage. Surveys are conducted in the form of questionnaire designed by our own analyst team. Surveys plays an important role in primary research because surveys helps us to identify the key target audiences of the market. Additionally, surveys helps to identify the key target audience engaged with the market. Our survey team conducts the survey by targeting the key audience, thus gaining insights from them. Based on the perspectives of the customers, this information is utilized to formulate market strategies. Moreover, market surveys helps us to understand the current competitive situation of the industry. To be precise, our survey process typically involve with the 360 analysis of the market. This analytical process begins by identifying the prospective customers for a product or service related to the market/industry to obtain data on how a product/service could fit into customers’ lives.

Secondary Research: The secondary data sources includes information published by the on-profit organizations such as World bank, WHO, company fillings, investor presentations, annual reports, national government documents, statistical databases, blogs, articles, white papers and others. From the annual report, we analyse a company’s revenue to understand the key segment and market share of that organization in a particular region. We analyse the company websites and adopt the product mapping technique which is important for deriving the segment revenue. In the product mapping method, we select and categorize the products offered by the companies catering to domain specific market, deduce the product revenue for each of the companies so as to get overall estimation of the market size. We also source data and analyses trends based on information received from supply side and demand side intermediaries in the value chain. The supply side denotes the data gathered from supplier, distributor, wholesaler and the demand side illustrates the data gathered from the end customers for respective market domain.

The supply side for a domain specific market is analysed by:
The demand side for the market is estimated through:
In-house Library: Apart from these third-party sources, we have our in-house library of qualitative and quantitative information. Our in-house database includes market data for various industry and domains. These data are updated on regular basis as per the changing market scenario. Our library includes, historic databases, internal audit reports and archives.
Sometimes there are instances where there is no metadata or raw data available for any domain specific market. For those cases, we use our expertise to forecast and estimate the market size in order to generate comprehensive data sets. Our analyst team adopt a robust research technique in order to produce the estimates:
Data Synthesis: This stage involves the analysis & mapping of all the information obtained from the previous step. It also involves in scrutinizing the data for any discrepancy observed while data gathering related to the market. The data is collected with consideration to the heterogeneity of sources. Robust scientific techniques are in place for synthesizing disparate data sets and provide the essential contextual information that can orient market strategies. The Brainy Insights has extensive experience in data synthesis where the data passes through various stages:


Market Deduction & Formulation: The final stage comprises of assigning data points at appropriate market spaces so as to deduce feasible conclusions. Analyst perspective & subject matter expert based holistic form of market sizing coupled with industry analysis also plays a crucial role in this stage.
This stage involves in finalization of the market size and numbers that we have collected from data integration step. With data interpolation, it is made sure that there is no gap in the market data. Successful trend analysis is done by our analysts using extrapolation techniques, which provide the best possible forecasts for the market.
Data Validation & Market Feedback: Validation is the most important step in the process. Validation & re-validation via an intricately designed process helps us finalize data-points to be used for final calculations.

The Brainy Insights interacts with leading companies and experts of the concerned domain to develop the analyst team’s market understanding and expertise. It improves and substantiates every single data presented in the market reports. The data validation interview and discussion panels are typically composed of the most experienced industry members. The participants include, however, are not limited to:
Moreover, we always validate our data and findings through primary respondents from all the major regions we are working on.


Free Customization
Fortune 500 Clients
Free Yearly Update On Purchase Of Multi/Corporate License
Companies Served Till Date