- +1-315-215-1633
- sales@thebrainyinsights.com

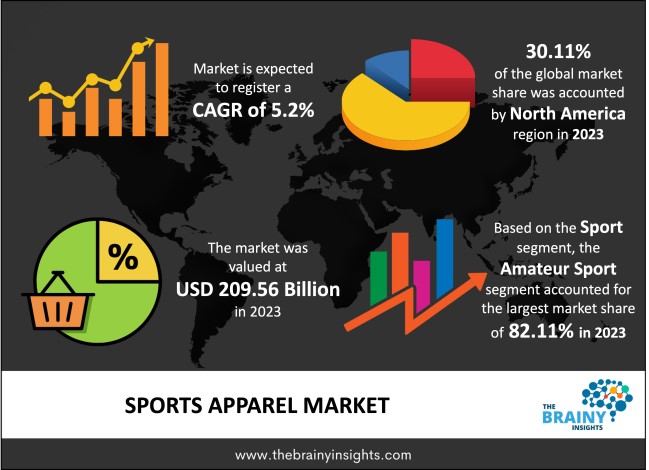
The global Sports Apparel market was valued at USD 209.56 Billion in 2023 and growing at a CAGR of 5.2% from 2024 to 2033. The market is expected to reach USD 347.91 Billion by 2033. This market growth is attributed to the surge in the population's healthier lifestyles and increased participation in fitness and sports activities. Also, it has been observed that the innovative solutions provided by sports apparel brands lead to their growing popularity and, eventually, substantial growth. These factors are eventually driving the growth of the activewear market. Also, with the help of celebrity and social media influencer endorsement, brands can reach the customers easily. Brands can choose celebrities and social media influencers from the products and promote their products. With this, they can launch their brand strongly in the market and can also increase their revenue by acquiring more and more market.
Sports apparel is the clothes that are worn when performing strenuous physical activities like workout sessions and playing some sports. These apparel are designed using a breathable material, which helps evaporate sweat quickly and helps the person who wears it feel fresh for a longer time. Some common fabrics for producing sports apparel clothing are microfiber, polyester, calico, and spandex. Athletes generally used this apparel, and with time, it has become very common with regular gym-goers and other non-athletes, like people going jogging, etc. Also, it has been observed that sports apparel is common in mature regions like the US, Canada and Germany and emerging economies like China, India and Brazil; this trend is growing fast. Also, there are many product launches happening with increased participation in sports activities in countries such as the US, India, etc. Also, there is an increase in the preference for outdoor recreational activities, especially among the young population, which has increased sports apparel sales. Moreover, people are becoming health-conscious, and there is an increased inclination towards sports activities and adventurous sports, eventually driving the growth of the activewear market. The market is expanding fast in emerging economies as there is a surge in the affluent population. Health awareness has grown in the region along with the growing adoption of fitness activities like swimming, aerobics, running and yoga, propelling the market's growth. Also, there is an increase in the trend of women's participation in sports and fitness activities. Also, the key sports apparel brands are making aggressive celebrity endorsements and advertisements. All these factors are driving the growth of the activewear market. Wearing stylish and exquisite sports apparel also increases the confidence of customers, and at the same time their interest in sports activities also increases. These sports apparels are designed in such a way that it can be worn anytime and they are made of durable material, so that they can be used for a long time, and by wearing them one can participate in any activities or sports.
Get an overview of this study by requesting a free sample
Growing health awareness – There is a surge in public awareness of health and fitness globally. Many people have become health-conscious and focus on physical fitness; hence, the demand for sports apparel has increased. Sports apparel is generally linked to active lifestyles and workouts, propelling the market's growth. Also, there is a presence of many types of sports apparel in the market, which are designed to offer comfort and support while doing high-intensity workouts. It also provides a stylish look. All these factors are driving the market to grow. The blending of sportswear and fashion is giving rise to athleisure. Sports apparel is not getting worn just for exercise but also as casual wear. All these factors are driving the activewear market.
Fluctuation in the price of raw materials – There is fluctuation in the price of raw materials which are used in the making of sports apparel. For instance, synthetic fibres are used for sports apparel, and producing such fibres as rayon, nylon, and polyester requires crude oil in large quantities. Also, cotton production is seasonal and generally depends on factors like humidity, rainfall, solar radiation, etc. Moreover, counterfeit products are easily available. All these factors are acting as restraints for the activewear market.
Surge in Urbanization – There is a surge in urbanization, and the urban population are adopting active lifestyles. Due to urbanization, cities are growing, and hence, the demand for sports apparel to accommodate people's active lifestyles will grow. Also, high-profile celebrities and athletes endorse the sports apparel brands, influencing consumer preference. The consumer often follows the styles of their favourite athletes, and the demand for the endorsed products will grow. Also, major sports events such as the Cricket World Cup, FIFA World Cup, Olympics and Marathons often trigger interest in fitness and sports, which eventually help in buying sports apparel. Also, social media influences consumer preferences. People are discovering new brands and trends using YouTube, Instagram, etc. All these factors eventually drive the activewear market in the forecasting period.
The regions analyzed for the market include North America, Europe, South America, Asia Pacific, the Middle East, and Africa. North America emerged as the largest market for the global Sports Apparel market, with a 30.11% share of the market revenue in 2023. This lion's share is attributed to the growing number of people participating in sports like rugby and basketball in the region. Marathon races like Chicago, New York City, and Boston marathons are also popular in this region. The US is also popular for other sports like racket sports, hockey, basketball, racing, lacrosse and football. Also, many players are incentivized to introduce new product lines due to a surge in consumer participation in many sports activities. All these factors are driving the activewear market in the region.
North America Region Sports Apparel Market Share in 2023 - 30.11%
www.thebrainyinsights.com
Check the geographical analysis of this market by requesting a free sample
The sport segment is divided into amateur sport and professional athletics. The amateur sport segment dominated the market, with a market share of around 82.11% in 2023. Advancements in technology are helping designers design sports apparel to improve the comfort and performance of the wearer, which drives sports apparel sales. These apparel are also becoming popular style statements and faster becoming a trend. The sales of sports-inspired apparel are growing at a faster pace.
The end user segment is divided into children, men and women. The men segment dominated the market, with a market share of around 49.54% in 2023. This market share is attributed to a larger percentage of men's participation in sports activities. People are also involved in outdoor recreational activities, and men are also leading in this segment. Men are found to be more interested in playing sports than women.
The Distribution Channel segment is divided into e-commerce, super/hypermarket, brand outlet and discount stores. The discount stores segment dominated the market, with a market share of around 29.67% in 2023. It is attributed to many favourable advantages like discounts, trials before buying the product, and a sense of gratification. Consumers prefer to buy apparel from such centres as it can be cost-effective and cheaper than usual stores. Also, discount stores offer many choices for customers.
| Attribute | Description |
|---|---|
| Market Size | Revenue (USD Billion) |
| Market size value in 2023 | USD 209.56 Billion |
| Market size value in 2033 | USD 347.91 Billion |
| CAGR (2024 to 2033) | 5.2% |
| Historical data | 2020-2022 |
| Base Year | 2023 |
| Forecast | 2024-2033 |
| Region | The regions analyzed for the market are Asia Pacific, Europe, South America, North America, and Middle East & Africa. Furthermore, the regions are further analyzed at the country level. |
| Segments | Sport, End User and Distribution Channel |
As per The Brainy Insights, the size of the sports apparel market was valued at USD 209.56 billion in 2023 to USD 347.91 billion by 2033.
The global sports apparel market is growing at a CAGR of 5.2% during the forecast period 2024-2033.
North America region emerged as the largest market for the Sports Apparel.
The market's growth will be influenced by growing health awareness.
Fluctuation in the price of raw materials could hamper the market growth.
Surge in urbanization will provide huge opportunities to the market.
Key players are Ralph Lauren Corporation, Iconix International, Lululemon Athletica Inc, Under Armour, Inc., Puma SE, New Balance Athletics, Inc., Adidas AG, Columbia Sportswear Company, Fila Holdings Corp. and Nike, Inc. among others.
1. Introduction
1.1. Objectives of the Study
1.2. Market Definition
1.3. Research Scope
1.4. Currency
1.5. Key Target Audience
2. Research Methodology and Assumptions
3. Executive Summary
4. Premium Insights
4.1. Porter’s Five Forces Analysis
4.2. Value Chain Analysis
4.3. Top Investment Pockets
4.3.1. Market Attractiveness Analysis by Sport
4.3.2. Market Attractiveness Analysis by End User
4.3.3. Market Attractiveness Analysis by Distribution Channel
4.3.4. Market Attractiveness Analysis by Region
4.4. Industry Trends
5. Market Dynamics
5.1. Market Evaluation
5.2. Drivers
5.2.1. Growing health awareness
5.3. Restraints
5.3.1. Fluctuation in the price of raw materials
5.4. Opportunities
5.4.1. Surge in Urbanization
5.5. Challenges
5.5.1. Shifts in Consumer Preferences
6. Global Sports Apparel Market Analysis and Forecast, By Sport
6.1. Segment Overview
6.2. Amateur Sport
6.3. Professional Athletics
7. Global Sports Apparel Market Analysis and Forecast, By End User
7.1. Segment Overview
7.2. Children
7.3. Men
7.4. Women
8. Global Sports Apparel Market Analysis and Forecast, By Distribution Channel
8.1. Segment Overview
8.2. E-Commerce
8.3. Super/Hypermarket
8.4. Brand Outlet
8.5. Discount Stores
9. Global Sports Apparel Market Analysis and Forecast, By Regional Analysis
9.1. Segment Overview
9.2. North America
9.2.1. U.S.
9.2.2. Canada
9.2.3. Mexico
9.3. Europe
9.3.1. Germany
9.3.2. France
9.3.3. U.K.
9.3.4. Italy
9.3.5. Spain
9.4. Asia-Pacific
9.4.1. Japan
9.4.2. China
9.4.3. India
9.5. South America
9.5.1. Brazil
9.6. Middle East and Africa
9.6.1. UAE
9.6.2. South Africa
10. Global Sports Apparel Market-Competitive Landscape
10.1. Overview
10.2. Market Share of Key Players in the Sports Apparel Market
10.2.1. Global Company Market Share
10.2.2. North America Company Market Share
10.2.3. Europe Company Market Share
10.2.4. APAC Company Market Share
10.3. Competitive Situations and Trends
10.3.1. Product Launches and Developments
10.3.2. Partnerships, Collaborations, and Agreements
10.3.3. Mergers & Acquisitions
10.3.4. Expansions
11. Company Profiles
11.1. Ralph Lauren Corporation
11.1.1. Business Overview
11.1.2. Company Snapshot
11.1.3. Company Market Share Analysis
11.1.4. Company Product Portfolio
11.1.5. Recent Developments
11.1.6. SWOT Analysis
11.2. Iconix International
11.2.1. Business Overview
11.2.2. Company Snapshot
11.2.3. Company Market Share Analysis
11.2.4. Company Product Portfolio
11.2.5. Recent Developments
11.2.6. SWOT Analysis
11.3. Lululemon Athletica Inc
11.3.1. Business Overview
11.3.2. Company Snapshot
11.3.3. Company Market Share Analysis
11.3.4. Company Product Portfolio
11.3.5. Recent Developments
11.3.6. SWOT Analysis
11.4. Under Armour, Inc.
11.4.1. Business Overview
11.4.2. Company Snapshot
11.4.3. Company Market Share Analysis
11.4.4. Company Product Portfolio
11.4.5. Recent Developments
11.4.6. SWOT Analysis
11.5. Puma SE
11.5.1. Business Overview
11.5.2. Company Snapshot
11.5.3. Company Market Share Analysis
11.5.4. Company Product Portfolio
11.5.5. Recent Developments
11.5.6. SWOT Analysis
11.6. New Balance Athletics, Inc.
11.6.1. Business Overview
11.6.2. Company Snapshot
11.6.3. Company Market Share Analysis
11.6.4. Company Product Portfolio
11.6.5. Recent Developments
11.6.6. SWOT Analysis
11.7. Adidas AG
11.7.1. Business Overview
11.7.2. Company Snapshot
11.7.3. Company Market Share Analysis
11.7.4. Company Product Portfolio
11.7.5. Recent Developments
11.7.6. SWOT Analysis
11.8. Columbia Sportswear Company
11.8.1. Business Overview
11.8.2. Company Snapshot
11.8.3. Company Market Share Analysis
11.8.4. Company Product Portfolio
11.8.5. Recent Developments
11.8.6. SWOT Analysis
11.9. Fila Holdings Corp.
11.9.1. Business Overview
11.9.2. Company Snapshot
11.9.3. Company Market Share Analysis
11.9.4. Company Product Portfolio
11.9.5. Recent Developments
11.9.6. SWOT Analysis
11.10. Nike, Inc.
11.10.1. Business Overview
11.10.2. Company Snapshot
11.10.3. Company Market Share Analysis
11.10.4. Company Product Portfolio
11.10.5. Recent Developments
11.10.6. SWOT Analysis
List of Table
1. Global Sports Apparel Market, By Sport, 2020-2033 (USD Billion)
2. Global Amateur Sport, Sports Apparel Market, By Region, 2020-2033 (USD Billion)
3. Global Professional Athletics, Sports Apparel Market, By Region, 2020-2033 (USD Billion)
4. Global Sports Apparel Market, By End User, 2020-2033 (USD Billion)
5. Global Children Sports Apparel Market, By Region, 2020-2033 (USD Billion)
6. Global Men Sports Apparel Market, By Region, 2020-2033 (USD Billion)
7. Global Women Sports Apparel Market, By Region, 2020-2033 (USD Billion)
8. Global Sports Apparel Market, By Distribution Channel, 2020-2033 (USD Billion)
9. Global E-Commerce Sports Apparel Market, By Region, 2020-2033 (USD Billion)
10. Global Super/Hypermarket Sports Apparel Market, By Region, 2020-2033 (USD Billion)
11. Global Brand Outlet Sports Apparel Market, By Region, 2020-2033 (USD Billion)
12. Global Discount Stores Sports Apparel Market, By Region, 2020-2033 (USD Billion)
13. Global Sports Apparel Market, By Region, 2020-2033 (USD Billion)
14. North America Sports Apparel Market, By Sport, 2020-2033 (USD Billion)
15. North America Sports Apparel Market, By End User, 2020-2033 (USD Billion)
16. North America Sports Apparel Market, By Distribution Channel, 2020-2033 (USD Billion)
17. U.S. Sports Apparel Market, By Sport, 2020-2033 (USD Billion)
18. U.S. Sports Apparel Market, By End User, 2020-2033 (USD Billion)
19. U.S. Sports Apparel Market, By Distribution Channel, 2020-2033 (USD Billion)
20. Canada Sports Apparel Market, By Sport, 2020-2033 (USD Billion)
21. Canada Sports Apparel Market, By End User, 2020-2033 (USD Billion)
22. Canada Sports Apparel Market, By Distribution Channel, 2020-2033 (USD Billion)
23. Mexico Sports Apparel Market, By Sport, 2020-2033 (USD Billion)
24. Mexico Sports Apparel Market, By End User, 2020-2033 (USD Billion)
25. Mexico Sports Apparel Market, By Distribution Channel, 2020-2033 (USD Billion)
26. Europe Sports Apparel Market, By Sport, 2020-2033 (USD Billion)
27. Europe Sports Apparel Market, By End User, 2020-2033 (USD Billion)
28. Europe Sports Apparel Market, By Distribution Channel, 2020-2033 (USD Billion)
29. Germany Sports Apparel Market, By Sport, 2020-2033 (USD Billion)
30. Germany Sports Apparel Market, By End User, 2020-2033 (USD Billion)
31. Germany Sports Apparel Market, By Distribution Channel, 2020-2033 (USD Billion)
32. France Sports Apparel Market, By Sport, 2020-2033 (USD Billion)
33. France Sports Apparel Market, By End User, 2020-2033 (USD Billion)
34. France Sports Apparel Market, By Distribution Channel, 2020-2033 (USD Billion)
35. U.K. Sports Apparel Market, By Sport, 2020-2033 (USD Billion)
36. U.K. Sports Apparel Market, By End User, 2020-2033 (USD Billion)
37. U.K. Sports Apparel Market, By Distribution Channel, 2020-2033 (USD Billion)
38. Italy Sports Apparel Market, By Sport, 2020-2033 (USD Billion)
39. Italy Sports Apparel Market, By End User, 2020-2033 (USD Billion)
40. Italy Sports Apparel Market, By Distribution Channel, 2020-2033 (USD Billion)
41. Spain Sports Apparel Market, By Sport, 2020-2033 (USD Billion)
42. Spain Sports Apparel Market, By End User, 2020-2033 (USD Billion)
43. Spain Sports Apparel Market, By Distribution Channel, 2020-2033 (USD Billion)
44. Asia Pacific Sports Apparel Market, By Sport, 2020-2033 (USD Billion)
45. Asia Pacific Sports Apparel Market, By End User, 2020-2033 (USD Billion)
46. Asia Pacific Sports Apparel Market, By Distribution Channel, 2020-2033 (USD Billion)
47. Japan Sports Apparel Market, By Sport, 2020-2033 (USD Billion)
48. Japan Sports Apparel Market, By End User, 2020-2033 (USD Billion)
49. Japan Sports Apparel Market, By Distribution Channel, 2020-2033 (USD Billion)
50. China Sports Apparel Market, By Sport, 2020-2033 (USD Billion)
51. China Sports Apparel Market, By End User, 2020-2033 (USD Billion)
52. China Sports Apparel Market, By Distribution Channel, 2020-2033 (USD Billion)
53. India Sports Apparel Market, By Sport, 2020-2033 (USD Billion)
54. India Sports Apparel Market, By End User, 2020-2033 (USD Billion)
55. India Sports Apparel Market, By Distribution Channel, 2020-2033 (USD Billion)
56. South America Sports Apparel Market, By Sport, 2020-2033 (USD Billion)
57. South America Sports Apparel Market, By End User, 2020-2033 (USD Billion)
58. South America Sports Apparel Market, By Distribution Channel, 2020-2033 (USD Billion)
59. Brazil Sports Apparel Market, By Sport, 2020-2033 (USD Billion)
60. Brazil Sports Apparel Market, By End User, 2020-2033 (USD Billion)
61. Brazil Sports Apparel Market, By Distribution Channel, 2020-2033 (USD Billion)
62. Middle East and Africa Sports Apparel Market, By Sport, 2020-2033 (USD Billion)
63. Middle East and Africa Sports Apparel Market, By End User, 2020-2033 (USD Billion)
64. Middle East and Africa Sports Apparel Market, By Distribution Channel, 2020-2033 (USD Billion)
65. UAE Sports Apparel Market, By Sport, 2020-2033 (USD Billion)
66. UAE Sports Apparel Market, By End User, 2020-2033 (USD Billion)
67. UAE Sports Apparel Market, By Distribution Channel, 2020-2033 (USD Billion)
68. South Africa Sports Apparel Market, By Sport, 2020-2033 (USD Billion)
69. South Africa Sports Apparel Market, By End User, 2020-2033 (USD Billion)
70. South Africa Sports Apparel Market, By Distribution Channel, 2020-2033 (USD Billion)
List of Figures
1. Global Sports Apparel Market Segmentation
2. Sports Apparel Market: Research Methodology
3. Market Size Estimation Methodology: Bottom-Up Approach
4. Market Size Estimation Methodology: Top-Down Approach
5. Data Triangulation
6. Porter’s Five Forces Analysis
7. Value Chain Analysis
8. Global Sports Apparel Market Attractiveness Analysis by Sport
9. Global Sports Apparel Market Attractiveness Analysis by End User
10. Global Sports Apparel Market Attractiveness Analysis by Distribution Channel
11. Global Sports Apparel Market Attractiveness Analysis by Region
12. Global Sports Apparel Market: Dynamics
13. Global Sports Apparel Market Share by Sport (2023 & 2033)
14. Global Sports Apparel Market Share by End User (2023 & 2033)
15. Global Sports Apparel Market Share by Distribution Channel (2023 & 2033)
16. Global Sports Apparel Market Share by Regions (2023 & 2033)
17. Global Sports Apparel Market Share by Company (2023)
This study forecasts revenue at global, regional, and country levels from 2020 to 2033. The Brainy Insights has segmented the global Sports Apparel market based on below mentioned segments:
Global Sports Apparel Market by Sport:
Global Sports Apparel Market by End User:
Global Sports Apparel Market by Distribution Channel:
Global Sports Apparel by Region:
Research has its special purpose to undertake marketing efficiently. In this competitive scenario, businesses need information across all industry verticals; the information about customer wants, market demand, competition, industry trends, distribution channels etc. This information needs to be updated regularly because businesses operate in a dynamic environment. Our organization, The Brainy Insights incorporates scientific and systematic research procedures in order to get proper market insights and industry analysis for overall business success. The analysis consists of studying the market from a miniscule level wherein we implement statistical tools which helps us in examining the data with accuracy and precision.
Our research reports feature both; quantitative and qualitative aspects for any market. Qualitative information for any market research process are fundamental because they reveal the customer needs and wants, usage and consumption for any product/service related to a specific industry. This in turn aids the marketers/investors in knowing certain perceptions of the customers. Qualitative research can enlighten about the different product concepts and designs along with unique service offering that in turn, helps define marketing problems and generate opportunities. On the other hand, quantitative research engages with the data collection process through interviews, e-mail interactions, surveys and pilot studies. Quantitative aspects for the market research are useful to validate the hypotheses generated during qualitative research method, explore empirical patterns in the data with the help of statistical tools, and finally make the market estimations.
The Brainy Insights offers comprehensive research and analysis, based on a wide assortment of factual insights gained through interviews with CXOs and global experts and secondary data from reliable sources. Our analysts and industry specialist assume vital roles in building up statistical tools and analysis models, which are used to analyse the data and arrive at accurate insights with exceedingly informative research discoveries. The data provided by our organization have proven precious to a diverse range of companies, facilitating them to address issues such as determining which products/services are the most appealing, whether or not customers use the product in the manner anticipated, the purchasing intentions of the market and many others.
Our research methodology encompasses an idyllic combination of primary and secondary initiatives. Key phases involved in this process are listed below:

The phase involves the gathering and collecting of market data and its related information with the help of different sources & research procedures.

The data procurement stage involves in data gathering and collecting through various data sources.
This stage involves in extensive research. These data sources includes:
Purchased Database: Purchased databases play a crucial role in estimating the market sizes irrespective of the domain. Our purchased database includes:
Primary Research: The Brainy Insights interacts with leading companies and experts of the concerned domain to develop the analyst team’s market understanding and expertise. It improves and substantiates every single data presented in the market reports. Primary research mainly involves in telephonic interviews, E-mail interactions and face-to-face interviews with the raw material providers, manufacturers/producers, distributors, & independent consultants. The interviews that we conduct provides valuable data on market size and industry growth trends prevailing in the market. Our organization also conducts surveys with the various industry experts in order to gain overall insights of the industry/market. For instance, in healthcare industry we conduct surveys with the pharmacists, doctors, surgeons and nurses in order to gain insights and key information of a medical product/device/equipment which the customers are going to usage. Surveys are conducted in the form of questionnaire designed by our own analyst team. Surveys plays an important role in primary research because surveys helps us to identify the key target audiences of the market. Additionally, surveys helps to identify the key target audience engaged with the market. Our survey team conducts the survey by targeting the key audience, thus gaining insights from them. Based on the perspectives of the customers, this information is utilized to formulate market strategies. Moreover, market surveys helps us to understand the current competitive situation of the industry. To be precise, our survey process typically involve with the 360 analysis of the market. This analytical process begins by identifying the prospective customers for a product or service related to the market/industry to obtain data on how a product/service could fit into customers’ lives.

Secondary Research: The secondary data sources includes information published by the on-profit organizations such as World bank, WHO, company fillings, investor presentations, annual reports, national government documents, statistical databases, blogs, articles, white papers and others. From the annual report, we analyse a company’s revenue to understand the key segment and market share of that organization in a particular region. We analyse the company websites and adopt the product mapping technique which is important for deriving the segment revenue. In the product mapping method, we select and categorize the products offered by the companies catering to domain specific market, deduce the product revenue for each of the companies so as to get overall estimation of the market size. We also source data and analyses trends based on information received from supply side and demand side intermediaries in the value chain. The supply side denotes the data gathered from supplier, distributor, wholesaler and the demand side illustrates the data gathered from the end customers for respective market domain.

The supply side for a domain specific market is analysed by:
The demand side for the market is estimated through:
In-house Library: Apart from these third-party sources, we have our in-house library of qualitative and quantitative information. Our in-house database includes market data for various industry and domains. These data are updated on regular basis as per the changing market scenario. Our library includes, historic databases, internal audit reports and archives.
Sometimes there are instances where there is no metadata or raw data available for any domain specific market. For those cases, we use our expertise to forecast and estimate the market size in order to generate comprehensive data sets. Our analyst team adopt a robust research technique in order to produce the estimates:
Data Synthesis: This stage involves the analysis & mapping of all the information obtained from the previous step. It also involves in scrutinizing the data for any discrepancy observed while data gathering related to the market. The data is collected with consideration to the heterogeneity of sources. Robust scientific techniques are in place for synthesizing disparate data sets and provide the essential contextual information that can orient market strategies. The Brainy Insights has extensive experience in data synthesis where the data passes through various stages:


Market Deduction & Formulation: The final stage comprises of assigning data points at appropriate market spaces so as to deduce feasible conclusions. Analyst perspective & subject matter expert based holistic form of market sizing coupled with industry analysis also plays a crucial role in this stage.
This stage involves in finalization of the market size and numbers that we have collected from data integration step. With data interpolation, it is made sure that there is no gap in the market data. Successful trend analysis is done by our analysts using extrapolation techniques, which provide the best possible forecasts for the market.
Data Validation & Market Feedback: Validation is the most important step in the process. Validation & re-validation via an intricately designed process helps us finalize data-points to be used for final calculations.

The Brainy Insights interacts with leading companies and experts of the concerned domain to develop the analyst team’s market understanding and expertise. It improves and substantiates every single data presented in the market reports. The data validation interview and discussion panels are typically composed of the most experienced industry members. The participants include, however, are not limited to:
Moreover, we always validate our data and findings through primary respondents from all the major regions we are working on.


Free Customization
Fortune 500 Clients
Free Yearly Update On Purchase Of Multi/Corporate License
Companies Served Till Date