- +1-315-215-1633
- sales@thebrainyinsights.com

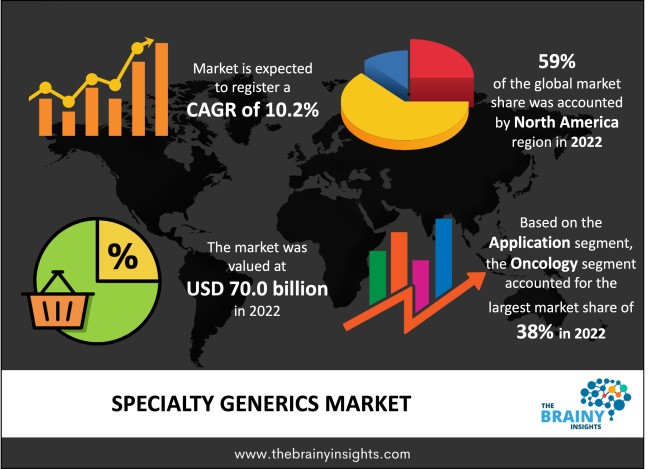
The global specialty generics market was valued at USD 70.0 billion in 2022, growing at a CAGR of 10.2% from 2023 to 2032. The market is expected to reach USD 184.8 billion by 2032. Factors such as rising illness prevalence and increasing patent expirations are predicted to boost market share. In recent years, the burden of chronic diseases such as cancer, cardiovascular disease, and arthritis, among others, has increased dramatically, putting a huge strain on people's healthcare budgets.
Speciality generics are low-cost generic copies of expensive brand-name speciality medications. These drugs treat complex, long-term illnesses, including cancer, rheumatoid arthritis, multiple sclerosis, and HIV. They differ from ordinary generics in that they are often biologic-based, necessitate particular handling and administration (commonly via injectables), and are frequently provided through restricted networks. Developing specialized generics involves particular hurdles because of the delicate nature of the molecules involved and the complex procedures required in their manufacture. As a result, the regulatory processes for their approval may be more strict than those for traditional generic pharmaceuticals. Furthermore, speciality generics have enormous promise in healthcare. They provide patients access to critical treatments at a lower cost while reducing the financial load on healthcare systems. The development of innovative distribution channels, such as online pharmacies and telemedicine platforms, has also expanded the speciality generics industry. These channels facilitate medicine access, ensuring that patients in even the most remote regions can acquire the required medications. In addition, government healthcare programmes and private payers are constantly looking for ways to curb rising healthcare costs. A main tactic is to emphasize using generic medications, particularly specialized generics. As a result, numerous governments and insurance companies are increasingly incentivizing or mandating the prescription of generics when they are available, driving demand. Furthermore, because specialized generics are less expensive, they have become the preferred choice for many in regions, ensuring that vital treatments are within reach of broader parts of the population.
Get an overview of this study by requesting a free sample
In March 2022, Nevakar Injectables Inc., a biopharmaceutical company developing multiple sterile injectable products for use in critical and ambulatory care settings, launched its ready-to-use Ephedrine Sulphate Injection, a formulation pre-diluted to a concentration of 5mg/mL and supplied in a 10mL vial.
In February 2022, Dr Reddy's Laboratories Ltd. launched the generic version of Par Pharmaceuticals VASOSTRICT (vasopressin injectable, USP) Vials, which has been approved by the US Food and Drug Administration (USFDA) for sale in the US market.
In April 2022, Dr Reddy's Laboratories announced methylprednisolone sodium succinate injectable for treating rheumatoid arthritis, blood issues, and select rare tumours in the United States.
In June 2022, Elixir launched its copay solutions improvement programme to control the cost of speciality generic pharmaceuticals. A qualifying patient can receive a free generic version of a specialty medicine through this programme.
Rising Prevalence of Cancers- The rising prevalence of cancers such as melanoma, lung, breast, leukaemia, prostate, and colon cancer has increased global demand for generic speciality medications. According to the International Agency for Research on Cancer (IARC), roughly 14 million cancer cases were diagnosed globally in 2012, and this figure is expected to climb in the coming years. As a result of the rising prevalence, there is a great need for low-cost generic pharmaceuticals that are less expensive and more effective than branded drugs.
Competition- Specialist generics have a more competitive market than conventional generics due to their sophisticated production needs, higher capital costs, and often lesser volumes due to a smaller patient base. This results in higher earnings than regular generics and a smaller price decline when compared to branded drugs. Prior authorization is usually required to acquire specialty generic medications and specific handling, administration, and monitoring.
Rising Cancer Patients- The increasing number of cancer patients is expected to boost global market growth. According to the World Health Organisation (WHO), roughly 160,000 people in the United States were diagnosed with cancer in 2015. As a result of the rising prevalence of cancer cases requiring medications, the global speciality generic drugs market is expected to develop.
The regions analyzed for the market include North America, Europe, South America, Asia Pacific, the Middle East, and Africa. North America emerged as the largest global specialty generics market, with a 59% market revenue share in 2022.
The North American speciality injectable generics market is predicted to develop throughout the forecast period due to the country's high chronic disease burden, rising geriatric population, and new product releases by key industry participants. For example, according to the National Centre for Chronic Disease Prevention and Health Promotion (January 2021), 6 in 10 adults in the United States have a chronic disease, and 4 in 10 adults have two or more chronic diseases. These conditions cost the country's healthcare system around USD 3.8 trillion annually, even though generic drugs are much cheaper than other prescribed drugs. As a result, the widespread use of generic medications in the country can drastically lower healthcare expenditures, which is predicted to have a considerable impact on the growth of the analyzed market.
North America Region Specialty Generics Market Share in 2022 - 59%
www.thebrainyinsights.com
Check the geographical analysis of this market by requesting a free sample
The end-user segment is divided into specialty pharmacy, retail pharmacy, and hospital pharmacy. The specialty pharmacy segment dominated, with a market share of around 42% in 2022. The market is expected to increase at a lucrative rate over the forecast period. Because of reduced distribution costs and easy drug access, major specialty generic manufacturers and insurance companies choose specialty pharmacies to distribute their products. According to the drug Channels Institute's analysis from 2021, the top five specialty pharmacies in the globe are CVS speciality, Accredo, Optum specialty pharmacy, Walgreens stores, and Humana specialty pharmacy.
The application segment is divided into oncology, cardiovascular, infectious diseases, central nervous systems, autoimmune disorders, and others. The oncology segment dominated, with a market share of around 38% in 2022. The expanding global burden of cancer, the increasing need for effective therapeutic medications to treat cancer, and pharmaceutical companies' increased focus on producing effective drugs are all factors driving the rise of the oncology industry. According to GLOBOCAN 2020, there were 19.3 million predicted new cancer cases worldwide in 2020, expected to rise to 30.2 million by 2040. As a result, the predicted increase in cancer burden is a major element leading to increased demand for generic pharmaceuticals, supporting market growth.
| Attribute | Description |
|---|---|
| Market Size | Revenue (USD Billion) |
| Market size value in 2022 | USD 70.0 Billion |
| Market size value in 2032 | USD 184.8 Billion |
| CAGR (2023 to 2032) | 10.2% |
| Historical data | 2019-2021 |
| Base Year | 2022 |
| Forecast | 2023-2032 |
| Region | The regions analyzed for the market are Asia Pacific, Europe, South America, North America, and Middle East & Africa. Furthermore, the regions are further analyzed at the country level. |
| Segments | End-User, Application |
As per The Brainy Insights, the size of the specialty generics market was valued at USD 70.0 billion in 2022 to USD 184.8 billion by 2032.
The global specialty generics market is growing at a CAGR of 10.2% during the forecast period 2023-2032.
North America emerged as the largest specialty generics market.
1. Introduction
1.1. Objectives of the Study
1.2. Market Definition
1.3. Research Scope
1.4. Currency
1.5. Key Target Audience
2. Research Methodology and Assumptions
3. Executive Summary
4. Premium Insights
4.1. Porter’s Five Forces Analysis
4.2. Value Chain Analysis
4.3. Top Investment Pockets
4.3.1. Market Attractiveness Analysis by End-User
4.3.2. Market Attractiveness Analysis by Application
4.3.3. Market Attractiveness Analysis by Region
4.4. Industry Trends
5. Market Dynamics
5.1. Market Evaluation
5.2. Drivers
5.2.1. Rising prevalence of cancers
5.3. Restraints
5.3.1. Competition
5.4. Opportunities
5.4.1. Rising cancer patients
5.5. Challenges
5.5.1. Undesirable effect
6. Global Specialty Generics Market Analysis and Forecast, By End-User
6.1. Segment Overview
6.2. Specialty Pharmacy
6.3. Retail Pharmacy
6.4. Hospital Pharmacy
7. Global Specialty Generics Market Analysis and Forecast, By Application
7.1. Segment Overview
7.2. Oncology
7.3. Cardiovascular
7.4. Infectious Diseases
7.5. Central Nervous Systems
7.6. Autoimmune Disorders
7.7. Others
8. Global Specialty Generics Market Analysis and Forecast, By Regional Analysis
8.1. Segment Overview
8.2. North America
8.2.1. U.S.
8.2.2. Canada
8.2.3. Mexico
8.3. Europe
8.3.1. Germany
8.3.2. France
8.3.3. U.K.
8.3.4. Italy
8.3.5. Spain
8.4. Asia-Pacific
8.4.1. Japan
8.4.2. China
8.4.3. India
8.5. South America
8.5.1. Brazil
8.6. Middle East and Africa
8.6.1. UAE
8.6.2. South Africa
9. Global Specialty Generics Market-Competitive Landscape
9.1. Overview
9.2. Market Share of Key Players in Global Specialty Generics Market
9.2.1. Global Company Market Share
9.2.2. North America Company Market Share
9.2.3. Europe Company Market Share
9.2.4. APAC Company Market Share
9.3. Competitive Situations and Trends
9.3.1. Product Launches and Developments
9.3.2. Partnerships, Collaborations, and Agreements
9.3.3. Mergers & Acquisitions
9.3.4. Expansions
10. Company Profiles
10.1. Teva Pharmaceuticals Industries Ltd
10.1.1. Business Overview
10.1.2. Company Snapshot
10.1.3. Company Market Share Analysis
10.1.4. Company Product Portfolio
10.1.5. Recent Developments
10.1.6. SWOT Analysis
10.2. Viatris Inc.
10.2.1. Business Overview
10.2.2. Company Snapshot
10.2.3. Company Market Share Analysis
10.2.4. Company Product Portfolio
10.2.5. Recent Developments
10.2.6. SWOT Analysis
10.3. Novartis AG (Sandoz International GmbH)
10.3.1. Business Overview
10.3.2. Company Snapshot
10.3.3. Company Market Share Analysis
10.3.4. Company Product Portfolio
10.3.5. Recent Developments
10.3.6. SWOT Analysis
10.4. Hikma Pharmaceuticals PLC
10.4.1. Business Overview
10.4.2. Company Snapshot
10.4.3. Company Market Share Analysis
10.4.4. Company Product Portfolio
10.4.5. Recent Developments
10.4.6. SWOT Analysis
10.5. Mallinckrodt
10.5.1. Business Overview
10.5.2. Company Snapshot
10.5.3. Company Market Share Analysis
10.5.4. Company Product Portfolio
10.5.5. Recent Developments
10.5.6. SWOT Analysis
10.6. Bausch Health Companies Inc. (Valeant Pharmaceuticals International, Inc.)
10.6.1. Business Overview
10.6.2. Company Snapshot
10.6.3. Company Market Share Analysis
10.6.4. Company Product Portfolio
10.6.5. Recent Developments
10.6.6. SWOT Analysis
10.7. Dr. Reddy’s Laboratories Ltd.
10.7.1. Business Overview
10.7.2. Company Snapshot
10.7.3. Company Market Share Analysis
10.7.4. Company Product Portfolio
10.7.5. Recent Developments
10.7.6. SWOT Analysis
10.8. Endo Pharmaceuticals Inc.
10.8.1. Business Overview
10.8.2. Company Snapshot
10.8.3. Company Market Share Analysis
10.8.4. Company Product Portfolio
10.8.5. Recent Developments
10.8.6. SWOT Analysis
10.9. Apotex Corp.
10.9.1. Business Overview
10.9.2. Company Snapshot
10.9.3. Company Market Share Analysis
10.9.4. Company Product Portfolio
10.9.5. Recent Developments
10.9.6. SWOT Analysis
10.10. Sun Pharmaceutical Industries Ltd
10.10.1. Business Overview
10.10.2. Company Snapshot
10.10.3. Company Market Share Analysis
10.10.4. Company Product Portfolio
10.10.5. Recent Developments
10.10.6. SWOT Analysis
10.11. Fresenius Kabi Brasil Ltda
10.11.1. Business Overview
10.11.2. Company Snapshot
10.11.3. Company Market Share Analysis
10.11.4. Company Product Portfolio
10.11.5. Recent Developments
10.11.6. SWOT Analysis
10.12. STADA Arzneimittel AG
10.12.1. Business Overview
10.12.2. Company Snapshot
10.12.3. Company Market Share Analysis
10.12.4. Company Product Portfolio
10.12.5. Recent Developments
10.12.6. SWOT Analysis
List of Table
1. Global Specialty Generics Market, By End-User, 2019-2032 (USD Billion)
2. Global Specialty Pharmacy, Specialty Generics Market, By Region, 2019-2032 (USD Billion)
3. Global Retail Pharmacy, Specialty Generics Market, By Region, 2019-2032 (USD Billion)
4. Global Hospital Pharmacy, Specialty Generics Market, By Region, 2019-2032 (USD Billion)
5. Global Specialty Generics Market, By Application, 2019-2032 (USD Billion)
6. Global Oncology, Specialty Generics Market, By Region, 2019-2032 (USD Billion)
7. Global Cardiovascular, Specialty Generics Market, By Region, 2019-2032 (USD Billion)
8. Global Infectious Diseases, Specialty Generics Market, By Region, 2019-2032 (USD Billion)
9. Global Central Nervous Systems, Specialty Generics Market, By Region, 2019-2032 (USD Billion)
10. Global Autoimmune Disorders, Specialty Generics Market, By Region, 2019-2032 (USD Billion)
11. Global Others, Specialty Generics Market, By Region, 2019-2032 (USD Billion)
12. North America Specialty Generics Market, By End-User, 2019-2032 (USD Billion)
13. North America Specialty Generics Market, By Application, 2019-2032 (USD Billion)
14. U.S. Specialty Generics Market, By End-User, 2019-2032 (USD Billion)
15. U.S. Specialty Generics Market, By Application, 2019-2032 (USD Billion)
16. Canada Specialty Generics Market, By End-User, 2019-2032 (USD Billion)
17. Canada Specialty Generics Market, By Application, 2019-2032 (USD Billion)
18. Mexico Specialty Generics Market, By End-User, 2019-2032 (USD Billion)
19. Mexico Specialty Generics Market, By Application, 2019-2032 (USD Billion)
20. Europe Specialty Generics Market, By End-User, 2019-2032 (USD Billion)
21. Europe Specialty Generics Market, By Application, 2019-2032 (USD Billion)
22. Germany Specialty Generics Market, By End-User, 2019-2032 (USD Billion)
23. Germany Specialty Generics Market, By Application, 2019-2032 (USD Billion)
24. France Specialty Generics Market, By End-User, 2019-2032 (USD Billion)
25. France Specialty Generics Market, By Application, 2019-2032 (USD Billion)
26. U.K. Specialty Generics Market, By End-User, 2019-2032 (USD Billion)
27. U.K. Specialty Generics Market, By Application, 2019-2032 (USD Billion)
28. Italy Specialty Generics Market, By End-User, 2019-2032 (USD Billion)
29. Italy Specialty Generics Market, By Application, 2019-2032 (USD Billion)
30. Spain Specialty Generics Market, By End-User, 2019-2032 (USD Billion)
31. Spain Specialty Generics Market, By Application, 2019-2032 (USD Billion)
32. Asia Pacific Specialty Generics Market, By End-User, 2019-2032 (USD Billion)
33. Asia Pacific Specialty Generics Market, By Application, 2019-2032 (USD Billion)
34. Japan Specialty Generics Market, By End-User, 2019-2032 (USD Billion)
35. Japan Specialty Generics Market, By Application, 2019-2032 (USD Billion)
36. China Specialty Generics Market, By End-User, 2019-2032 (USD Billion)
37. China Specialty Generics Market, By Application, 2019-2032 (USD Billion)
38. India Specialty Generics Market, By End-User, 2019-2032 (USD Billion)
39. India Specialty Generics Market, By Application, 2019-2032 (USD Billion)
40. South America Specialty Generics Market, By End-User, 2019-2032 (USD Billion)
41. South America Specialty Generics Market, By Application, 2019-2032 (USD Billion)
42. Brazil Specialty Generics Market, By End-User, 2019-2032 (USD Billion)
43. Brazil Specialty Generics Market, By Application, 2019-2032 (USD Billion)
44. Middle East and Africa Specialty Generics Market, By End-User, 2019-2032 (USD Billion)
45. Middle East and Africa Specialty Generics Market, By Application, 2019-2032 (USD Billion)
46. UAE Specialty Generics Market, By End-User, 2019-2032 (USD Billion)
47. UAE Specialty Generics Market, By Application, 2019-2032 (USD Billion)
48. South Africa Specialty Generics Market, By End-User, 2019-2032 (USD Billion)
49. South Africa Specialty Generics Market, By Application, 2019-2032 (USD Billion)
List of Figures
1. Global Specialty Generics Market Segmentation
2. Global Specialty Generics Market: Research Methodology
3. Market Size Estimation Methodology: Bottom-Up Approach
4. Market Size Estimation Methodology: Top-Down Approach
5. Data Triangulation
6. Porter’s Five Forces Analysis
7. Value Chain Analysis
8. Global Specialty Generics Market Attractiveness Analysis by End-User
9. Global Specialty Generics Market Attractiveness Analysis by Application
10. Global Specialty Generics Market Attractiveness Analysis by Region
11. Global Specialty Generics Market: Dynamics
12. Global Specialty Generics Market Share by End-User (2023 & 2032)
13. Global Specialty Generics Market Share by Application (2023 & 2032)
14. Global Specialty Generics Market Share by Regions (2023 & 2032)
15. Global Specialty Generics Market Share by Company (2022)
This study forecasts global, regional, and country revenue from 2019 to 2032. The Brainy Insights has segmented the global specialty generics market based on the below-mentioned segments:
Global Specialty Generics Market By End-User:
Global Specialty Generics Market By Application:
Global Specialty Generics Market By Region:
Research has its special purpose to undertake marketing efficiently. In this competitive scenario, businesses need information across all industry verticals; the information about customer wants, market demand, competition, industry trends, distribution channels etc. This information needs to be updated regularly because businesses operate in a dynamic environment. Our organization, The Brainy Insights incorporates scientific and systematic research procedures in order to get proper market insights and industry analysis for overall business success. The analysis consists of studying the market from a miniscule level wherein we implement statistical tools which helps us in examining the data with accuracy and precision.
Our research reports feature both; quantitative and qualitative aspects for any market. Qualitative information for any market research process are fundamental because they reveal the customer needs and wants, usage and consumption for any product/service related to a specific industry. This in turn aids the marketers/investors in knowing certain perceptions of the customers. Qualitative research can enlighten about the different product concepts and designs along with unique service offering that in turn, helps define marketing problems and generate opportunities. On the other hand, quantitative research engages with the data collection process through interviews, e-mail interactions, surveys and pilot studies. Quantitative aspects for the market research are useful to validate the hypotheses generated during qualitative research method, explore empirical patterns in the data with the help of statistical tools, and finally make the market estimations.
The Brainy Insights offers comprehensive research and analysis, based on a wide assortment of factual insights gained through interviews with CXOs and global experts and secondary data from reliable sources. Our analysts and industry specialist assume vital roles in building up statistical tools and analysis models, which are used to analyse the data and arrive at accurate insights with exceedingly informative research discoveries. The data provided by our organization have proven precious to a diverse range of companies, facilitating them to address issues such as determining which products/services are the most appealing, whether or not customers use the product in the manner anticipated, the purchasing intentions of the market and many others.
Our research methodology encompasses an idyllic combination of primary and secondary initiatives. Key phases involved in this process are listed below:

The phase involves the gathering and collecting of market data and its related information with the help of different sources & research procedures.

The data procurement stage involves in data gathering and collecting through various data sources.
This stage involves in extensive research. These data sources includes:
Purchased Database: Purchased databases play a crucial role in estimating the market sizes irrespective of the domain. Our purchased database includes:
Primary Research: The Brainy Insights interacts with leading companies and experts of the concerned domain to develop the analyst team’s market understanding and expertise. It improves and substantiates every single data presented in the market reports. Primary research mainly involves in telephonic interviews, E-mail interactions and face-to-face interviews with the raw material providers, manufacturers/producers, distributors, & independent consultants. The interviews that we conduct provides valuable data on market size and industry growth trends prevailing in the market. Our organization also conducts surveys with the various industry experts in order to gain overall insights of the industry/market. For instance, in healthcare industry we conduct surveys with the pharmacists, doctors, surgeons and nurses in order to gain insights and key information of a medical product/device/equipment which the customers are going to usage. Surveys are conducted in the form of questionnaire designed by our own analyst team. Surveys plays an important role in primary research because surveys helps us to identify the key target audiences of the market. Additionally, surveys helps to identify the key target audience engaged with the market. Our survey team conducts the survey by targeting the key audience, thus gaining insights from them. Based on the perspectives of the customers, this information is utilized to formulate market strategies. Moreover, market surveys helps us to understand the current competitive situation of the industry. To be precise, our survey process typically involve with the 360 analysis of the market. This analytical process begins by identifying the prospective customers for a product or service related to the market/industry to obtain data on how a product/service could fit into customers’ lives.

Secondary Research: The secondary data sources includes information published by the on-profit organizations such as World bank, WHO, company fillings, investor presentations, annual reports, national government documents, statistical databases, blogs, articles, white papers and others. From the annual report, we analyse a company’s revenue to understand the key segment and market share of that organization in a particular region. We analyse the company websites and adopt the product mapping technique which is important for deriving the segment revenue. In the product mapping method, we select and categorize the products offered by the companies catering to domain specific market, deduce the product revenue for each of the companies so as to get overall estimation of the market size. We also source data and analyses trends based on information received from supply side and demand side intermediaries in the value chain. The supply side denotes the data gathered from supplier, distributor, wholesaler and the demand side illustrates the data gathered from the end customers for respective market domain.

The supply side for a domain specific market is analysed by:
The demand side for the market is estimated through:
In-house Library: Apart from these third-party sources, we have our in-house library of qualitative and quantitative information. Our in-house database includes market data for various industry and domains. These data are updated on regular basis as per the changing market scenario. Our library includes, historic databases, internal audit reports and archives.
Sometimes there are instances where there is no metadata or raw data available for any domain specific market. For those cases, we use our expertise to forecast and estimate the market size in order to generate comprehensive data sets. Our analyst team adopt a robust research technique in order to produce the estimates:
Data Synthesis: This stage involves the analysis & mapping of all the information obtained from the previous step. It also involves in scrutinizing the data for any discrepancy observed while data gathering related to the market. The data is collected with consideration to the heterogeneity of sources. Robust scientific techniques are in place for synthesizing disparate data sets and provide the essential contextual information that can orient market strategies. The Brainy Insights has extensive experience in data synthesis where the data passes through various stages:


Market Deduction & Formulation: The final stage comprises of assigning data points at appropriate market spaces so as to deduce feasible conclusions. Analyst perspective & subject matter expert based holistic form of market sizing coupled with industry analysis also plays a crucial role in this stage.
This stage involves in finalization of the market size and numbers that we have collected from data integration step. With data interpolation, it is made sure that there is no gap in the market data. Successful trend analysis is done by our analysts using extrapolation techniques, which provide the best possible forecasts for the market.
Data Validation & Market Feedback: Validation is the most important step in the process. Validation & re-validation via an intricately designed process helps us finalize data-points to be used for final calculations.

The Brainy Insights interacts with leading companies and experts of the concerned domain to develop the analyst team’s market understanding and expertise. It improves and substantiates every single data presented in the market reports. The data validation interview and discussion panels are typically composed of the most experienced industry members. The participants include, however, are not limited to:
Moreover, we always validate our data and findings through primary respondents from all the major regions we are working on.


Free Customization
Fortune 500 Clients
Free Yearly Update On Purchase Of Multi/Corporate License
Companies Served Till Date