- +1-315-215-1633
- sales@thebrainyinsights.com

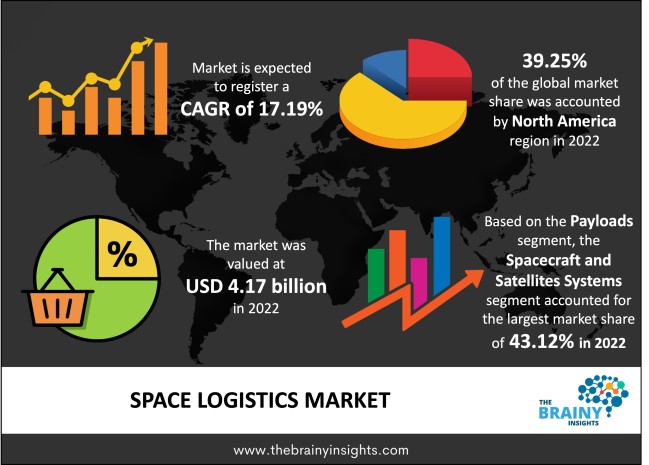
The global space logistics market was valued at USD 4.17 billion in 2022 and growing at a CAGR of 17.19% from 2023 to 2032. The market is expected to reach USD 20.38 billion by 2032. The growing expenditure of the government on space exploration and development in scientific research is propelling market growth.
Space logistics, known as space supply chain management or space transportation, involves the transportation & management of goods, tools, and people to and from space. Space logistics is "the practice & theory of driving space system design for operability & supportability, and managing the flow of services, material, and information required throughout a space method lifecycle." Space logistics contains terrestrial logistics in support of space travel, containing any additional "design & development, storage, acquisition, movement, maintenance, evacuation, distribution, and disposition of space materiel", movement of people in space, and contracting & supplying any necessary support services for maintaining space travel.
Get an overview of this study by requesting a free sample
The increase in demand for LEO-based satellite services: The increasing investment by private companies and the rising demand for satellite launches, space exploration, and other space-based activities are driving the market growth. The increasing demand for internet connections through mobile & fixed broadband networks is also helping to boost the market growth. Moreover, local service providers can raise their networks regarding service range & geographic reach, and permitting local services to be supplied over a global network is also propelling the market growth. The rising demand for LEO-based spacecraft & missions will promote market growth over the forecast period.
The high cost: The high cost of space logistics and the heightened emissions due to the increasing number of space launches & interoperability issues stifles are hindering the market growth. Furthermore, a shortage of skilled labour & a lack of adaptability to new technology is anticipated to hamper the market growth.
The introduction of commercial space travel: The increasing interest in developing space-based manufacturing, space tourism, and space mining creates an opportunity factor for market growth. Moreover, the introduction of commercial space travel is helping to boost the market growth. Additionally, the growing need for improved abilities in weather services webs, the development of SSA devices, and the need for surveillance and tracking to ensure satellites perform properly are also helping to boost the market growth.
The regions analyzed for the market include North America, Europe, South America, Asia Pacific, the Middle East, and Africa. North America emerged as the largest market for the global space logistics market, with a 39.25% share of the market revenue in 2022. North America dominates the space logistics market due to the presence of key players. Moreover, the demand for LEO-based satellite services and increasing regulations and standardization of space travel are also helping boost the region's market growth. The Asia Pacific is expected to grow the fastest during the forecast period due to the increased investment in space exploration and commercial activities by countries such as India, China, and Japan. Also, an increasing number of space flights to the ISS, increasing military budgets, and high investment in space travel missions are expected to propel the market growth in this region.
North America Region Space Logistics Market Share in 2022 - 39.25%
www.thebrainyinsights.com
Check the geographical analysis of this market by requesting a free sample
The payloads segment is divided into cargo and material, spacecraft and satellites systems, and others. The spacecraft and satellites systems segment dominated the market, with a market share of around 43.12% in 2022 due to the increasing need for remote sensing, data connectivity, and global positioning services. The emergence of new applications, such as asteroid mining, is also helping to boost the segment's market growth.
The operation segment is divided into on-orbit servicing assembly and manufacturing, active debris removal, last-mile logistics, space exploration, and space situational awareness. The space situational awareness segment dominated the market, with a share of around 23.13% in 2022. This growth is attributed to the rising need for lower earth orbit services. Moreover, space situational awareness contains the tracking & monitoring of objects in space, including debris, active satellites, and other things that pose a risk to spacecraft. The presence of hazardous debris & the constant addition of recently built space systems result in a complex & congested environment. Due to raised congestion, satellite operators & government agencies must improve their situational awareness abilities to adapt virtually to these operations' changing nature.
| Attribute | Description |
|---|---|
| Market Size | Revenue (USD Billion) |
| Market size value in 2022 | USD 4.17 Billion |
| Market size value in 2032 | USD 20.38 Billion |
| CAGR (2023 to 2032) | 17.19% |
| Historical data | 2019-2021 |
| Base Year | 2022 |
| Forecast | 2023-2032 |
| Regional Segments | The regions analyzed for the market are Asia Pacific, Europe, South America, North America, and Middle East & Africa. Furthermore, the regions are further analyzed at the country level. |
| Segments | Payloads, Operation, Motion Type |
As per The Brainy Insights, the size of the space logistics market was valued at 4.17 Billion in 2021 to USD 20.38 Billion by 2030.
Global space logistics market is growing at a CAGR of 17.19% during the forecast period 2022-2030.
The global space logistics market has been segmented based on payloads, operation, and regions. The spacecraft and satellites systems segment led payloads segment in 2021. The space situational awareness segment led the operation segment in 2021.
North America region emerged as the largest market for the space logistics.
1. Introduction
1.1. Objectives of the Study
1.2. Market Definition
1.3. Research Scope
1.4. Currency
1.5. Key Target Audience
2. Research Methodology and Assumptions
3. Executive Summary
4. Premium Insights
4.1. Porter’s Five Forces Analysis
4.2. Value Chain Analysis
4.3. Top Investment Pockets
4.3.1. Market Attractiveness Analysis By Payloads
4.3.2. Market Attractiveness Analysis By Operation
4.3.3. Market Attractiveness Analysis By Region
4.4. Industry Trends
5. Market Dynamics
5.1. Market Evaluation
5.2. Market Evaluation
5.3. Drivers
5.3.1. The inclination of high-net-worth individuals toward space tourism
5.3.2. The ever-rising advancements in technology
5.3.3. The increasing space exploration missions and rise in space stations
5.4. Restraints
5.4.1. The interoperability issues
5.4.2. The high cost
5.5. Opportunities
5.5.1. The introduction of commercial space travel
5.5.2. The growing space debris removal services
6. Global Space Logistics Market Analysis and Forecast, By Payloads
6.1. Segment Overview
6.2. Cargo and Material
6.3. Spacecraft and Satellites Systems
6.4. Others
7. Global Space Logistics Market Analysis and Forecast, By Operation
7.1. Segment Overview
7.2. On-Orbit Servicing Assembly and Manufacturing
7.3. Active Debris Removal
7.4. Last Mile Logistics
7.5. Space Exploration
7.6. Space Situational Awareness
8. Global Space Logistics Market Analysis and Forecast, By Regional Analysis
8.1. Segment Overview
8.2. North America
8.2.1. U.S.
8.2.2. Canada
8.2.3. Mexico
8.3. Europe
8.3.1. Germany
8.3.2. France
8.3.3. U.K.
8.3.4. Italy
8.3.5. Spain
8.4. Asia-Pacific
8.4.1. Japan
8.4.2. China
8.4.3. India
8.5. South America
8.5.1. Brazil
8.6. Middle East and Africa
8.6.1. UAE
8.6.2. South Africa
9. Global Space Logistics Market-Competitive Landscape
9.1. Overview
9.2. Market Share of Key Players in Global Space Logistics Market
9.2.1. Global Company Market Share
9.2.2. North America Company Market Share
9.2.3. Europe Company Market Share
9.2.4. APAC Company Market Share
9.3. Competitive Situations and Trends
9.3.1. Product Launches and Developments
9.3.2. Partnerships, Collaborations, and Agreements
9.3.3. Mergers & Acquisitions
9.3.4. Expansions
10. Company Profiles
10.1. Airbus Defense and Space
10.1.1. Business Overview
10.1.2. Company Snapshot
10.1.3. Company Market Share Analysis
10.1.4. Company Product Portfolio
10.1.5. Recent Developments
10.1.6. SWOT Analysis
10.2. Boeing
10.2.1. Business Overview
10.2.2. Company Snapshot
10.2.3. Company Market Share Analysis
10.2.4. Company Product Portfolio
10.2.5. Recent Developments
10.2.6. SWOT Analysis
10.3. Northrop Grumman
10.3.1. Business Overview
10.3.2. Company Snapshot
10.3.3. Company Market Share Analysis
10.3.4. Company Product Portfolio
10.3.5. Recent Developments
10.3.6. SWOT Analysis
10.4. Lockheed Martin
10.4.1. Business Overview
10.4.2. Company Snapshot
10.4.3. Company Market Share Analysis
10.4.4. Company Product Portfolio
10.4.5. Recent Developments
10.4.6. SWOT Analysis
10.5. Orbital ATK
10.5.1. Business Overview
10.5.2. Company Snapshot
10.5.3. Company Market Share Analysis
10.5.4. Company Product Portfolio
10.5.5. Recent Developments
10.5.6. SWOT Analysis
10.6. Blue Origin
10.6.1. Business Overview
10.6.2. Company Snapshot
10.6.3. Company Market Share Analysis
10.6.4. Company Product Portfolio
10.6.5. Recent Developments
10.6.6. SWOT Analysis
10.7. Space Exploration Technologies (SpaceX)
10.7.1. Business Overview
10.7.2. Company Snapshot
10.7.3. Company Market Share Analysis
10.7.4. Company Product Portfolio
10.7.5. Recent Developments
10.7.6. SWOT Analysis
10.8. Sierra Nevada Corporation
10.8.1. Business Overview
10.8.2. Company Snapshot
10.8.3. Company Market Share Analysis
10.8.4. Company Product Portfolio
10.8.5. Recent Developments
10.8.6. SWOT Analysis
10.9. Mitsubishi Heavy Industries
10.9.1. Business Overview
10.9.2. Company Snapshot
10.9.3. Company Market Share Analysis
10.9.4. Company Product Portfolio
10.9.5. Recent Developments
10.9.6. SWOT Analysis
10.10. Thales Alenia Space
10.10.1. Business Overview
10.10.2. Company Snapshot
10.10.3. Company Market Share Analysis
10.10.4. Company Product Portfolio
10.10.5. Recent Developments
10.10.6. SWOT Analysis
10.11. Honeywell International
10.11.1. Business Overview
10.11.2. Company Snapshot
10.11.3. Company Market Share Analysis
10.11.4. Company Product Portfolio
10.11.5. Recent Developments
10.11.6. SWOT Analysis
10.12. Dynetics
10.12.1. Business Overview
10.12.2. Company Snapshot
10.12.3. Company Market Share Analysis
10.12.4. Company Product Portfolio
10.12.5. Recent Developments
10.12.6. SWOT Analysis
10.13. Virgin Galactic
10.13.1. Business Overview
10.13.2. Company Snapshot
10.13.3. Company Market Share Analysis
10.13.4. Company Product Portfolio
10.13.5. Recent Developments
10.13.6. SWOT Analysis
10.14. Rocket Lab
10.14.1. Business Overview
10.14.2. Company Snapshot
10.14.3. Company Market Share Analysis
10.14.4. Company Product Portfolio
10.14.5. Recent Developments
10.14.6. SWOT Analysis
10.15. Arianespace
10.15.1. Business Overview
10.15.2. Company Snapshot
10.15.3. Company Market Share Analysis
10.15.4. Company Product Portfolio
10.15.5. Recent Developments
10.15.6. SWOT Analysis
10.16. RUAG Space
10.16.1. Business Overview
10.16.2. Company Snapshot
10.16.3. Company Market Share Analysis
10.16.4. Company Product Portfolio
10.16.5. Recent Developments
10.16.6. SWOT Analysis
10.17. NanoRacks
10.17.1. Business Overview
10.17.2. Company Snapshot
10.17.3. Company Market Share Analysis
10.17.4. Company Product Portfolio
10.17.5. Recent Developments
10.17.6. SWOT Analysis
10.18. Bigelow Aerospace
10.18.1. Business Overview
10.18.2. Company Snapshot
10.18.3. Company Market Share Analysis
10.18.4. Company Product Portfolio
10.18.5. Recent Developments
10.18.6. SWOT Analysis
10.19. Astrobotic Technology
10.19.1. Business Overview
10.19.2. Company Snapshot
10.19.3. Company Market Share Analysis
10.19.4. Company Product Portfolio
10.19.5. Recent Developments
10.19.6. SWOT Analysis
List of Table
1. Global Space Logistics Market, By Payloads, 2019-2032 (USD Billion)
2. Global Cargo and Material, Space Logistics Market, By Region, 2019-2032 (USD Billion)
3. Global Spacecraft and Satellites Systems, Space Logistics Market, By Region, 2019-2032 (USD Billion)
4. Global Others, Space Logistics Market, By Region, 2019-2032 (USD Billion)
5. Global Space Logistics Market, By Operation, 2019-2032 (USD Billion)
6. Global On-Orbit Servicing Assembly and Manufacturing, Space Logistics Market, By Region, 2019-2032 (USD Billion)
7. Global Active Debris Removal, Space Logistics Market, By Region, 2019-2032 (USD Billion)
8. Global Last Mile Logistics, Space Logistics Market, By Region, 2019-2032 (USD Billion)
9. Global Space Exploration, Space Logistics Market, By Region, 2019-2032 (USD Billion)
10. Global Space Situational Awareness, Space Logistics Market, By Region, 2019-2032 (USD Billion)
11. North America Space Logistics Market, By Payloads, 2019-2032 (USD Billion)
12. North America Space Logistics Market, By Operation, 2019-2032 (USD Billion)
13. U.S. Space Logistics Market, By Payloads, 2019-2032 (USD Billion)
14. U.S. Space Logistics Market, By Operation, 2019-2032 (USD Billion)
15. Canada Space Logistics Market, By Payloads, 2019-2032 (USD Billion)
16. Canada Space Logistics Market, By Operation, 2019-2032 (USD Billion)
17. Mexico Space Logistics Market, By Payloads, 2019-2032 (USD Billion)
18. Mexico Space Logistics Market, By Operation, 2019-2032 (USD Billion)
19. Europe Space Logistics Market, By Payloads, 2019-2032 (USD Billion)
20. Europe Space Logistics Market, By Operation, 2019-2032 (USD Billion)
21. Germany Space Logistics Market, By Payloads, 2019-2032 (USD Billion)
22. Germany Space Logistics Market, By Operation, 2019-2032 (USD Billion)
23. France Space Logistics Market, By Payloads, 2019-2032 (USD Billion)
24. France Space Logistics Market, By Operation 2019-2032 (USD Billion)
25. U.K. Space Logistics Market, By Payloads, 2019-2032 (USD Billion)
26. U.K. Space Logistics Market, By Operation 2019-2032 (USD Billion)
27. Italy Space Logistics Market, By Payloads, 2019-2032 (USD Billion)
28. Italy Space Logistics Market, By Operation 2019-2032 (USD Billion)
29. Spain Space Logistics Market, By Payloads, 2019-2032 (USD Billion)
30. Spain Space Logistics Market, By Operation 2019-2032 (USD Billion)
31. Asia Pacific Space Logistics Market, By Payloads, 2019-2032 (USD Billion)
32. Asia Pacific Space Logistics Market, By Operation 2019-2032 (USD Billion)
33. Japan Space Logistics Market, By Payloads, 2019-2032 (USD Billion)
34. Japan Space Logistics Market, By Operation 2019-2032 (USD Billion)
35. China Space Logistics Market, By Payloads, 2019-2032 (USD Billion)
36. China Space Logistics Market, By Operation 2019-2032 (USD Billion)
37. India Space Logistics Market, By Payloads, 2019-2032 (USD Billion)
38. India Space Logistics Market, By Operation 2019-2032 (USD Billion)
39. South America Space Logistics Market, By Payloads, 2019-2032 (USD Billion)
40. South America Space Logistics Market, By Operation 2019-2032 (USD Billion)
41. Brazil Space Logistics Market, By Payloads, 2019-2032 (USD Billion)
42. Brazil Space Logistics Market, By Operation 2019-2032 (USD Billion)
43. Middle East and Africa Space Logistics Market, By Payloads, 2019-2032 (USD Billion)
44. Middle East and Africa Space Logistics Market, By Operation 2019-2032 (USD Billion)
45. UAE Space Logistics Market, By Payloads, 2019-2032 (USD Billion)
46. UAE Space Logistics Market, By Operation 2019-2032 (USD Billion)
47. South Africa Space Logistics Market, By Payloads, 2019-2032 (USD Billion)
48. South Africa Space Logistics Market, By Operation 2019-2032 (USD Billion)
List of Figures
1. Global Space Logistics Market Segmentation
2. Global Space Logistics Market: Research Methodology
3. Market Size Estimation Methodology: Bottom-Up Approach
4. Market Size Estimation Methodology: Top-Down Approach
5. Data Triangulation
6. Porter’s Five Forces Analysis
7. Value Chain Analysis
8. Global Space Logistics Market Attractiveness Analysis By Payloads
9. Global Space Logistics Market Attractiveness Analysis By Operation
10. Global Space Logistics Market Attractiveness Analysis By Region
11. Global Space Logistics Market: Dynamics
12. Global Space Logistics Market Share By Payloads (2023 & 2032)
13. Global Space Logistics Market Share By Operation (2023 & 2032)
14. Global Space Logistics Market Share By Regions (2023 & 2032)
15. Global Space Logistics Market Share By Company (2022)
This study forecasts revenue at global, regional, and country levels from 2019 to 2030. The Brainy Insights has segmented the global space logistics based on below mentioned segments:
Global Space Logistics Market by Payloads:
Global Space Logistics Market by Operation:
Global Space Logistics by Region:
Research has its special purpose to undertake marketing efficiently. In this competitive scenario, businesses need information across all industry verticals; the information about customer wants, market demand, competition, industry trends, distribution channels etc. This information needs to be updated regularly because businesses operate in a dynamic environment. Our organization, The Brainy Insights incorporates scientific and systematic research procedures in order to get proper market insights and industry analysis for overall business success. The analysis consists of studying the market from a miniscule level wherein we implement statistical tools which helps us in examining the data with accuracy and precision.
Our research reports feature both; quantitative and qualitative aspects for any market. Qualitative information for any market research process are fundamental because they reveal the customer needs and wants, usage and consumption for any product/service related to a specific industry. This in turn aids the marketers/investors in knowing certain perceptions of the customers. Qualitative research can enlighten about the different product concepts and designs along with unique service offering that in turn, helps define marketing problems and generate opportunities. On the other hand, quantitative research engages with the data collection process through interviews, e-mail interactions, surveys and pilot studies. Quantitative aspects for the market research are useful to validate the hypotheses generated during qualitative research method, explore empirical patterns in the data with the help of statistical tools, and finally make the market estimations.
The Brainy Insights offers comprehensive research and analysis, based on a wide assortment of factual insights gained through interviews with CXOs and global experts and secondary data from reliable sources. Our analysts and industry specialist assume vital roles in building up statistical tools and analysis models, which are used to analyse the data and arrive at accurate insights with exceedingly informative research discoveries. The data provided by our organization have proven precious to a diverse range of companies, facilitating them to address issues such as determining which products/services are the most appealing, whether or not customers use the product in the manner anticipated, the purchasing intentions of the market and many others.
Our research methodology encompasses an idyllic combination of primary and secondary initiatives. Key phases involved in this process are listed below:

The phase involves the gathering and collecting of market data and its related information with the help of different sources & research procedures.

The data procurement stage involves in data gathering and collecting through various data sources.
This stage involves in extensive research. These data sources includes:
Purchased Database: Purchased databases play a crucial role in estimating the market sizes irrespective of the domain. Our purchased database includes:
Primary Research: The Brainy Insights interacts with leading companies and experts of the concerned domain to develop the analyst team’s market understanding and expertise. It improves and substantiates every single data presented in the market reports. Primary research mainly involves in telephonic interviews, E-mail interactions and face-to-face interviews with the raw material providers, manufacturers/producers, distributors, & independent consultants. The interviews that we conduct provides valuable data on market size and industry growth trends prevailing in the market. Our organization also conducts surveys with the various industry experts in order to gain overall insights of the industry/market. For instance, in healthcare industry we conduct surveys with the pharmacists, doctors, surgeons and nurses in order to gain insights and key information of a medical product/device/equipment which the customers are going to usage. Surveys are conducted in the form of questionnaire designed by our own analyst team. Surveys plays an important role in primary research because surveys helps us to identify the key target audiences of the market. Additionally, surveys helps to identify the key target audience engaged with the market. Our survey team conducts the survey by targeting the key audience, thus gaining insights from them. Based on the perspectives of the customers, this information is utilized to formulate market strategies. Moreover, market surveys helps us to understand the current competitive situation of the industry. To be precise, our survey process typically involve with the 360 analysis of the market. This analytical process begins by identifying the prospective customers for a product or service related to the market/industry to obtain data on how a product/service could fit into customers’ lives.

Secondary Research: The secondary data sources includes information published by the on-profit organizations such as World bank, WHO, company fillings, investor presentations, annual reports, national government documents, statistical databases, blogs, articles, white papers and others. From the annual report, we analyse a company’s revenue to understand the key segment and market share of that organization in a particular region. We analyse the company websites and adopt the product mapping technique which is important for deriving the segment revenue. In the product mapping method, we select and categorize the products offered by the companies catering to domain specific market, deduce the product revenue for each of the companies so as to get overall estimation of the market size. We also source data and analyses trends based on information received from supply side and demand side intermediaries in the value chain. The supply side denotes the data gathered from supplier, distributor, wholesaler and the demand side illustrates the data gathered from the end customers for respective market domain.

The supply side for a domain specific market is analysed by:
The demand side for the market is estimated through:
In-house Library: Apart from these third-party sources, we have our in-house library of qualitative and quantitative information. Our in-house database includes market data for various industry and domains. These data are updated on regular basis as per the changing market scenario. Our library includes, historic databases, internal audit reports and archives.
Sometimes there are instances where there is no metadata or raw data available for any domain specific market. For those cases, we use our expertise to forecast and estimate the market size in order to generate comprehensive data sets. Our analyst team adopt a robust research technique in order to produce the estimates:
Data Synthesis: This stage involves the analysis & mapping of all the information obtained from the previous step. It also involves in scrutinizing the data for any discrepancy observed while data gathering related to the market. The data is collected with consideration to the heterogeneity of sources. Robust scientific techniques are in place for synthesizing disparate data sets and provide the essential contextual information that can orient market strategies. The Brainy Insights has extensive experience in data synthesis where the data passes through various stages:


Market Deduction & Formulation: The final stage comprises of assigning data points at appropriate market spaces so as to deduce feasible conclusions. Analyst perspective & subject matter expert based holistic form of market sizing coupled with industry analysis also plays a crucial role in this stage.
This stage involves in finalization of the market size and numbers that we have collected from data integration step. With data interpolation, it is made sure that there is no gap in the market data. Successful trend analysis is done by our analysts using extrapolation techniques, which provide the best possible forecasts for the market.
Data Validation & Market Feedback: Validation is the most important step in the process. Validation & re-validation via an intricately designed process helps us finalize data-points to be used for final calculations.

The Brainy Insights interacts with leading companies and experts of the concerned domain to develop the analyst team’s market understanding and expertise. It improves and substantiates every single data presented in the market reports. The data validation interview and discussion panels are typically composed of the most experienced industry members. The participants include, however, are not limited to:
Moreover, we always validate our data and findings through primary respondents from all the major regions we are working on.


Free Customization
Fortune 500 Clients
Free Yearly Update On Purchase Of Multi/Corporate License
Companies Served Till Date