- +1-315-215-1633
- sales@thebrainyinsights.com

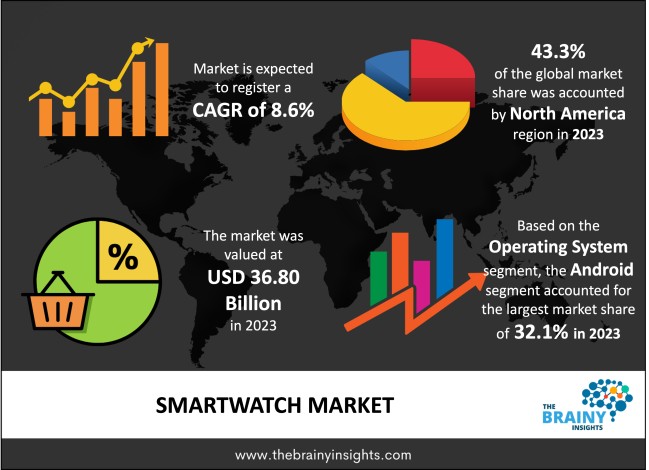
The global smartwatch market was valued at USD 36.8 billion in 2023 and grew at a CAGR of 8.6% from 2024 to 2033. The market is expected to reach USD 83.97 billion by 2033. The growth of the smartwatch market can be attributed to the rise in disposable income of consumers along with growing interest towards fitness. Smartwatches are equipped with an integrated touchscreen designed for everyday use and a corresponding smartphone application for management and data tracking. As a type of wearable technology, a smartwatch operates as a compact computer. The initial models of smartwatches were capable of performing basic tasks such as mathematical calculations, digital timekeeping, translation, and simple games. However, since their introduction in 2015, smartwatches have evolved to offer functionalities similar to smartphones, including access to mobile applications, a dedicated mobile operating system, and connectivity options such as WiFi and Bluetooth. Additionally, many smartwatches serve as portable media players, allowing users to play digital audio and video files through Bluetooth headsets and access FM radio. These devices also possess cellular capabilities, enabling users to make phone calls.
Smartwatches are self-tracking device that is gaining popularity. The watches offer parameters that may have an impact on their health, and it is how they interpret and use the data that determines how they feel. Many smartwatches have begun incorporating medical-grade sensors, such as SPO2 and ECG, enabling continuous health monitoring. Depending on the primary smartphone's pricing, tracking criteria and performance, one can select one of many available smartwatch ecosystems. Smartwatches also enhance well-being by providing access to applications specialized for particular medical conditions, such as diabetes. A smartwatch can help the user keep track of their daily steps, calories burnt, heart rate, and much more. Wearable technology smartwatches are increasingly becoming a necessary piece of medical technology.
The Internet of Things (IoT) wearables facilitate data-driven decision-making and allow users to confide remotely with colleagues. Smartwatches incorporate IoT functionalities that enable the transmission of collected data to a remote server, thus supporting real-time monitoring of individual behaviors. Additionally, IoT-enabled smartwatches can connect with other IoT devices to track users' physical activities. These smartwatches find applications in various domains, including edge analytics, computational offloading, the sports industry, biometric monitoring, and automatic device connectivity. Integrating human components into IoT applications through smartwatches is anticipated to propel market growth further. The COVID-19 pandemic caused manufacturing delays and disruptions in the supply chain, resulting in a slight setback for the consumer electronics sector. The production and availability of smartwatches were particularly affected during the initial two quarters of 2020. Nevertheless, as manufacturing resumed normal operations by the start of the third quarter and consumer demand surged due to remote work and fitness trends, the smartwatch market witnessed consistent growth throughout the pandemic.
Get an overview of this study by requesting a free sample
Increasing usage of smartwatches: The ownership of smartwatches has increased by more than 9% yearly. A rise in the popularity of the home healthcare model among consumers has led to the adoption of smartwatches, which help exchange health data with specialists and alert emergency services in times of need. Formerly regarded as a fashion accessory for the upwardly mobile, smartwatches are now necessary add-on devices. As consumers become more health conscious, they are looking for a watch that may serve as a constant reminder and assist them in maintaining a healthy work-life balance. Stakeholders have also concentrated on expanding R&D spending. It is expected that this has sped up the development of the worldwide smartwatch market.
High cost: Many critical components and electronic control circuits are used to manufacture smartwatches. The manufacturing procedure is a time-consuming multistage process for assembling the components, which leads to an increase in the cost of the final product. The high cost of smartwatches is restraining the market growth, especially in developing regions.
Increasing disposable income: Consumers in developed countries and some parts of developing countries have higher disposable income. With the growth of employment opportunities, the per capita income of the working population is also increasing. This has proved to be an accelerating attribute for the market. Over the years, many consumers are now investing in smartwatch due to their growing disposable income. Growth in the economy will mean higher disposable income, which will lead to consumers spending more on such products. This has encouraged smartwatch adoption, especially among the younger population. Thus, the use of smart devices has increased in the recent decade.
The regions analyzed for the market include North America, Europe, South America, Asia Pacific, the Middle East, and Africa. North America emerged as the most significant smartwatch market, with a 43.3% market revenue share in 2023.
North American region will account for the largest market share with revenue growth. Nations such as the U.S. and Canada have a tremendous demand for smartwatches due to the increasing availability of newly launched products and the high disposable income of consumers. The high investment in developing innovative smartwatches will lead to a substantial growth rate in the market. Further, the increasing integration of IoT and rising usage of connected devices provides lucrative growth opportunities to the market.
North America Region Smartwatch Market Share in 2023 - 43.3%
www.thebrainyinsights.com
Check the geographical analysis of this market by requesting a free sample
The operating system segment is divided into Android, WatchOS, Tizen, Sailfish OS, RTOS, Wear OS and others. The android segment dominated the market, with a share of 32.1% in 2023. Android smartwatches are used for several applications, such as tracking workout activity, steps, assistance in calling, etc. Many different types of android smartwatches are available in the market in different price ranges.
The product type segment is divided into standalone, classic and extension. The extension segment dominated the market, with a share of 42.2% in 2023. The extension smartwatch cannot be used without a smartphone, requiring a Bluetooth connection. The extension smartwatch depends on the smartphone for its operation and is cost-effective compared to other standalone and classic.
The display type segment is divided into TFT LCD, AMOLED, PMOLED and others. The TFT LCD segment dominated the market, with a share of 45.1% in 2023. The thin-film liquid crystal display uses thin-film transistor technology to enhance contrast and addressability. TFT technology uses a single transistor to power each pixel, resulting in quicker response times.
The application segment is divided into health and wellness, personal assistance and safety, sports, media, communication and others. The health and wellness segment dominated the market, with a share of around 42.1% in 2023. In the modern era, nutritionists, medical professionals, and health coaches are eager to examine data to spot trends regarding sleep, activity, heart health, and other vitals. Wearable technology offers insights into health and motivates data-driven, practical care.
| Attribute | Description |
|---|---|
| Market Size | Revenue (USD Billion) |
| Market size value in 2023 | USD 36.8 Billion |
| Market size value in 2033 | USD 83.97 Billion |
| CAGR (2024 to 2033) | 8.6% |
| Historical data | 2020-2022 |
| Base Year | 2023 |
| Forecast | 2024-2033 |
| Region | The regions analyzed for the market are Asia Pacific, Europe, South America, North America, and Middle East & Africa. Furthermore, the regions are further analyzed at the country level. |
| Segments | Operating System, Product Type, Display Type and Application |
As per The Brainy Insights, the size of the smartwatch market was valued USD 36.80 billion in 2023 to USD 83.97 billion by 2033.
Global smartwatch market is growing at a CAGR of 8.6% during the forecast period 2024-2033.
North America region emerged as the largest market for the smartwatch.
The market's growth will be influenced by the growing use of smartwatch.
The high cost of these smartwatch can hamper the market growth.
The increasing disposable income of consumers is providing huge opportunities to the market.
1. Introduction
1.1. Objectives of the Study
1.2. Market Definition
1.3. Research Scope
1.4. Currency
1.5. Key Target Audience
2. Research Methodology and Assumptions
3. Executive Summary
4. Premium Insights
4.1. Porter’s Five Forces Analysis
4.2. Value Chain Analysis
4.3. Top Investment Pockets
4.3.1. Market Attractiveness Analysis by Operating System
4.3.2. Market Attractiveness Analysis by Product Type
4.3.3. Market Attractiveness Analysis by Display Type
4.3.4. Market Attractiveness Analysis by Application
4.3.5. Market Attractiveness Analysis by Region
4.4. Industry Trends
5. Market Dynamics
5.1. Market Evaluation
5.2. Drivers
5.2.1. Increasing use of smartwatch among young generation
5.3. Restraints
5.3.1. High cost of smartwatch
5.4. Opportunities
5.4.1. Increasing disposable income
5.5. Challenges
5.5.1. Inaccuracy in tracking and monitoring data
6. Global Smartwatch Market Analysis and Forecast, By Operating System
6.1. Segment Overview
6.2. Android
6.3. WatchOS
6.4. Tizen
6.5. Sailfish OS
6.6. RTOS
6.7. Wear OS
6.8. Others
7. Global Smartwatch Market Analysis and Forecast, By Product Type
7.1. Segment Overview
7.2. Standalone
7.3. Classic
7.4. Extension
8. Global Smartwatch Market Analysis and Forecast, By Display Type
8.1. Segment Overview
8.2. TFT LCD
8.3. AMOLED
8.4. PMOLED
8.5. Others
9. Global Smartwatch Market Analysis and Forecast, By Application
9.1. Segment Overview
9.2. Health and Wellness
9.3. Personal Assistance and Safety
9.4. Sports
9.5. Media
9.6. Communication
9.7. Others
10. Global Smartwatch Market Analysis and Forecast, By Regional Analysis
10.1. Segment Overview
10.2. North America
10.2.1. U.S.
10.2.2. Canada
10.2.3. Mexico
10.3. Europe
10.3.1. Germany
10.3.2. France
10.3.3. U.K.
10.3.4. Italy
10.3.5. Spain
10.4. Asia-Pacific
10.4.1. Japan
10.4.2. China
10.4.3. India
10.5. South America
10.5.1. Brazil
10.6. Middle East and Africa
10.6.1. UAE
10.6.2. South Africa
11. Global Smartwatch Market-Competitive Landscape
11.1. Overview
11.2. Market Share of Key Players in the Smartwatch Market
11.2.1. Global Company Market Share
11.2.2. North America Company Market Share
11.2.3. Europe Company Market Share
11.2.4. APAC Company Market Share
11.3. Competitive Situations and Trends
11.3.1. Product Launches and Developments
11.3.2. Partnerships, Collaborations, and Agreements
11.3.3. Mergers & Acquisitions
11.3.4. Expansions
12. Company Profiles
12.1. Apple Inc.
12.1.1. Business Overview
12.1.2. Company Snapshot
12.1.3. Company Market Share Analysis
12.1.4. Company Product Portfolio
12.1.5. Recent Developments
12.1.6. SWOT Analysis
12.2. Fitbit, Inc.
12.2.1. Business Overview
12.2.2. Company Snapshot
12.2.3. Company Market Share Analysis
12.2.4. Company Product Portfolio
12.2.5. Recent Developments
12.2.6. SWOT Analysis
12.3. Samsung Electronics Co., Ltd.
12.3.1. Business Overview
12.3.2. Company Snapshot
12.3.3. Company Market Share Analysis
12.3.4. Company Product Portfolio
12.3.5. Recent Developments
12.3.6. SWOT Analysis
12.4. Garmin Ltd.
12.4.1. Business Overview
12.4.2. Company Snapshot
12.4.3. Company Market Share Analysis
12.4.4. Company Product Portfolio
12.4.5. Recent Developments
12.4.6. SWOT Analysis
12.5. Huami Co., Ltd.
12.5.1. Business Overview
12.5.2. Company Snapshot
12.5.3. Company Market Share Analysis
12.5.4. Company Product Portfolio
12.5.5. Recent Developments
12.5.6. SWOT Analysis
12.6. Fossil Group, Inc.
12.6.1. Business Overview
12.6.2. Company Snapshot
12.6.3. Company Market Share Analysis
12.6.4. Company Product Portfolio
12.6.5. Recent Developments
12.6.6. SWOT Analysis
12.7. Huawei Technologies Co., Ltd.
12.7.1. Business Overview
12.7.2. Company Snapshot
12.7.3. Company Market Share Analysis
12.7.4. Company Product Portfolio
12.7.5. Recent Developments
12.7.6. SWOT Analysis
12.8. Virtual-Realties, LLC
12.8.1. Business Overview
12.8.2. Company Snapshot
12.8.3. Company Market Share Analysis
12.8.4. Company Product Portfolio
12.8.5. Recent Developments
12.8.6. SWOT Analysis
12.9. Sony Corporation
12.9.1. Business Overview
12.9.2. Company Snapshot
12.9.3. Company Market Share Analysis
12.9.4. Company Product Portfolio
12.9.5. Recent Developments
12.9.6. SWOT Analysis
12.10. Xiaomi
12.10.1. Business Overview
12.10.2. Company Snapshot
12.10.3. Company Market Share Analysis
12.10.4. Company Product Portfolio
12.10.5. Recent Developments
12.10.6. SWOT Analysis
12.11. Honeywell International Inc.
12.11.1. Business Overview
12.11.2. Company Snapshot
12.11.3. Company Market Share Analysis
12.11.4. Company Product Portfolio
12.11.5. Recent Developments
12.11.6. SWOT Analysis
12.12. LG Electronics
12.12.1. Business Overview
12.12.2. Company Snapshot
12.12.3. Company Market Share Analysis
12.12.4. Company Product Portfolio
12.12.5. Recent Developments
12.12.6. SWOT Analysis
12.13. SAMSUNG
12.13.1. Business Overview
12.13.2. Company Snapshot
12.13.3. Company Market Share Analysis
12.13.4. Company Product Portfolio
12.13.5. Recent Developments
12.13.6. SWOT Analysis
12.14. ASUSTeK Computer Inc.
12.14.1. Business Overview
12.14.2. Company Snapshot
12.14.3. Company Market Share Analysis
12.14.4. Company Product Portfolio
12.14.5. Recent Developments
12.14.6. SWOT Analysis
12.15. Motorola Solutions, Inc.
12.15.1. Business Overview
12.15.2. Company Snapshot
12.15.3. Company Market Share Analysis
12.15.4. Company Product Portfolio
12.15.5. Recent Developments
12.15.6. SWOT Analysis
12.16. Polar Electro
12.16.1. Business Overview
12.16.2. Company Snapshot
12.16.3. Company Market Share Analysis
12.16.4. Company Product Portfolio
12.16.5. Recent Developments
12.16.6. SWOT Analysis
12.17. Michael Kors
12.17.1. Business Overview
12.17.2. Company Snapshot
12.17.3. Company Market Share Analysis
12.17.4. Company Product Portfolio
12.17.5. Recent Developments
12.17.6. SWOT Analysis
12.18. TomTom International
12.18.1. Business Overview
12.18.2. Company Snapshot
12.18.3. Company Market Share Analysis
12.18.4. Company Product Portfolio
12.18.5. Recent Developments
12.18.6. SWOT Analysis
List of Table
1. Global Smartwatch Market, By Operating System, 2020-2033 (USD Billion)
2. Global Android, Based Smartwatch, Smartwatch Market, By Region, 2020-2033 (USD Billion)
3. Global WatchOS, Smartwatch Market, By Region, 2020-2033 (USD Billion)
4. Global Sailfish OS, Smartwatch Market, By Region, 2020-2033 (USD Billion)
5. Global RTOS, Smartwatch Market, By Region, 2020-2033 (USD Billion)
6. Global Wear OS, Smartwatch Market, By Region, 2020-2033 (USD Billion)
7. Global Others, Smartwatch Market, By Region, 2020-2033 (USD Billion)
8. Global Smartwatch Market, By Product Type, 2020-2033 (USD Billion)
9. Global Standalone, Smartwatch Market, By Region, 2020-2033 (USD Billion)
10. Global Classic, Smartwatch Market, By Region, 2020-2033 (USD Billion)
11. Global Extension, Smartwatch Market, By Region, 2020-2033 (USD Billion)
12. Global Smartwatch Market, By Display Type, 2020-2033 (USD Billion)
13. Global TFT LCD, Smartwatch Market, By Region, 2020-2033 (USD Billion)
14. Global AMOLED, Smartwatch Market, By Region, 2020-2033 (USD Billion)
15. Global PMOLED, Smartwatch Market, By Region, 2020-2033 (USD Billion)
16. Global Others, Smartwatch Market, By Region, 2020-2033 (USD Billion)
17. Global Smartwatch Market, By Application, 2020-2033 (USD Billion)
18. Global Health and Wellness, Smartwatch Market, By Region, 2020-2033 (USD Billion)
19. Global Personal Assistance and Safety, Smartwatch Market, By Region, 2020-2033 (USD Billion)
20. Global Sports, Smartwatch Market, By Region, 2020-2033 (USD Billion)
21. Global Media, Smartwatch Market, By Region, 2020-2033 (USD Billion)
22. Global Communication, Smartwatch Market, By Region, 2020-2033 (USD Billion)
23. Global Others, Smartwatch Market, By Region, 2020-2033 (USD Billion)
24. Global Smartwatch Market, By Region, 2020-2033 (USD Billion)
25. North America Smartwatch Market, By Operating System, 2020-2033 (USD Billion)
26. North America Smartwatch Market, By Product Type, 2020-2033 (USD Billion)
27. North America Smartwatch Market, By Display Type, 2020-2033 (USD Billion)
28. North America Smartwatch Market, By Application, 2020-2033 (USD Billion)
29. U.S. Smartwatch Market, By Operating System, 2020-2033 (USD Billion)
30. U.S. Smartwatch Market, By Product Type, 2020-2033 (USD Billion)
31. U.S. Smartwatch Market, By Display Type, 2020-2033 (USD Billion)
32. U.S. Smartwatch Market, By Application, 2020-2033 (USD Billion)
33. Canada Smartwatch Market, By Operating System, 2020-2033 (USD Billion)
34. Canada Smartwatch Market, By Product Type, 2020-2033 (USD Billion)
35. Canada Smartwatch Market, By Display Type, 2020-2033 (USD Billion)
36. Canada Smartwatch Market, By Application, 2020-2033 (USD Billion)
37. Mexico Smartwatch Market, By Operating System, 2020-2033 (USD Billion)
38. Mexico Smartwatch Market, By Product Type, 2020-2033 (USD Billion)
39. Mexico Smartwatch Market, By Display Type, 2020-2033 (USD Billion)
40. Mexico Smartwatch Market, By Application, 2020-2033 (USD Billion)
41. Europe Smartwatch Market, By Operating System, 2020-2033 (USD Billion)
42. Europe Smartwatch Market, By Product Type, 2020-2033 (USD Billion)
43. Europe Smartwatch Market, By Display Type, 2020-2033 (USD Billion)
44. Europe Smartwatch Market, By Application, 2020-2033 (USD Billion)
45. Germany Smartwatch Market, By Operating System, 2020-2033 (USD Billion)
46. Germany Smartwatch Market, By Product Type, 2020-2033 (USD Billion)
47. Germany Smartwatch Market, By Display Type, 2020-2033 (USD Billion)
48. Germany Smartwatch Market, By Application, 2020-2033 (USD Billion)
49. France Smartwatch Market, By Operating System, 2020-2033 (USD Billion)
50. France Smartwatch Market, By Product Type, 2020-2033 (USD Billion)
51. France Smartwatch Market, By Display Type, 2020-2033 (USD Billion)
52. France Smartwatch Market, By Application, 2020-2033 (USD Billion)
53. U.K. Smartwatch Market, By Operating System, 2020-2033 (USD Billion)
54. U.K. Smartwatch Market, By Product Type, 2020-2033 (USD Billion)
55. U.K. Smartwatch Market, By Display Type, 2020-2033 (USD Billion)
56. U.K. Smartwatch Market, By Application, 2020-2033 (USD Billion)
57. Italy Smartwatch Market, By Operating System, 2020-2033 (USD Billion)
58. Italy Smartwatch Market, By Product Type, 2020-2033 (USD Billion)
59. Italy Smartwatch Market, By Display Type, 2020-2033 (USD Billion)
60. Italy Smartwatch Market, By Application, 2020-2033 (USD Billion)
61. Spain Smartwatch Market, By Operating System, 2020-2033 (USD Billion)
62. Spain Smartwatch Market, By Product Type, 2020-2033 (USD Billion)
63. Spain Smartwatch Market, By Display Type, 2020-2033 (USD Billion)
64. Spain Smartwatch Market, By Application, 2020-2033 (USD Billion)
65. Asia Pacific Smartwatch Market, By Operating System, 2020-2033 (USD Billion)
66. Asia Pacific Smartwatch Market, By Product Type, 2020-2033 (USD Billion)
67. Asia Pacific Smartwatch Market, By Display Type, 2020-2033 (USD Billion)
68. Asia Pacific Smartwatch Market, By Application, 2020-2033 (USD Billion)
69. Japan Smartwatch Market, By Operating System, 2020-2033 (USD Billion)
70. Japan Smartwatch Market, By Product Type, 2020-2033 (USD Billion)
71. Japan Smartwatch Market, By Display Type, 2020-2033 (USD Billion)
72. Japan Smartwatch Market, By Application, 2020-2033 (USD Billion)
73. China Smartwatch Market, By Operating System, 2020-2033 (USD Billion)
74. China Smartwatch Market, By Product Type, 2020-2033 (USD Billion)
75. China Smartwatch Market, By Display Type, 2020-2033 (USD Billion)
76. China Smartwatch Market, By Application, 2020-2033 (USD Billion)
77. India Smartwatch Market, By Operating System, 2020-2033 (USD Billion)
78. India Smartwatch Market, By Product Type, 2020-2033 (USD Billion)
79. India Smartwatch Market, By Display Type, 2020-2033 (USD Billion)
80. India Smartwatch Market, By Application, 2020-2033 (USD Billion)
81. South America Smartwatch Market, By Operating System, 2020-2033 (USD Billion)
82. South America Smartwatch Market, By Product Type, 2020-2033 (USD Billion)
83. South America Smartwatch Market, By Display Type, 2020-2033 (USD Billion)
84. South America Smartwatch Market, By Application, 2020-2033 (USD Billion)
85. Brazil Smartwatch Market, By Operating System, 2020-2033 (USD Billion)
86. Brazil Smartwatch Market, By Product Type, 2020-2033 (USD Billion)
87. Brazil Smartwatch Market, By Display Type, 2020-2033 (USD Billion)
88. BrazilSmartwatch Market, By Application, 2020-2033 (USD Billion)
89. Middle East and Africa Smartwatch Market, By Operating System, 2020-2033 (USD Billion)
90. Middle East and Africa Smartwatch Market, By Product Type, 2020-2033 (USD Billion)
91. Middle East and Africa Smartwatch Market, By Display Type, 2020-2033 (USD Billion)
92. Middle East and Africa Smartwatch Market, By Application, 2020-2033 (USD Billion)
93. UAE Smartwatch Market, By Operating System, 2020-2033 (USD Billion)
94. UAE Smartwatch Market, By Product Type, 2020-2033 (USD Billion)
95. UAE Smartwatch Market, By Display Type, 2020-2033 (USD Billion)
96. UAE Smartwatch Market, By Application, 2020-2033 (USD Billion)
97. South Africa Smartwatch Market, By Operating System, 2020-2033 (USD Billion)
98. South Africa Smartwatch Market, By Product Type, 2020-2033 (USD Billion)
99. South Africa Smartwatch Market, By Display Type, 2020-2033 (USD Billion)
100. South Africa Smartwatch Market, By Application, 2020-2033 (USD Billion)
List of Figures
1. Global Smartwatch Market Segmentation
2. Smartwatch Market: Research Methodology
3. Market Size Estimation Methodology: Bottom-Up Approach
4. Market Size Estimation Methodology: Top-Down Approach
5. Data Triangulation
6. Porter’s Five Forces Analysis
7. Value Chain Analysis
8. Global Smartwatch Market Attractiveness Analysis by Operating System
9. Global Smartwatch Market Attractiveness Analysis by Product Type
10. Global Smartwatch Market Attractiveness Analysis by Display Type
11. Global Smartwatch Market Attractiveness Analysis by Application
12. Global Smartwatch Market Attractiveness Analysis by Region
13. Global Smartwatch Market: Dynamics
14. Global Smartwatch Market Share by Operating System (2023 & 2033)
15. Global Smartwatch Market Share by Product Type (2023 & 2033)
16. Global Smartwatch Market Share by Display Type (2023 & 2033)
17. Global Smartwatch Market Share by Application (2023 & 2033)
18. Global Smartwatch Market Share by Regions (2023 & 2033)
19. Global Smartwatch Market Share by Company (2023)
This study forecasts revenue at global, regional, and country levels from 2020 to 2033. The Brainy Insights has segmented the global smartwatch market based on below mentioned segments:
Global Smartwatch Market by Operating System:
Global Smartwatch Market by Product Type:
Global Smartwatch Market by Display Type:
Global Smartwatch Market by Application:
Global Smartwatch Market by Region:
Research has its special purpose to undertake marketing efficiently. In this competitive scenario, businesses need information across all industry verticals; the information about customer wants, market demand, competition, industry trends, distribution channels etc. This information needs to be updated regularly because businesses operate in a dynamic environment. Our organization, The Brainy Insights incorporates scientific and systematic research procedures in order to get proper market insights and industry analysis for overall business success. The analysis consists of studying the market from a miniscule level wherein we implement statistical tools which helps us in examining the data with accuracy and precision.
Our research reports feature both; quantitative and qualitative aspects for any market. Qualitative information for any market research process are fundamental because they reveal the customer needs and wants, usage and consumption for any product/service related to a specific industry. This in turn aids the marketers/investors in knowing certain perceptions of the customers. Qualitative research can enlighten about the different product concepts and designs along with unique service offering that in turn, helps define marketing problems and generate opportunities. On the other hand, quantitative research engages with the data collection process through interviews, e-mail interactions, surveys and pilot studies. Quantitative aspects for the market research are useful to validate the hypotheses generated during qualitative research method, explore empirical patterns in the data with the help of statistical tools, and finally make the market estimations.
The Brainy Insights offers comprehensive research and analysis, based on a wide assortment of factual insights gained through interviews with CXOs and global experts and secondary data from reliable sources. Our analysts and industry specialist assume vital roles in building up statistical tools and analysis models, which are used to analyse the data and arrive at accurate insights with exceedingly informative research discoveries. The data provided by our organization have proven precious to a diverse range of companies, facilitating them to address issues such as determining which products/services are the most appealing, whether or not customers use the product in the manner anticipated, the purchasing intentions of the market and many others.
Our research methodology encompasses an idyllic combination of primary and secondary initiatives. Key phases involved in this process are listed below:

The phase involves the gathering and collecting of market data and its related information with the help of different sources & research procedures.

The data procurement stage involves in data gathering and collecting through various data sources.
This stage involves in extensive research. These data sources includes:
Purchased Database: Purchased databases play a crucial role in estimating the market sizes irrespective of the domain. Our purchased database includes:
Primary Research: The Brainy Insights interacts with leading companies and experts of the concerned domain to develop the analyst team’s market understanding and expertise. It improves and substantiates every single data presented in the market reports. Primary research mainly involves in telephonic interviews, E-mail interactions and face-to-face interviews with the raw material providers, manufacturers/producers, distributors, & independent consultants. The interviews that we conduct provides valuable data on market size and industry growth trends prevailing in the market. Our organization also conducts surveys with the various industry experts in order to gain overall insights of the industry/market. For instance, in healthcare industry we conduct surveys with the pharmacists, doctors, surgeons and nurses in order to gain insights and key information of a medical product/device/equipment which the customers are going to usage. Surveys are conducted in the form of questionnaire designed by our own analyst team. Surveys plays an important role in primary research because surveys helps us to identify the key target audiences of the market. Additionally, surveys helps to identify the key target audience engaged with the market. Our survey team conducts the survey by targeting the key audience, thus gaining insights from them. Based on the perspectives of the customers, this information is utilized to formulate market strategies. Moreover, market surveys helps us to understand the current competitive situation of the industry. To be precise, our survey process typically involve with the 360 analysis of the market. This analytical process begins by identifying the prospective customers for a product or service related to the market/industry to obtain data on how a product/service could fit into customers’ lives.

Secondary Research: The secondary data sources includes information published by the on-profit organizations such as World bank, WHO, company fillings, investor presentations, annual reports, national government documents, statistical databases, blogs, articles, white papers and others. From the annual report, we analyse a company’s revenue to understand the key segment and market share of that organization in a particular region. We analyse the company websites and adopt the product mapping technique which is important for deriving the segment revenue. In the product mapping method, we select and categorize the products offered by the companies catering to domain specific market, deduce the product revenue for each of the companies so as to get overall estimation of the market size. We also source data and analyses trends based on information received from supply side and demand side intermediaries in the value chain. The supply side denotes the data gathered from supplier, distributor, wholesaler and the demand side illustrates the data gathered from the end customers for respective market domain.

The supply side for a domain specific market is analysed by:
The demand side for the market is estimated through:
In-house Library: Apart from these third-party sources, we have our in-house library of qualitative and quantitative information. Our in-house database includes market data for various industry and domains. These data are updated on regular basis as per the changing market scenario. Our library includes, historic databases, internal audit reports and archives.
Sometimes there are instances where there is no metadata or raw data available for any domain specific market. For those cases, we use our expertise to forecast and estimate the market size in order to generate comprehensive data sets. Our analyst team adopt a robust research technique in order to produce the estimates:
Data Synthesis: This stage involves the analysis & mapping of all the information obtained from the previous step. It also involves in scrutinizing the data for any discrepancy observed while data gathering related to the market. The data is collected with consideration to the heterogeneity of sources. Robust scientific techniques are in place for synthesizing disparate data sets and provide the essential contextual information that can orient market strategies. The Brainy Insights has extensive experience in data synthesis where the data passes through various stages:


Market Deduction & Formulation: The final stage comprises of assigning data points at appropriate market spaces so as to deduce feasible conclusions. Analyst perspective & subject matter expert based holistic form of market sizing coupled with industry analysis also plays a crucial role in this stage.
This stage involves in finalization of the market size and numbers that we have collected from data integration step. With data interpolation, it is made sure that there is no gap in the market data. Successful trend analysis is done by our analysts using extrapolation techniques, which provide the best possible forecasts for the market.
Data Validation & Market Feedback: Validation is the most important step in the process. Validation & re-validation via an intricately designed process helps us finalize data-points to be used for final calculations.

The Brainy Insights interacts with leading companies and experts of the concerned domain to develop the analyst team’s market understanding and expertise. It improves and substantiates every single data presented in the market reports. The data validation interview and discussion panels are typically composed of the most experienced industry members. The participants include, however, are not limited to:
Moreover, we always validate our data and findings through primary respondents from all the major regions we are working on.


Free Customization
Fortune 500 Clients
Free Yearly Update On Purchase Of Multi/Corporate License
Companies Served Till Date