- +1-315-215-1633
- sales@thebrainyinsights.com

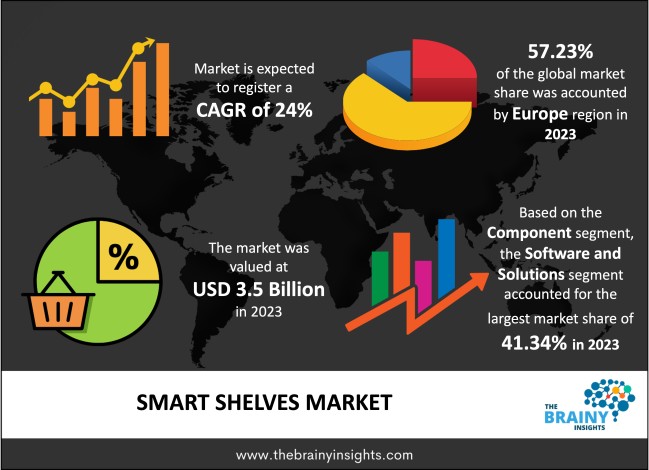
The global Smart Shelves market was valued at USD 3.5 billion in 2023 and growing at a CAGR of 24% from 2024 to 2033. The market is expected to reach USD 30 billion by 2033. The rising use of IoT and RFID technologies in the retail industry and the rising adoption of increased inventory management have propelled the growth of the Smart Shelves Market. Further, the rising demand of retailers to build rapport with the customers provides lucrative opportunities for the growth of the Smart Shelves Market, in the period forecasted.
Smart Shelves represent technologically advanced shelving units extensively applied in diverse scenarios, encompassing planograms, inventory management, pricing management, and content management systems. For instance, these shelves autonomously monitor and regulate inventory levels, mitigating the risks associated with both oversupply and undersupply situations.
Given this capability, Smart Shelves have gained widespread adoption globally, spanning regions such as Europe, Asia Pacific, North America, the Middle East, and other parts of the world. Experiencing remarkable growth, industry stakeholders worldwide are making substantial investments in Smart Shelves. Additionally, they are engaging in various strategic initiatives, including partnership agreements, product launches, collaborations, and research and development services. These efforts aim to enhance the customer experience and expand market share on a global scale.
Get an overview of this study by requesting a free sample
• In EuroShop 2023, Bizerba presented its hardware and software solutions for Smart Shelves, emphasizing the theme "Shape your future. Today." The primary goal was to elevate the customer experience, ensuring a seamless and expeditious shopping process.
• SES-imaging introduced the VUSION OS and IoT program in March 2022, aiming to empower retailers to achieve complete automation of their spaces and obtaining real-time data. The ultimate objective was to offer end-users effective and efficient solutions to fulfill their needs and desires.
Rising use of the IoT and RFID technologies in the retail industry – The increasing use of IoT and RFID technologies is heavily used in the retail industry to increase efficiency and enhance its market share in the competitive market. The introduction of the technology not only reduces labor costs but also increases revenue and provides customers with long-term better experiences.
Security and privacy concerns related to inbuilt data tags– One significant factor impeding the advancement of Smart Shelves is the potential challenges associated with the embedded data tags. Preserving customer privacy is a paramount concern for organizations. Nevertheless, the substantial issues of data theft, cyber-attacks, and the inadvertent disclosure of customers' personal information pose critical hurdles that organizations must confront and mitigate.
Rising demand of retailers for building rapport with the customers- In the current landscape, retailers extensively leverage smart shelves to offer innovative solutions and meet the evolving needs of their customers. To achieve this, they heavily incorporate Internet of Things (IoT) and Radio-Frequency Identification (RFID) technologies, presenting promising avenues for substantial growth in the foreseeable future.
The regions analyzed for the market include North America, Europe, South America, Asia Pacific, the Middle East, and Africa. Europe emerged as the largest global Smart Shelves market, accounting for 57.23% of the total market. Owing to rising demand for smart devices, advancements in the technology of smart shelves and increasing product launches and partnership agreements in the region have fueled the growth of the Smart shelf market. Whereas the Asia Pacific region is anticipated to exhibit the highest growth rate over the period. Owing to increasing numbers of mobile computers, RFID tags, and POS terminals besides the growing retail industry has also paved the way for the APAC region’s growth in the Smart Shelves industry.
Europe Region Smart Shelves Market Share in 2023 - 57.23%
www.thebrainyinsights.com
Check the geographical analysis of this market by requesting a free sample
Software and Solutions have dominated the market accounting for 41.34% of the total market. Owing to its rising connectivity between self-components and gateways. Further rapidly growing retail industry and advances in AI (Artificial Intelligence) Analytics have also paved the way for Smart Shelves in the global market.
The inventory management segment has dominated the Smart Shelves market with a market share of 45.67% in 2023. It is also expected to be the fastest-growing segment across the globe. Owing to rapidly growing inventory management methods in the market. These range from RFID, automated use of inventory robots, and smart shelves. Further, the rising adoption of Smart Inventory Management (SIM) has also fueled the growth of the Smart Shelves Market.
| Attribute | Description |
|---|---|
| Market Size | Revenue (USD Billion) |
| Market size value in 2023 | USD 3.5 Billion |
| Market size value in 2033 | USD 30 Billion |
| CAGR (2024 to 2033) | 24% |
| Historical data | 2020-2022 |
| Base Year | 2023 |
| Forecast | 2024-2033 |
| Region | The regions analyzed for the market are Asia Pacific, Europe, South America, North America, and Middle East & Africa. Furthermore, the regions are further analyzed at the country level. |
| Segments | Components, Application |
As per The Brainy Insights, the size of the smart shelves market was valued at USD 3.5 billion in 2023 to USD 30 billion by 2033.
The global smart shelves market is growing at a CAGR of 24% during the forecast period 2024-2033.
The Europe region emerged as the largest market for the smart shelves.
The rising use of the IoT and RFID technologies in the retail industry will influence the market's growth.
1. Introduction
1.1. Objectives of the Study
1.2. Market Definition
1.3. Research Scope
1.4. Currency
1.5. Key Target Audience
2. Research Methodology and Assumptions
3. Executive Summary
4. Premium Insights
4.1. Porter’s Five Forces Analysis
4.2. Value Chain Analysis
4.3. Top Investment Pockets
4.3.1. Market Attractiveness Analysis by Components
4.3.2. Market Attractiveness Analysis by Application
4.3.3. Market Attractiveness Analysis by Region
4.4. Industry Trends
5. Market Dynamics
5.1. Market Evaluation
5.2. Drivers
5.2.1. Rising use of the IoT and RFID technologies in the retail industry
5.2.2. Rising adoption of increased inventory management
5.3. Restraints
5.3.1. Security and privacy concerns related to inbuilt data tags
5.4. Opportunities
5.4.1. Rising demand of retailers for building rapport with the customers
5.5. Challenges
5.5.1. Increasing customer shift to online retail stores
6. Global Smart Shelves Market Analysis and Forecast, By Components
6.1. Segment Overview
6.2. Hardware
6.3. Software and Solutions
6.4. Professional services
7. Global Smart Shelves Market Analysis and Forecast, By Application
7.1. Segment Overview
7.2. Planogram management
7.3. Inventory management
7.4. Pricing management
7.5. Content management
8. Global Smart Shelves Market Analysis and Forecast, By Regional Analysis
8.1. Segment Overview
8.2. North America
8.2.1. U.S.
8.2.2. Canada
8.2.3. Mexico
8.3. Europe
8.3.1. Germany
8.3.2. France
8.3.3. U.K.
8.3.4. Italy
8.3.5. Spain
8.4. Asia-Pacific
8.4.1. Japan
8.4.2. China
8.4.3. India
8.5. South America
8.5.1. Brazil
8.6. Middle East and Africa
8.6.1. UAE
8.6.2. South Africa
9. Global Smart Shelves Market-Competitive Landscape
9.1. Overview
9.2. Market Share of Key Players in Global Smart Shelves Market
9.2.1. Global Company Market Share
9.2.2. North America Company Market Share
9.2.3. Europe Company Market Share
9.2.4. APAC Company Market Share
9.3. Competitive Situations and Trends
9.3.1. Product Launches and Developments
9.3.2. Partnerships, Collaborations, and Agreements
9.3.3. Mergers & Acquisitions
9.3.4. Expansions
10. Company Profiles
10.1. Honeywell International Inc
10.1.1. Business Overview
10.1.2. Company Snapshot
10.1.3. Company Market Share Analysis
10.1.4. Company Product Portfolio
10.1.5. Recent Developments
10.1.6. SWOT Analysis
10.2. Huawei Technologies Co. Ltd
10.2.1. Business Overview
10.2.2. Company Snapshot
10.2.3. Company Market Share Analysis
10.2.4. Company Product Portfolio
10.2.5. Recent Developments
10.2.6. SWOT Analysis
10.3. Trax Technology Solutions
10.3.1. Business Overview
10.3.2. Company Snapshot
10.3.3. Company Market Share Analysis
10.3.4. Company Product Portfolio
10.3.5. Recent Developments
10.3.6. SWOT Analysis
10.4. Lenovo PCCW Solutions Limited
10.4.1. Business Overview
10.4.2. Company Snapshot
10.4.3. Company Market Share Analysis
10.4.4. Company Product Portfolio
10.4.5. Recent Developments
10.4.6. SWOT Analysis
10.5. Samsung Electronics Co. Ltd
10.5.1. Business Overview
10.5.2. Company Snapshot
10.5.3. Company Market Share Analysis
10.5.4. Company Product Portfolio
10.5.5. Recent Developments
10.5.6. SWOT Analysis
10.6. AWM Smart Shelf
10.6.1. Business Overview
10.6.2. Company Snapshot
10.6.3. Company Market Share Analysis
10.6.4. Company Product Portfolio
10.6.5. Recent Developments
10.6.6. SWOT Analysis
10.7. Happiest Minds Technologies Limited
10.7.1. Business Overview
10.7.2. Company Snapshot
10.7.3. Company Market Share Analysis
10.7.4. Company Product Portfolio
10.7.5. Recent Developments
10.7.6. SWOT Analysis
10.8. E Ink Holdings Inc
10.8.1. Business Overview
10.8.2. Company Snapshot
10.8.3. Company Market Share Analysis
10.8.4. Company Product Portfolio
10.8.5. Recent Developments
10.8.6. SWOT Analysis
10.9. Avery Dennison Corporation
10.9.1. Business Overview
10.9.2. Company Snapshot
10.9.3. Company Market Share Analysis
10.9.4. Company Product Portfolio
10.9.5. Recent Developments
10.9.6. SWOT Analysis
10.10. Intel Corporation
10.10.1. Business Overview
10.10.2. Company Snapshot
10.10.3. Company Market Share Analysis
10.10.4. Company Product Portfolio
10.10.5. Recent Developments
10.10.6. SWOT Analysis
List of Table
1. Global Smart Shelves Market, By Components, 2020-2033 (USD Billion)
2. Global Hardware, Smart Shelves Market, By Region, 2020-2033 (USD Billion)
3. Global Software and Solutions, Smart Shelves Market, By Region, 2020-2033 (USD Billion)
4. Global Professional services, Smart Shelves Market, By Region, 2020-2033 (USD Billion)
5. Global Smart Shelves Market, By Application, 2020-2033 (USD Billion)
6. Global Planogram management, Smart Shelves Market, By Region, 2020-2033 (USD Billion)
7. Global Inventory management, Smart Shelves Market, By Region, 2020-2033 (USD Billion)
8. Global Pricing management, Smart Shelves Market, By Region, 2020-2033 (USD Billion)
9. Global Content management, Smart Shelves Market, By Region, 2020-2033 (USD Billion)
10. Global Smart Shelves Market, By Region, 2020-2033 (USD Billion)
11. North America Smart Shelves Market, By Components, 2020-2033 (USD Billion)
12. North America Smart Shelves Market, By Application, 2020-2033 (USD Billion)
13. U.S. Smart Shelves Market, By Components, 2020-2033 (USD Billion)
14. U.S. Smart Shelves Market, By Application, 2020-2033 (USD Billion)
15. Canada Smart Shelves Market, By Components, 2020-2033 (USD Billion)
16. Canada Smart Shelves Market, By Application, 2020-2033 (USD Billion)
17. Mexico Smart Shelves Market, By Components, 2020-2033 (USD Billion)
18. Mexico Smart Shelves Market, By Application, 2020-2033 (USD Billion)
19. Europe Smart Shelves Market, By Components, 2020-2033 (USD Billion)
20. Europe Smart Shelves Market, By Application, 2020-2033 (USD Billion)
21. Germany Smart Shelves Market, By Components, 2020-2033 (USD Billion)
22. Germany Smart Shelves Market, By Application, 2020-2033 (USD Billion)
23. France Smart Shelves Market, By Components, 2020-2033 (USD Billion)
24. France Smart Shelves Market, By Application, 2020-2033 (USD Billion)
25. U.K. Smart Shelves Market, By Components, 2020-2033 (USD Billion)
26. U.K. Smart Shelves Market, By Application, 2020-2033 (USD Billion)
27. Italy Smart Shelves Market, By Components, 2020-2033 (USD Billion)
28. Italy Smart Shelves Market, By Application, 2020-2033 (USD Billion)
29. Spain Smart Shelves Market, By Components, 2020-2033 (USD Billion)
30. Spain Smart Shelves Market, By Application, 2020-2033 (USD Billion)
31. Asia Pacific Smart Shelves Market, By Components, 2020-2033 (USD Billion)
32. Asia Pacific Smart Shelves Market, By Application, 2020-2033 (USD Billion)
33. Japan Smart Shelves Market, By Components, 2020-2033 (USD Billion)
34. Japan Smart Shelves Market, By Application, 2020-2033 (USD Billion)
35. China Smart Shelves Market, By Components, 2020-2033 (USD Billion)
36. China Smart Shelves Market, By Application, 2020-2033 (USD Billion)
37. India Smart Shelves Market, By Components, 2020-2033 (USD Billion)
38. India Smart Shelves Market, By Application, 2020-2033 (USD Billion)
39. South America Smart Shelves Market, By Components, 2020-2033 (USD Billion)
40. South America Smart Shelves Market, By Application, 2020-2033 (USD Billion)
41. Brazil Smart Shelves Market, By Components, 2020-2033 (USD Billion)
42. Brazil Smart Shelves Market, By Application, 2020-2033 (USD Billion)
43. Middle East and Africa Smart Shelves Market, By Components, 2020-2033 (USD Billion)
44. Middle East and Africa Smart Shelves Market, By Application, 2020-2033 (USD Billion)
45. UAE Smart Shelves Market, By Components, 2020-2033 (USD Billion)
46. UAE Smart Shelves Market, By Application, 2020-2033 (USD Billion)
47. South Africa Smart Shelves Market, By Components, 2020-2033 (USD Billion)
48. South Africa Smart Shelves Market, By Application, 2020-2033 (USD Billion)
List of Figures
1. Global Smart Shelves Market Segmentation
2. Global Smart Shelves Market: Research Methodology
3. Market Size Estimation Methodology: Bottom-Up Approach
4. Market Size Estimation Methodology: Top-Down Approach
5. Data Triangulation
6. Porter’s Five Forces Analysis
7. Value Chain Analysis
8. Global Smart Shelves Market Attractiveness Analysis by Components
9. Global Smart Shelves Market Attractiveness Analysis by Application
10. Global Smart Shelves Market Attractiveness Analysis by Region
11. Global Smart Shelves Market: Dynamics
12. Global Smart Shelves Market Share by Components (2023 & 2033)
13. Global Smart Shelves Market Share by Application (2023 & 2033)
14. Global Smart Shelves Market Share by Regions (2023 & 2033)
15. Global Smart Shelves Market Share by Company (2023)
This study forecasts revenue at global, regional, and country levels from 2020 to 2033. The Brainy Insights has segmented the global smart shelves market based on below-mentioned segments:
Global Smart Shelves Market by Components:
Global Smart Shelves Market by Application:
Global Smart Shelves Market by Region:
Research has its special purpose to undertake marketing efficiently. In this competitive scenario, businesses need information across all industry verticals; the information about customer wants, market demand, competition, industry trends, distribution channels etc. This information needs to be updated regularly because businesses operate in a dynamic environment. Our organization, The Brainy Insights incorporates scientific and systematic research procedures in order to get proper market insights and industry analysis for overall business success. The analysis consists of studying the market from a miniscule level wherein we implement statistical tools which helps us in examining the data with accuracy and precision.
Our research reports feature both; quantitative and qualitative aspects for any market. Qualitative information for any market research process are fundamental because they reveal the customer needs and wants, usage and consumption for any product/service related to a specific industry. This in turn aids the marketers/investors in knowing certain perceptions of the customers. Qualitative research can enlighten about the different product concepts and designs along with unique service offering that in turn, helps define marketing problems and generate opportunities. On the other hand, quantitative research engages with the data collection process through interviews, e-mail interactions, surveys and pilot studies. Quantitative aspects for the market research are useful to validate the hypotheses generated during qualitative research method, explore empirical patterns in the data with the help of statistical tools, and finally make the market estimations.
The Brainy Insights offers comprehensive research and analysis, based on a wide assortment of factual insights gained through interviews with CXOs and global experts and secondary data from reliable sources. Our analysts and industry specialist assume vital roles in building up statistical tools and analysis models, which are used to analyse the data and arrive at accurate insights with exceedingly informative research discoveries. The data provided by our organization have proven precious to a diverse range of companies, facilitating them to address issues such as determining which products/services are the most appealing, whether or not customers use the product in the manner anticipated, the purchasing intentions of the market and many others.
Our research methodology encompasses an idyllic combination of primary and secondary initiatives. Key phases involved in this process are listed below:

The phase involves the gathering and collecting of market data and its related information with the help of different sources & research procedures.

The data procurement stage involves in data gathering and collecting through various data sources.
This stage involves in extensive research. These data sources includes:
Purchased Database: Purchased databases play a crucial role in estimating the market sizes irrespective of the domain. Our purchased database includes:
Primary Research: The Brainy Insights interacts with leading companies and experts of the concerned domain to develop the analyst team’s market understanding and expertise. It improves and substantiates every single data presented in the market reports. Primary research mainly involves in telephonic interviews, E-mail interactions and face-to-face interviews with the raw material providers, manufacturers/producers, distributors, & independent consultants. The interviews that we conduct provides valuable data on market size and industry growth trends prevailing in the market. Our organization also conducts surveys with the various industry experts in order to gain overall insights of the industry/market. For instance, in healthcare industry we conduct surveys with the pharmacists, doctors, surgeons and nurses in order to gain insights and key information of a medical product/device/equipment which the customers are going to usage. Surveys are conducted in the form of questionnaire designed by our own analyst team. Surveys plays an important role in primary research because surveys helps us to identify the key target audiences of the market. Additionally, surveys helps to identify the key target audience engaged with the market. Our survey team conducts the survey by targeting the key audience, thus gaining insights from them. Based on the perspectives of the customers, this information is utilized to formulate market strategies. Moreover, market surveys helps us to understand the current competitive situation of the industry. To be precise, our survey process typically involve with the 360 analysis of the market. This analytical process begins by identifying the prospective customers for a product or service related to the market/industry to obtain data on how a product/service could fit into customers’ lives.

Secondary Research: The secondary data sources includes information published by the on-profit organizations such as World bank, WHO, company fillings, investor presentations, annual reports, national government documents, statistical databases, blogs, articles, white papers and others. From the annual report, we analyse a company’s revenue to understand the key segment and market share of that organization in a particular region. We analyse the company websites and adopt the product mapping technique which is important for deriving the segment revenue. In the product mapping method, we select and categorize the products offered by the companies catering to domain specific market, deduce the product revenue for each of the companies so as to get overall estimation of the market size. We also source data and analyses trends based on information received from supply side and demand side intermediaries in the value chain. The supply side denotes the data gathered from supplier, distributor, wholesaler and the demand side illustrates the data gathered from the end customers for respective market domain.

The supply side for a domain specific market is analysed by:
The demand side for the market is estimated through:
In-house Library: Apart from these third-party sources, we have our in-house library of qualitative and quantitative information. Our in-house database includes market data for various industry and domains. These data are updated on regular basis as per the changing market scenario. Our library includes, historic databases, internal audit reports and archives.
Sometimes there are instances where there is no metadata or raw data available for any domain specific market. For those cases, we use our expertise to forecast and estimate the market size in order to generate comprehensive data sets. Our analyst team adopt a robust research technique in order to produce the estimates:
Data Synthesis: This stage involves the analysis & mapping of all the information obtained from the previous step. It also involves in scrutinizing the data for any discrepancy observed while data gathering related to the market. The data is collected with consideration to the heterogeneity of sources. Robust scientific techniques are in place for synthesizing disparate data sets and provide the essential contextual information that can orient market strategies. The Brainy Insights has extensive experience in data synthesis where the data passes through various stages:


Market Deduction & Formulation: The final stage comprises of assigning data points at appropriate market spaces so as to deduce feasible conclusions. Analyst perspective & subject matter expert based holistic form of market sizing coupled with industry analysis also plays a crucial role in this stage.
This stage involves in finalization of the market size and numbers that we have collected from data integration step. With data interpolation, it is made sure that there is no gap in the market data. Successful trend analysis is done by our analysts using extrapolation techniques, which provide the best possible forecasts for the market.
Data Validation & Market Feedback: Validation is the most important step in the process. Validation & re-validation via an intricately designed process helps us finalize data-points to be used for final calculations.

The Brainy Insights interacts with leading companies and experts of the concerned domain to develop the analyst team’s market understanding and expertise. It improves and substantiates every single data presented in the market reports. The data validation interview and discussion panels are typically composed of the most experienced industry members. The participants include, however, are not limited to:
Moreover, we always validate our data and findings through primary respondents from all the major regions we are working on.


Free Customization
Fortune 500 Clients
Free Yearly Update On Purchase Of Multi/Corporate License
Companies Served Till Date