- +1-315-215-1633
- sales@thebrainyinsights.com

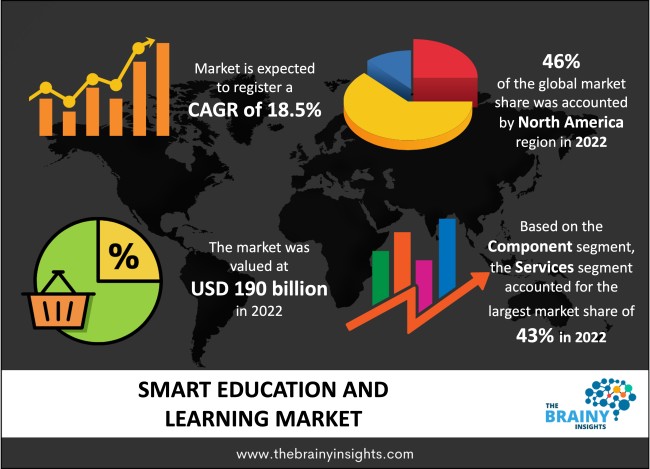
The global smart education and learning market was valued at USD 190 billion in 2022, growing at a CAGR of 18.5% from 2023 to 2032. The market is expected to reach USD 1037.3 billion by 2032. One of the key factors driving the market's expansion is the growing use of e-learning techniques by corporate organizations to design efficient training programmes for their personnel. Additionally, the smart education and learning market is anticipated to grow due to the increased demand for interactive learning methods like gamification and mobile educational applications.
Mobile device applications and learner mobility are the two main themes of smart education and learning solutions. Additionally, the smart education and learning environment offers a flexible environment that replaces conventional classroom instruction. Many educational institutions use smart education by implementing cutting-edge teaching techniques, including whiteboards, smart notebooks, etc. The rise in demand for the smart solutions for students, workers, and others to become digitally educated, improvements in the connectivity of handheld communication devices, and the rise in demand for collaboration-based learning are some factors driving the growth of the global smart education and learning market. Since the underlying principles of innovation were disseminated over the globe, smart education and learning have been an essential part of our way of life. The application of ongoing ideas has proven helpful for a few uses, including incisive instruction. The shifting social norms and educational paradigms have created a few development opportunities for the organizations on the lookout. As a result, the development of the general market has been aided by the presence of a few organizations with enormous scope in this region. The benefits of smart education and learning are notable to the immense interest in innovative incorporation, especially in exceptional situations like pandemics and crises.
Get an overview of this study by requesting a free sample
In October 2021, Saba Software will offer a platform for personalized learning experiences to improve user engagement.
March 2019 - Blackboard Inc. introduced its flagship learning management system (LMS), Blackboard Learn Ultra, at the Instituto de Educaço Superior de Brasil (IESB), a centre for higher education based in Brasilia (Brazil).
Rising Usage of E-Learning- Corporate companies' rising use of e-learning techniques to design efficient training programmes for their workers is one of the key drivers fueling the market's expansion. Additionally, as demand for interactive learning methods such as mobile educational applications and gamification rises, the smart education and learning market is anticipated to expand. To encourage production and collaboration while enhancing speed and efficiency, educational institutions worldwide are focusing on more dynamic methods of imparting knowledge. The "bring your device" (BYOD) policy in the classroom has inspired students to use their electronic aids while in class. Smart education and learning approaches have increased due to the advantages, including cost-effectiveness, ease of use, and enhanced focus.
Lack of Skilled Staff- The smart education and learning market is expected to be restrained owint to the lack of skilled staff. Furthermore, The high installation and maintenance expenses would also hamper the expansion of the smart education and learning market.
Technological Advancements- Constant technical developments and improvements in the connection of smart communication devices are the main factors providing growth opportunities to the market. Furthermore, governments in developing countries are increasingly using digital teaching, encouraging schools and organizations to employ innovative teaching and learning strategies. For example, the Ontario Ministry of Education (Canada) unveiled a plan in July 2021 stipulating that high school students must pass four online courses before graduating. As a result, Ontario's smart education and learning business is expected to provide growth opportunities for the market over the forecast period.
The regions analyzed for the market include North America, Europe, South America, Asia Pacific, the Middle East, and Africa. North America emerged as the largest market for the global smart education and learning market, with a 46% share of the market revenue in 2022.
This expansion is attributable to the existence of reputable ICT solution providers and a sizable customer base. The smart education and learning market is also anticipated to expand significantly in South America during the following years. It can be ascribed to cutting-edge technology like personalized literacy programmes, microlearning, gamification, and Massive Open Online Courses (MOOCs).
In February 2020, Pearson and Washington State University announced that their long-standing online degree partnership with the Carson College of Business would be renewed and expanded. Washington State University's online programme continues to see an increase in enrollment in a highly competitive market where general trends regarding MBA application volume are less and many programmes need help to combat enrolment decreases.
North America Region Smart Education and Learning Market Share in 2022 - 46%
www.thebrainyinsights.com
Check the geographical analysis of this market by requesting a free sample
The component segment is divided into software, educational content, services, and hardware. The services segment dominated the market, with a market share of around 43% in 2022. It can be linked to the availability of multiple intelligent learning and education portals that provide higher-quality educational information in the form of study guides, exam preparation materials, question banks, and instructional videos. For instance, the Western Cape Government in South Africa provides instructors and students access to various online learning tools available in both English and Afrikaans. The National Cloud Platform for Educational Resources and Public Service, which the People's Republic of China's Ministry of Education also offers primary and secondary school students free educational resources.
The end-user segment is divided into academics and corporate. The academics segment dominated the market, with a market share of around 58% in 2022. The requirement to ensure that employees have the necessary knowledge and skills to address future problems can be attributed to the rising demand for smart education and learning approaches in the organizational arena. Additionally, when the employee is away physically, smart education and learning can lower costs related to delivering traditional education and learning programmes.
| Attribute | Description |
|---|---|
| Market Size | Revenue (USD Billion) |
| Market size value in 2022 | USD 190 Billion |
| Market size value in 2032 | USD 1037.3 Billion |
| CAGR (2023 to 2032) | 18.5% |
| Historical data | 2019-2021 |
| Base Year | 2022 |
| Forecast | 2023-2032 |
| Region | The regions analyzed for the market are Asia Pacific, Europe, South America, North America, and Middle East & Africa. Furthermore, the regions are further analyzed at the country level. |
| Segments | Component, End-User |
As per The Brainy Insights, the size of the smart education and learning market was valued at USD 190 billion in 2022 to USD 1037.3 billion by 2032.
The global smart education and learning market is growing at a CAGR of 18.5% during the forecast period 2023-2032.
North America emerged as the largest smart education and learning market.
1. Introduction
1.1. Objectives of the Study
1.2. Market Definition
1.3. Research Scope
1.4. Currency
1.5. Key Target Audience
2. Research Methodology and Assumptions
3. Executive Summary
4. Premium Insights
4.1. Porter’s Five Forces Analysis
4.2. Value Chain Analysis
4.3. Top Investment Pockets
4.3.1. Market Attractiveness Analysis by Component
4.3.2. Market Attractiveness Analysis by End-User
4.3.3. Market Attractiveness Analysis by Region
4.4. Industry Trends
5. Market Dynamics
5.1. Market Evaluation
5.2. Drivers
5.2.1. Rising usage of e-learning
5.3. Restraints
5.3.1. Lack of skilled staff
5.4. Opportunities
5.4.1. Technological advancements
5.5. Challenges
5.5.1. High cost
6. Global Smart Education and Learning Market Analysis and Forecast, By Component
6.1. Segment Overview
6.2. Software
6.3. Educational Content
6.4. Services
6.5. Hardware
7. Global Smart Education and Learning Market Analysis and Forecast, By End-User
7.1. Segment Overview
7.2. Academics
7.3. Corporate
8. Global Smart Education and Learning Market Analysis and Forecast, By Regional Analysis
8.1. Segment Overview
8.2. North America
8.2.1. U.S.
8.2.2. Canada
8.2.3. Mexico
8.3. Europe
8.3.1. Germany
8.3.2. France
8.3.3. U.K.
8.3.4. Italy
8.3.5. Spain
8.4. Asia-Pacific
8.4.1. Japan
8.4.2. China
8.4.3. India
8.5. South America
8.5.1. Brazil
8.6. Middle East and Africa
8.6.1. UAE
8.6.2. South Africa
9. Global Smart Education and Learning Market-Competitive Landscape
9.1. Overview
9.2. Market Share of Key Players in Global Smart Education and Learning Market
9.2.1. Global Company Market Share
9.2.2. North America Company Market Share
9.2.3. Europe Company Market Share
9.2.4. APAC Company Market Share
9.3. Competitive Situations and Trends
9.3.1. Product Launches and Developments
9.3.2. Partnerships, Collaborations, and Agreements
9.3.3. Mergers & Acquisitions
9.3.4. Expansions
10. Company Profiles
10.1. Adobe Systems Incorporated
10.1.1. Business Overview
10.1.2. Company Snapshot
10.1.3. Company Market Share Analysis
10.1.4. Company Product Portfolio
10.1.5. Recent Developments
10.1.6. SWOT Analysis
10.2. Educomp Solutions Ltd.
10.2.1. Business Overview
10.2.2. Company Snapshot
10.2.3. Company Market Share Analysis
10.2.4. Company Product Portfolio
10.2.5. Recent Developments
10.2.6. SWOT Analysis
10.3. NIIT Limited
10.3.1. Business Overview
10.3.2. Company Snapshot
10.3.3. Company Market Share Analysis
10.3.4. Company Product Portfolio
10.3.5. Recent Developments
10.3.6. SWOT Analysis
10.4. Smart Technologies, Inc.
10.4.1. Business Overview
10.4.2. Company Snapshot
10.4.3. Company Market Share Analysis
10.4.4. Company Product Portfolio
10.4.5. Recent Developments
10.4.6. SWOT Analysis
10.5. Blackboard, Inc.
10.5.1. Business Overview
10.5.2. Company Snapshot
10.5.3. Company Market Share Analysis
10.5.4. Company Product Portfolio
10.5.5. Recent Developments
10.5.6. SWOT Analysis
10.6. Ellucian Company L.P.
10.6.1. Business Overview
10.6.2. Company Snapshot
10.6.3. Company Market Share Analysis
10.6.4. Company Product Portfolio
10.6.5. Recent Developments
10.6.6. SWOT Analysis
10.7. Saba Software, Inc.
10.7.1. Business Overview
10.7.2. Company Snapshot
10.7.3. Company Market Share Analysis
10.7.4. Company Product Portfolio
10.7.5. Recent Developments
10.7.6. SWOT Analysis
10.8. Unit4
10.8.1. Business Overview
10.8.2. Company Snapshot
10.8.3. Company Market Share Analysis
10.8.4. Company Product Portfolio
10.8.5. Recent Developments
10.8.6. SWOT Analysis
10.9. Desire2Learn Corporation Ltd.
10.9.1. Business Overview
10.9.2. Company Snapshot
10.9.3. Company Market Share Analysis
10.9.4. Company Product Portfolio
10.9.5. Recent Developments
10.9.6. SWOT Analysis
10.10. Cisco Systems, Inc.
10.10.1. Business Overview
10.10.2. Company Snapshot
10.10.3. Company Market Share Analysis
10.10.4. Company Product Portfolio
10.10.5. Recent Developments
10.10.6. SWOT Analysis
List of Table
1. Global Smart Education and Learning Market, By Component, 2019-2032 (USD Billion)
2. Global Software, Smart Education and Learning Market, By Region, 2019-2032 (USD Billion)
3. Global Educational Content, Smart Education and Learning Market, By Region, 2019-2032 (USD Billion)
4. Global Services, Smart Education and Learning Market, By Region, 2019-2032 (USD Billion)
5. Global Hardware, Smart Education and Learning Market, By Region, 2019-2032 (USD Billion)
6. Global Smart Education and Learning Market, By End-User, 2019-2032 (USD Billion)
7. Global Academics, Smart Education and Learning Market, By Region, 2019-2032 (USD Billion)
8. Global Corporate, Smart Education and Learning Market, By Region, 2019-2032 (USD Billion)
9. North America Smart Education and Learning Market, By Component, 2019-2032 (USD Billion)
10. North America Smart Education and Learning Market, By End-User, 2019-2032 (USD Billion)
11. U.S. Smart Education and Learning Market, By Component, 2019-2032 (USD Billion)
12. U.S. Smart Education and Learning Market, By End-User, 2019-2032 (USD Billion)
13. Canada Smart Education and Learning Market, By Component, 2019-2032 (USD Billion)
14. Canada Smart Education and Learning Market, By End-User, 2019-2032 (USD Billion)
15. Mexico Smart Education and Learning Market, By Component, 2019-2032 (USD Billion)
16. Mexico Smart Education and Learning Market, By End-User, 2019-2032 (USD Billion)
17. Europe Smart Education and Learning Market, By Component, 2019-2032 (USD Billion)
18. Europe Smart Education and Learning Market, By End-User, 2019-2032 (USD Billion)
19. Germany Smart Education and Learning Market, By Component, 2019-2032 (USD Billion)
20. Germany Smart Education and Learning Market, By End-User, 2019-2032 (USD Billion)
21. France Smart Education and Learning Market, By Component, 2019-2032 (USD Billion)
22. France Smart Education and Learning Market, By End-User, 2019-2032 (USD Billion)
23. U.K. Smart Education and Learning Market, By Component, 2019-2032 (USD Billion)
24. U.K. Smart Education and Learning Market, By End-User, 2019-2032 (USD Billion)
25. Italy Smart Education and Learning Market, By Component, 2019-2032 (USD Billion)
26. Italy Smart Education and Learning Market, By End-User, 2019-2032 (USD Billion)
27. Spain Smart Education and Learning Market, By Component, 2019-2032 (USD Billion)
28. Spain Smart Education and Learning Market, By End-User, 2019-2032 (USD Billion)
29. Asia Pacific Smart Education and Learning Market, By Component, 2019-2032 (USD Billion)
30. Asia Pacific Smart Education and Learning Market, By End-User, 2019-2032 (USD Billion)
31. Japan Smart Education and Learning Market, By Component, 2019-2032 (USD Billion)
32. Japan Smart Education and Learning Market, By End-User, 2019-2032 (USD Billion)
33. China Smart Education and Learning Market, By Component, 2019-2032 (USD Billion)
34. China Smart Education and Learning Market, By End-User, 2019-2032 (USD Billion)
35. India Smart Education and Learning Market, By Component, 2019-2032 (USD Billion)
36. India Smart Education and Learning Market, By End-User, 2019-2032 (USD Billion)
37. South America Smart Education and Learning Market, By Component, 2019-2032 (USD Billion)
38. South America Smart Education and Learning Market, By End-User, 2019-2032 (USD Billion)
39. Brazil Smart Education and Learning Market, By Component, 2019-2032 (USD Billion)
40. Brazil Smart Education and Learning Market, By End-User, 2019-2032 (USD Billion)
41. Middle East and Africa Smart Education and Learning Market, By Component, 2019-2032 (USD Billion)
42. Middle East and Africa Smart Education and Learning Market, By End-User, 2019-2032 (USD Billion)
43. UAE Smart Education and Learning Market, By Component, 2019-2032 (USD Billion)
44. UAE Smart Education and Learning Market, By End-User, 2019-2032 (USD Billion)
45. South Africa Smart Education and Learning Market, By Component, 2019-2032 (USD Billion)
46. South Africa Smart Education and Learning Market, By End-User, 2019-2032 (USD Billion)
List of Figures
1. Global Smart Education and Learning Market Segmentation
2. Global Smart Education and Learning Market: Research Methodology
3. Market Size Estimation Methodology: Bottom-Up Approach
4. Market Size Estimation Methodology: Top-Down Approach
5. Data Triangulation
6. Porter’s Five Forces Analysis
7. Value Chain Analysis
8. Global Smart Education and Learning Market Attractiveness Analysis by Component
9. Global Smart Education and Learning Market Attractiveness Analysis by End-User
10. Global Smart Education and Learning Market Attractiveness Analysis by Region
11. Global Smart Education and Learning Market: Dynamics
12. Global Smart Education and Learning Market Share by Component (2023 & 2032)
13. Global Smart Education and Learning Market Share by End-User (2023 & 2032)
14. Global Smart Education and Learning Market Share by Regions (2023 & 2032)
15. Global Smart Education and Learning Market Share by Company (2022)
This study forecasts global, regional, and country revenue from 2019 to 2032. The Brainy Insights has segmented the global smart education and learning market based on the below-mentioned segments:
Global Smart Education and Learning Market By Component:
Global Smart Education and Learning Market By End-User:
Global Smart Education and Learning Market By Region:
Research has its special purpose to undertake marketing efficiently. In this competitive scenario, businesses need information across all industry verticals; the information about customer wants, market demand, competition, industry trends, distribution channels etc. This information needs to be updated regularly because businesses operate in a dynamic environment. Our organization, The Brainy Insights incorporates scientific and systematic research procedures in order to get proper market insights and industry analysis for overall business success. The analysis consists of studying the market from a miniscule level wherein we implement statistical tools which helps us in examining the data with accuracy and precision.
Our research reports feature both; quantitative and qualitative aspects for any market. Qualitative information for any market research process are fundamental because they reveal the customer needs and wants, usage and consumption for any product/service related to a specific industry. This in turn aids the marketers/investors in knowing certain perceptions of the customers. Qualitative research can enlighten about the different product concepts and designs along with unique service offering that in turn, helps define marketing problems and generate opportunities. On the other hand, quantitative research engages with the data collection process through interviews, e-mail interactions, surveys and pilot studies. Quantitative aspects for the market research are useful to validate the hypotheses generated during qualitative research method, explore empirical patterns in the data with the help of statistical tools, and finally make the market estimations.
The Brainy Insights offers comprehensive research and analysis, based on a wide assortment of factual insights gained through interviews with CXOs and global experts and secondary data from reliable sources. Our analysts and industry specialist assume vital roles in building up statistical tools and analysis models, which are used to analyse the data and arrive at accurate insights with exceedingly informative research discoveries. The data provided by our organization have proven precious to a diverse range of companies, facilitating them to address issues such as determining which products/services are the most appealing, whether or not customers use the product in the manner anticipated, the purchasing intentions of the market and many others.
Our research methodology encompasses an idyllic combination of primary and secondary initiatives. Key phases involved in this process are listed below:

The phase involves the gathering and collecting of market data and its related information with the help of different sources & research procedures.

The data procurement stage involves in data gathering and collecting through various data sources.
This stage involves in extensive research. These data sources includes:
Purchased Database: Purchased databases play a crucial role in estimating the market sizes irrespective of the domain. Our purchased database includes:
Primary Research: The Brainy Insights interacts with leading companies and experts of the concerned domain to develop the analyst team’s market understanding and expertise. It improves and substantiates every single data presented in the market reports. Primary research mainly involves in telephonic interviews, E-mail interactions and face-to-face interviews with the raw material providers, manufacturers/producers, distributors, & independent consultants. The interviews that we conduct provides valuable data on market size and industry growth trends prevailing in the market. Our organization also conducts surveys with the various industry experts in order to gain overall insights of the industry/market. For instance, in healthcare industry we conduct surveys with the pharmacists, doctors, surgeons and nurses in order to gain insights and key information of a medical product/device/equipment which the customers are going to usage. Surveys are conducted in the form of questionnaire designed by our own analyst team. Surveys plays an important role in primary research because surveys helps us to identify the key target audiences of the market. Additionally, surveys helps to identify the key target audience engaged with the market. Our survey team conducts the survey by targeting the key audience, thus gaining insights from them. Based on the perspectives of the customers, this information is utilized to formulate market strategies. Moreover, market surveys helps us to understand the current competitive situation of the industry. To be precise, our survey process typically involve with the 360 analysis of the market. This analytical process begins by identifying the prospective customers for a product or service related to the market/industry to obtain data on how a product/service could fit into customers’ lives.

Secondary Research: The secondary data sources includes information published by the on-profit organizations such as World bank, WHO, company fillings, investor presentations, annual reports, national government documents, statistical databases, blogs, articles, white papers and others. From the annual report, we analyse a company’s revenue to understand the key segment and market share of that organization in a particular region. We analyse the company websites and adopt the product mapping technique which is important for deriving the segment revenue. In the product mapping method, we select and categorize the products offered by the companies catering to domain specific market, deduce the product revenue for each of the companies so as to get overall estimation of the market size. We also source data and analyses trends based on information received from supply side and demand side intermediaries in the value chain. The supply side denotes the data gathered from supplier, distributor, wholesaler and the demand side illustrates the data gathered from the end customers for respective market domain.

The supply side for a domain specific market is analysed by:
The demand side for the market is estimated through:
In-house Library: Apart from these third-party sources, we have our in-house library of qualitative and quantitative information. Our in-house database includes market data for various industry and domains. These data are updated on regular basis as per the changing market scenario. Our library includes, historic databases, internal audit reports and archives.
Sometimes there are instances where there is no metadata or raw data available for any domain specific market. For those cases, we use our expertise to forecast and estimate the market size in order to generate comprehensive data sets. Our analyst team adopt a robust research technique in order to produce the estimates:
Data Synthesis: This stage involves the analysis & mapping of all the information obtained from the previous step. It also involves in scrutinizing the data for any discrepancy observed while data gathering related to the market. The data is collected with consideration to the heterogeneity of sources. Robust scientific techniques are in place for synthesizing disparate data sets and provide the essential contextual information that can orient market strategies. The Brainy Insights has extensive experience in data synthesis where the data passes through various stages:


Market Deduction & Formulation: The final stage comprises of assigning data points at appropriate market spaces so as to deduce feasible conclusions. Analyst perspective & subject matter expert based holistic form of market sizing coupled with industry analysis also plays a crucial role in this stage.
This stage involves in finalization of the market size and numbers that we have collected from data integration step. With data interpolation, it is made sure that there is no gap in the market data. Successful trend analysis is done by our analysts using extrapolation techniques, which provide the best possible forecasts for the market.
Data Validation & Market Feedback: Validation is the most important step in the process. Validation & re-validation via an intricately designed process helps us finalize data-points to be used for final calculations.

The Brainy Insights interacts with leading companies and experts of the concerned domain to develop the analyst team’s market understanding and expertise. It improves and substantiates every single data presented in the market reports. The data validation interview and discussion panels are typically composed of the most experienced industry members. The participants include, however, are not limited to:
Moreover, we always validate our data and findings through primary respondents from all the major regions we are working on.


Free Customization
Fortune 500 Clients
Free Yearly Update On Purchase Of Multi/Corporate License
Companies Served Till Date